HENGSHI SENSE System Initialization and Subsequent Operations
After the system installation is successful, the initial state is shown in the figure below. You need to create a system administrator first:
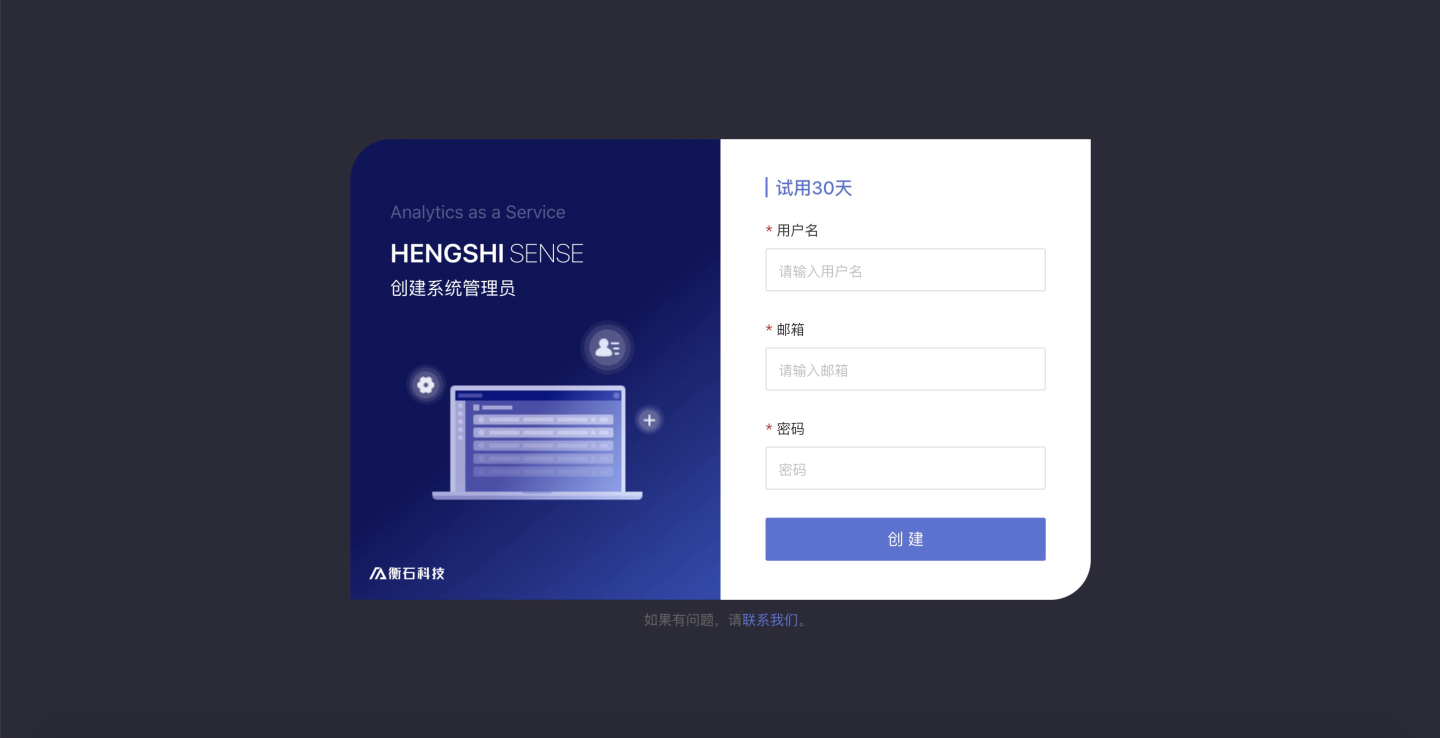
Enter the username, email, and password, then click Create, and the system administrator account will be successfully created.
After the system administrator is successfully created, the page will redirect to the login page, as shown below:
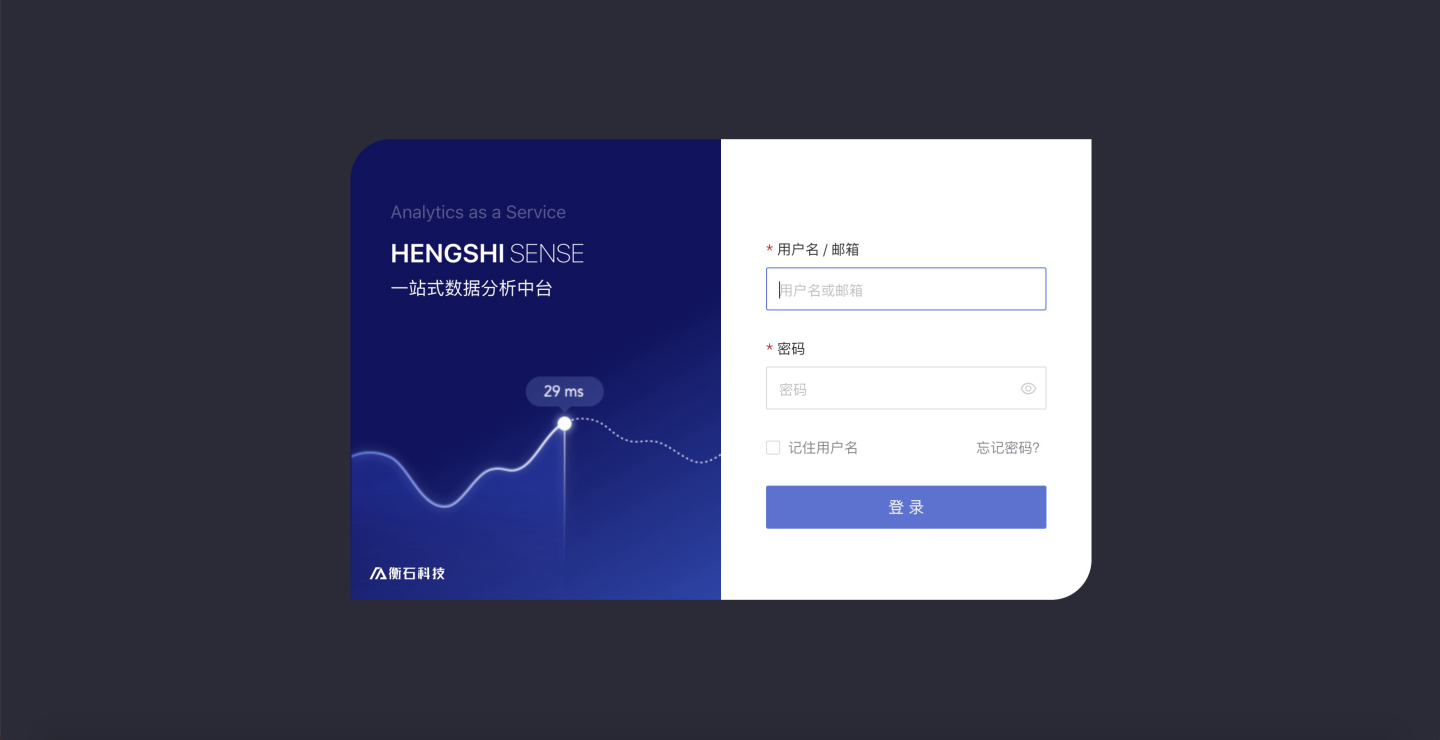
Enter the username or email of the already created system administrator, password, and click Login to log into the system.
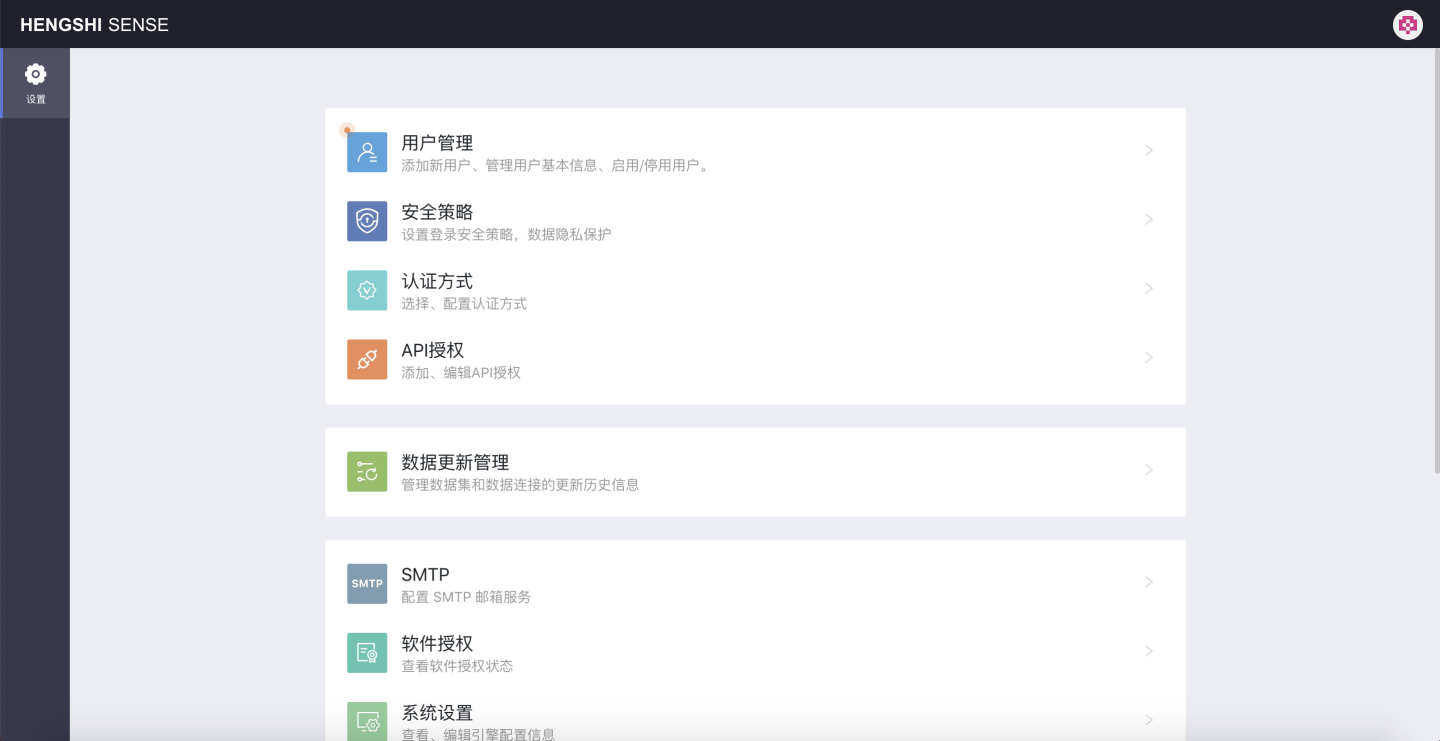
After the system administrator logs into the system, the page appears as shown below, where various system settings can be configured:
First: Configure Users
Version Information: User Configuration Information. In various configuration items, first add users, with information prompts as shown in the following figure:
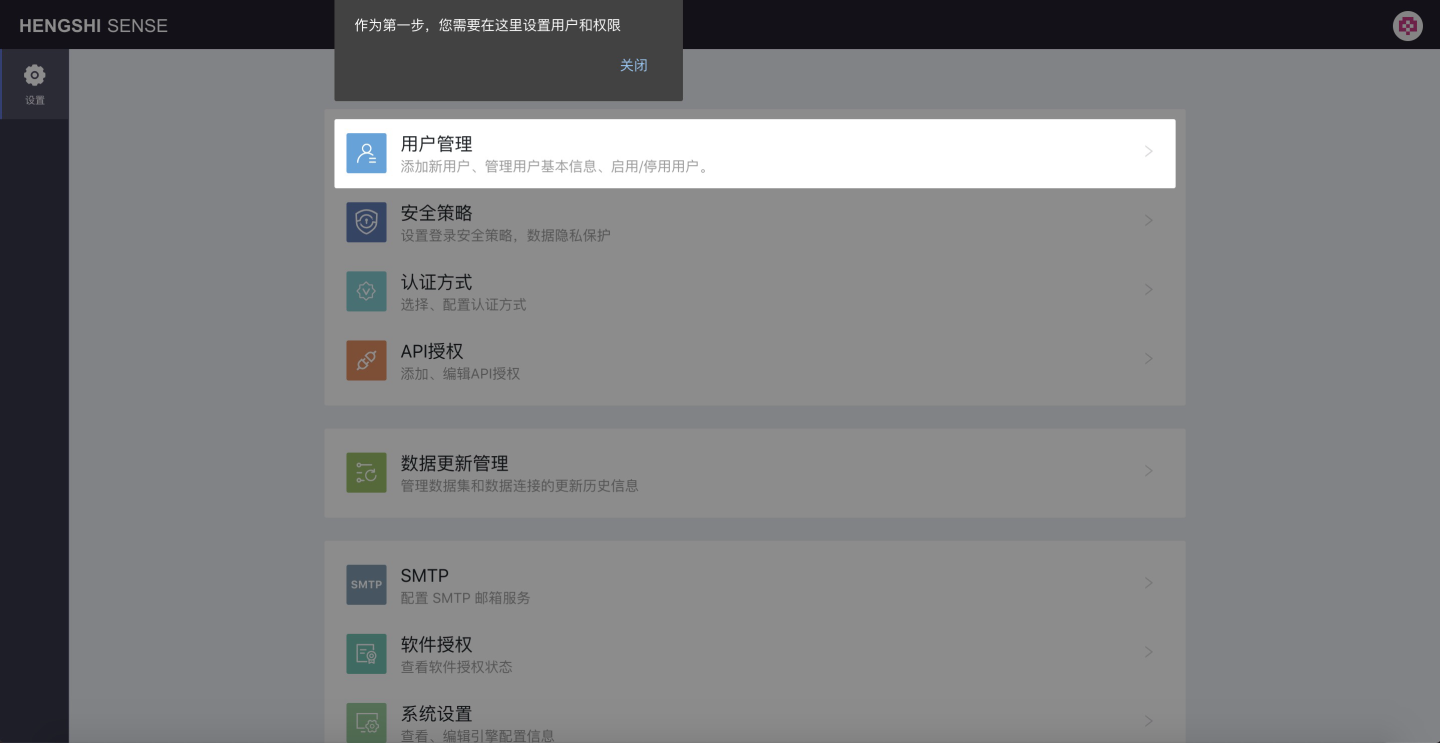
Create User
Click the User Management button to configure users:
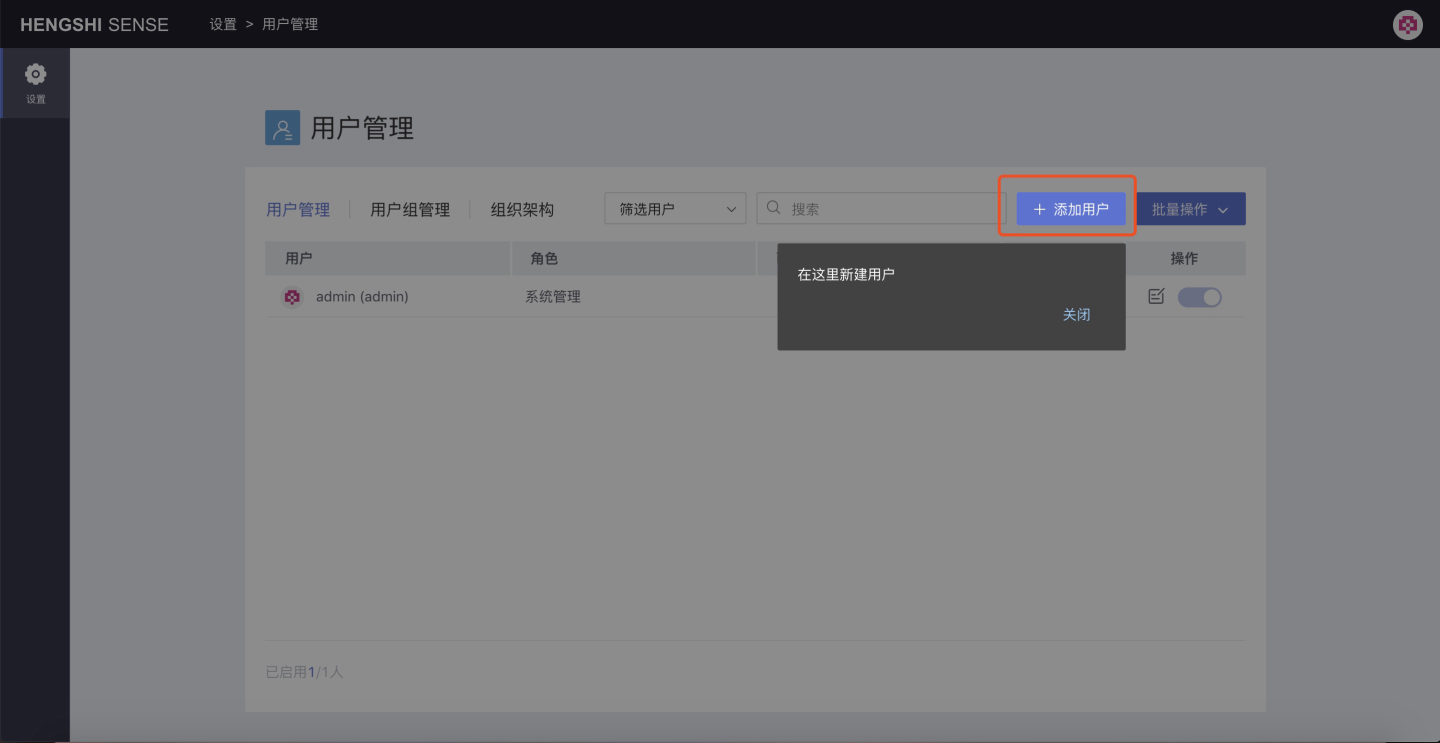
As shown in the figure above, click Add User to add a new user, and the Add User information setting window will pop up:
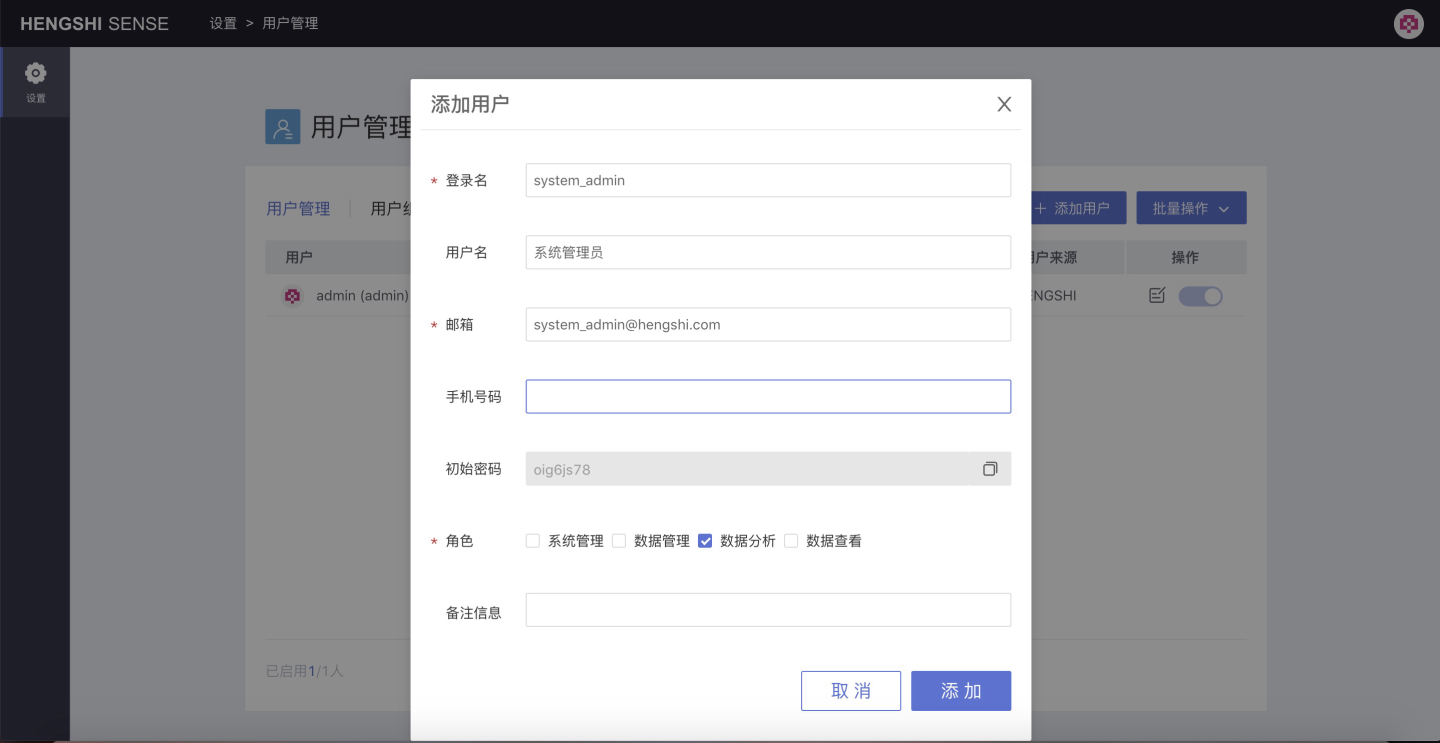
As shown in the figure above, the required information includes username, password, and role:
- The login name is required and uniquely identifies the user. It can be used later to log in to the system with a username + password.
- The email is required and uniquely identifies the user. It can be used later to log in to the system with an email + password.
- The role is required. The default role is
Data Analysis. You can select one or more roles for the user by checking the checkboxes in front of each role. A comfortable password will be generated when adding a new user.
Optional fields include username, phone number, and remarks:
- Username: Display name in various prompt messages, not unique
- Phone Number: Not unique
- Remarks
Additionally, when creating a new user, the system will generate an initial password for that user. Click the Copy button to the right to copy this password.
Restrictions:
- Login Name: Cannot contain special characters or start with a number, and must be unique.
- Email: Must enter a valid email address, and must be unique.
Attention
- Initial Password: Users need to verify their identity information through Username + Password, Email + Password when logging in.
- User Role: The default value is Data Analysis, and it needs to be manually changed to the appropriate role.
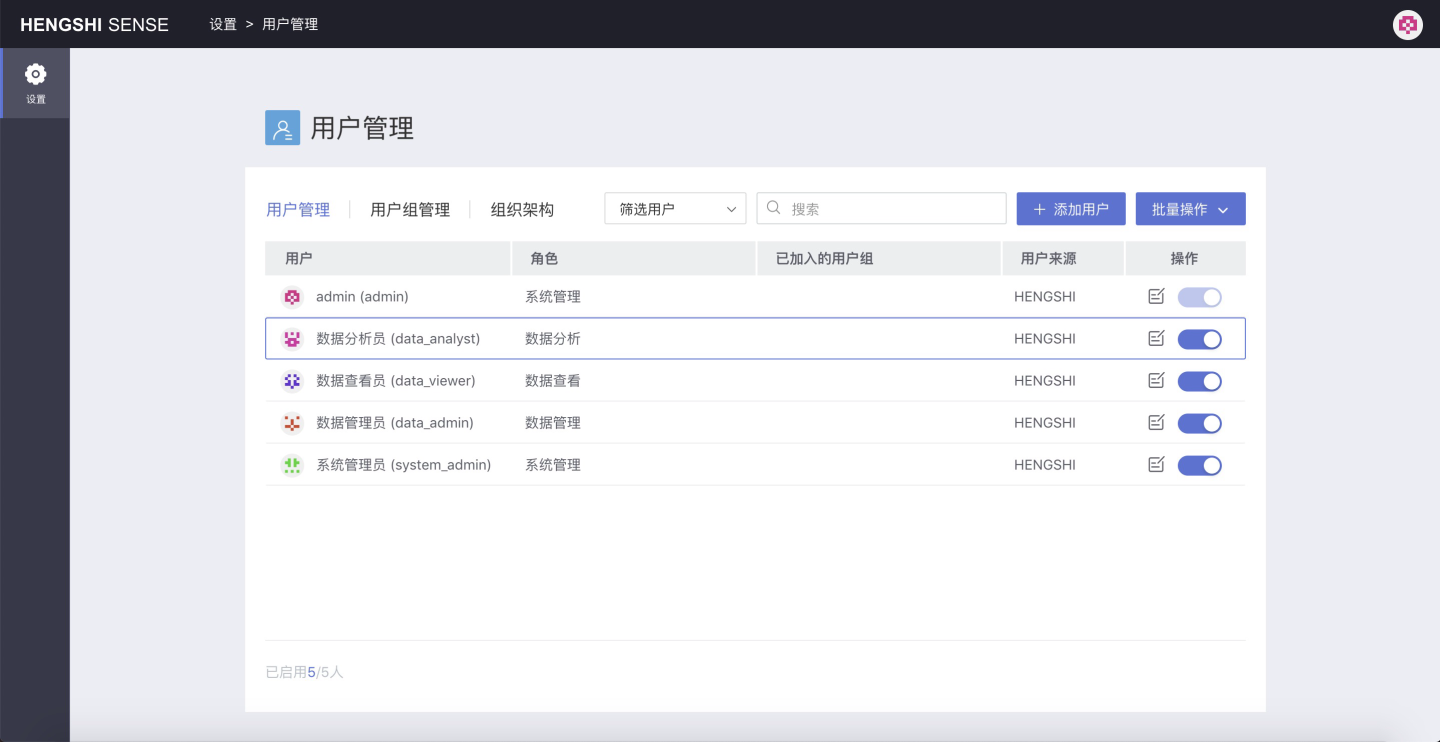
As mentioned above, after configuring the user information, click Add to successfully create a user. In the current system, based on the functions of different roles, four new users are created:
- data_analyst: Data Analyst
- data_viewer: Data Viewer
- data_admin: Data Administrator
- system_admin: System Administrator
Modify User
Modify User Information
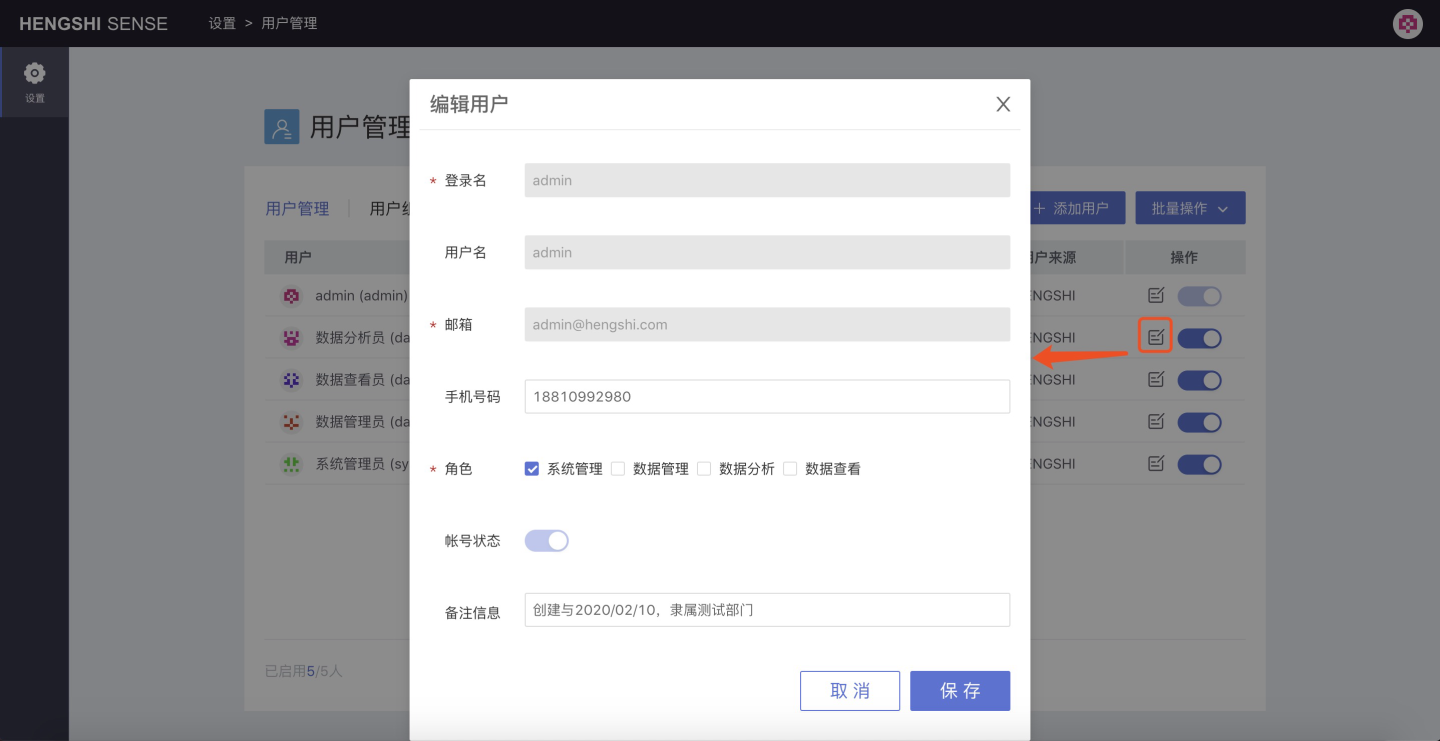
Modifiable: Phone Number, Account Status (Disabled/Enabled), Remark Information
Enable/Disable User
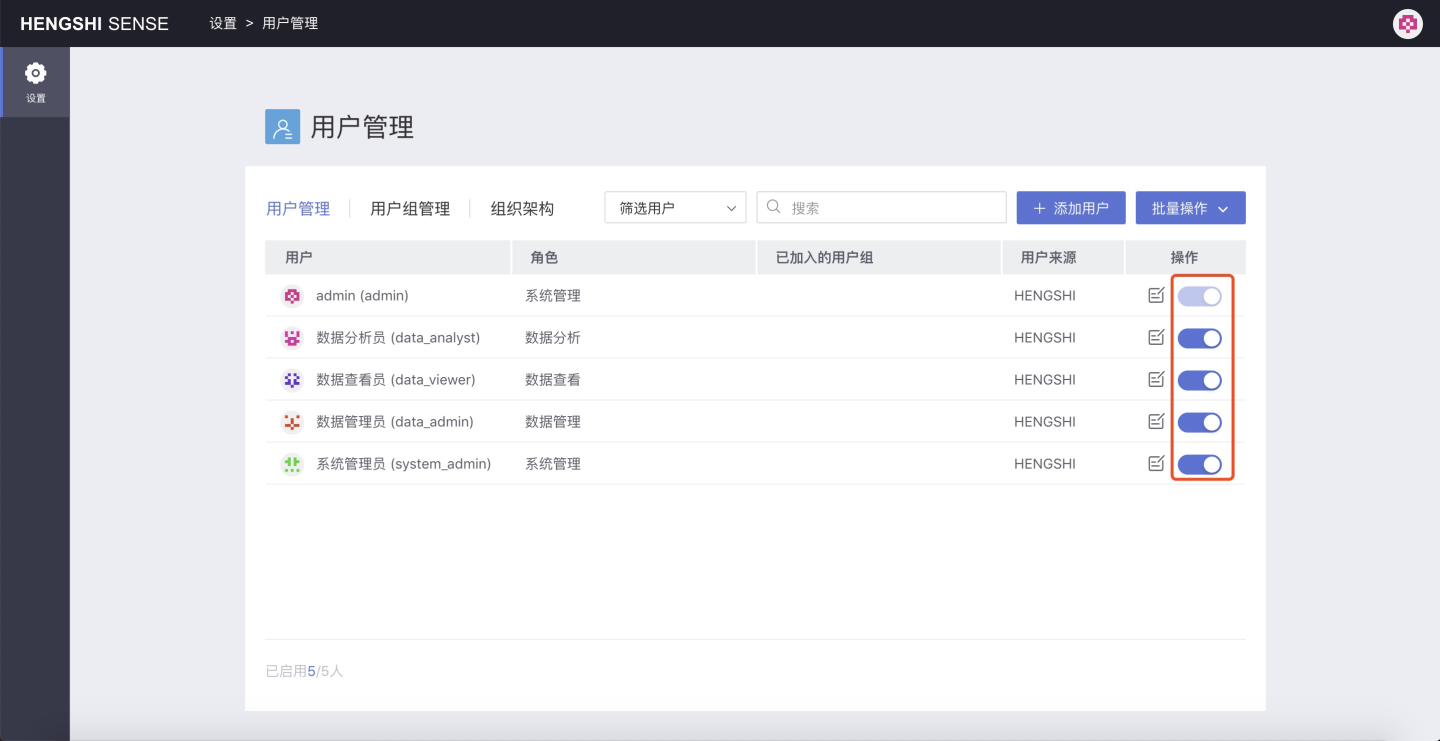
Click the on/off button in the
Operationto enable or disable the account, which has the same meaning as theAccount Statuswhen editing user information.Batch Operations
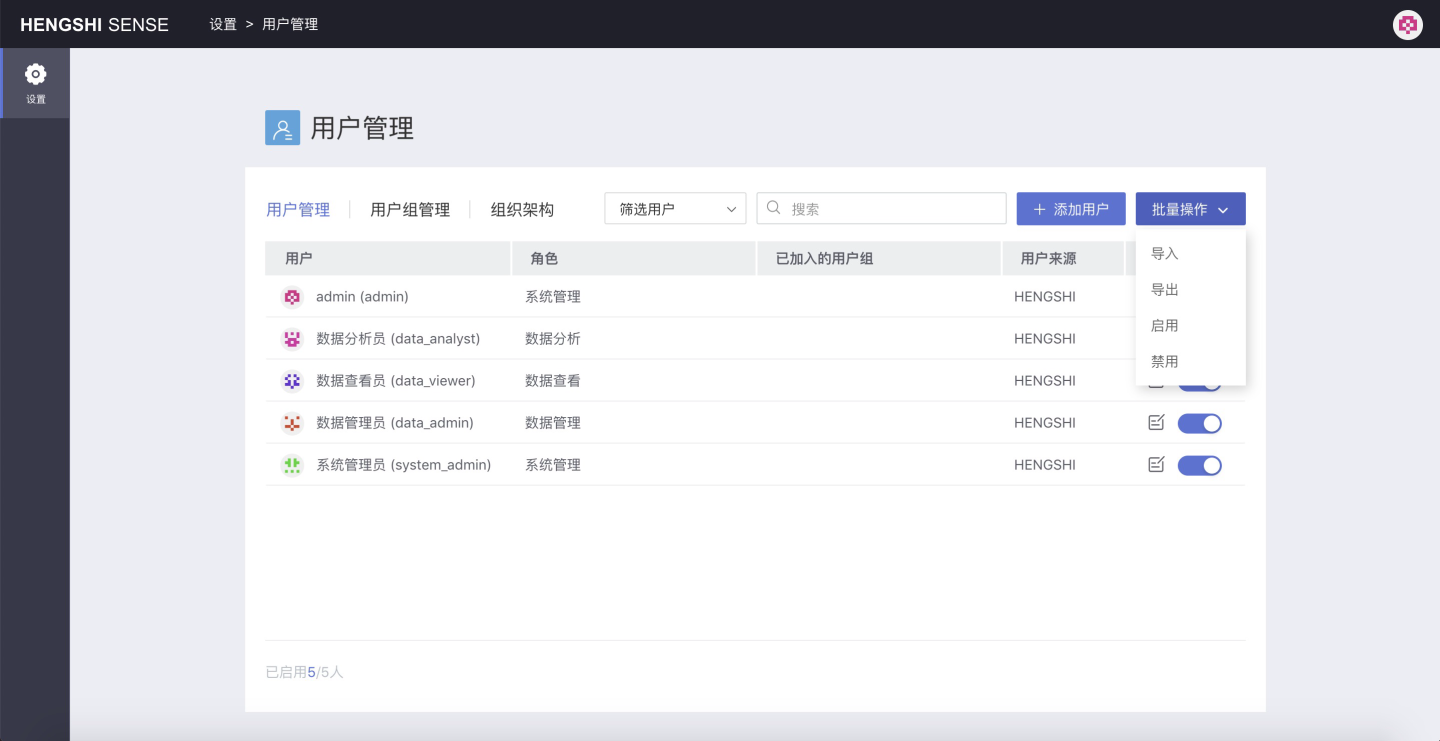
Import, Export: You can batch export user information and batch upload users. For specific operations, see User Management in Batch Operations
Note for batch import user operations:
- Information that can be modified:
- Username (name)
- User attributes ()
- User group information (organizations)
- User password (password)
- Roles (roles)
- Information that cannot be updated:
- Username (login_name)
- Email (Email)
- Update principle when uploading:
- If either login_name or email matches an existing user
- Ignore this row of information from the upload file
- If neither login_name nor email matches an existing user
- The upload file contains an id
- If the id cannot match an existing user: Create a new user
- If the id can match an existing user: Update modifiable information
- The upload file does not contain an id column
- Create a new user
- The upload file contains an id
- If either login_name or email matches an existing user
- If the password column in the upload file is empty
- For newly created users: Default password 'hs2019'
- For updated users: Keep the existing password in the database unchanged
- Upload recommendations
- Do not include an id column to prevent new users from having the same id as existing users, causing user information to be updated
Enable, Disable: You can batch disable or batch enable the filtered users
- Information that can be modified:
New User Login
When a user first logs into the system, they need to reset their password. Below is an example using the user data_analyst:
Enter your username and password in the login window:
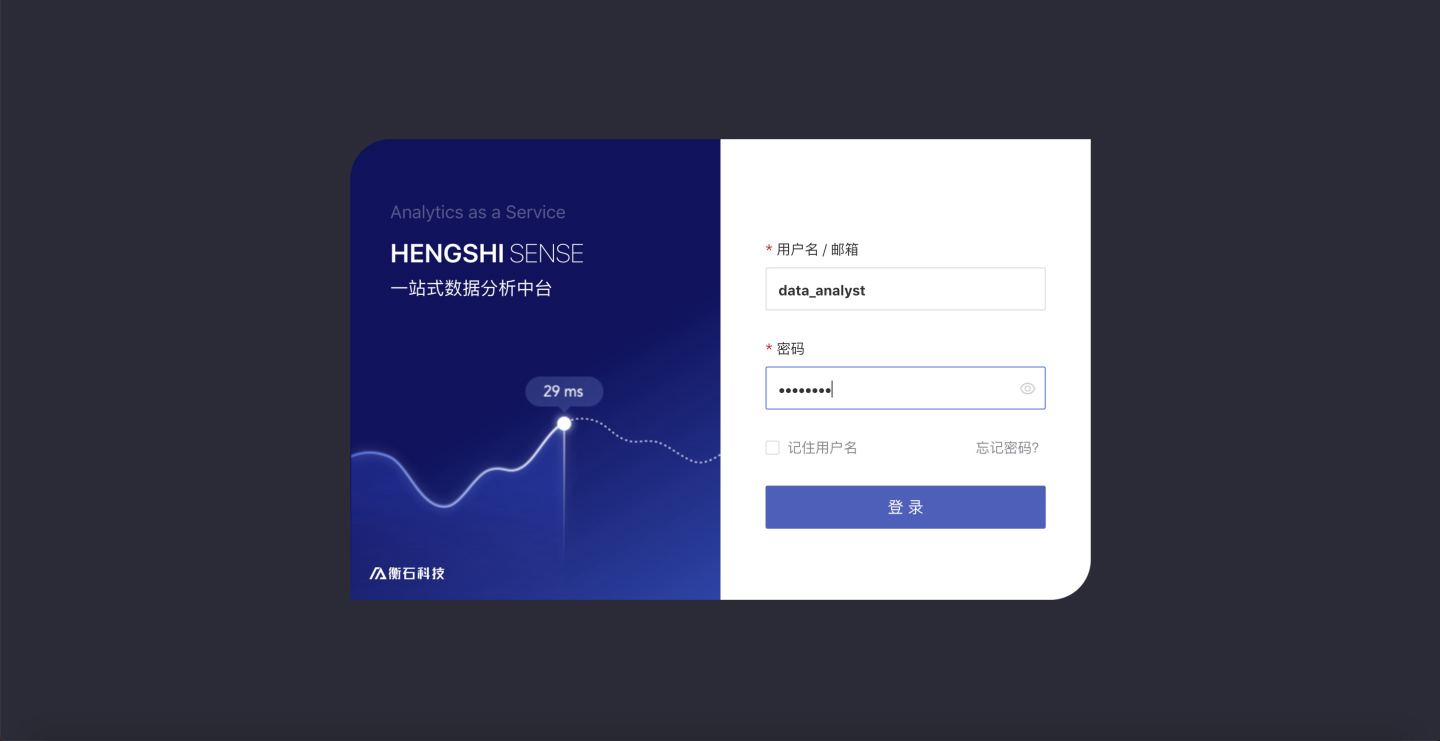
Click to log in, and you will be redirected to the login page, where you can proceed through
Second: Data Connection
Version Information: Data Connection, this section has not been modified in version 3.0, users of version 2.X can also refer to the content of this section for configuration.
Before performing a series of data processing operations, you first need to create a new data connection. Data connections are configured by users with the Data Management role; accounts of other roles cannot create connections.
Below, taking Data Administrator (data_admin) as an example, after logging into the system, click Data Connection:
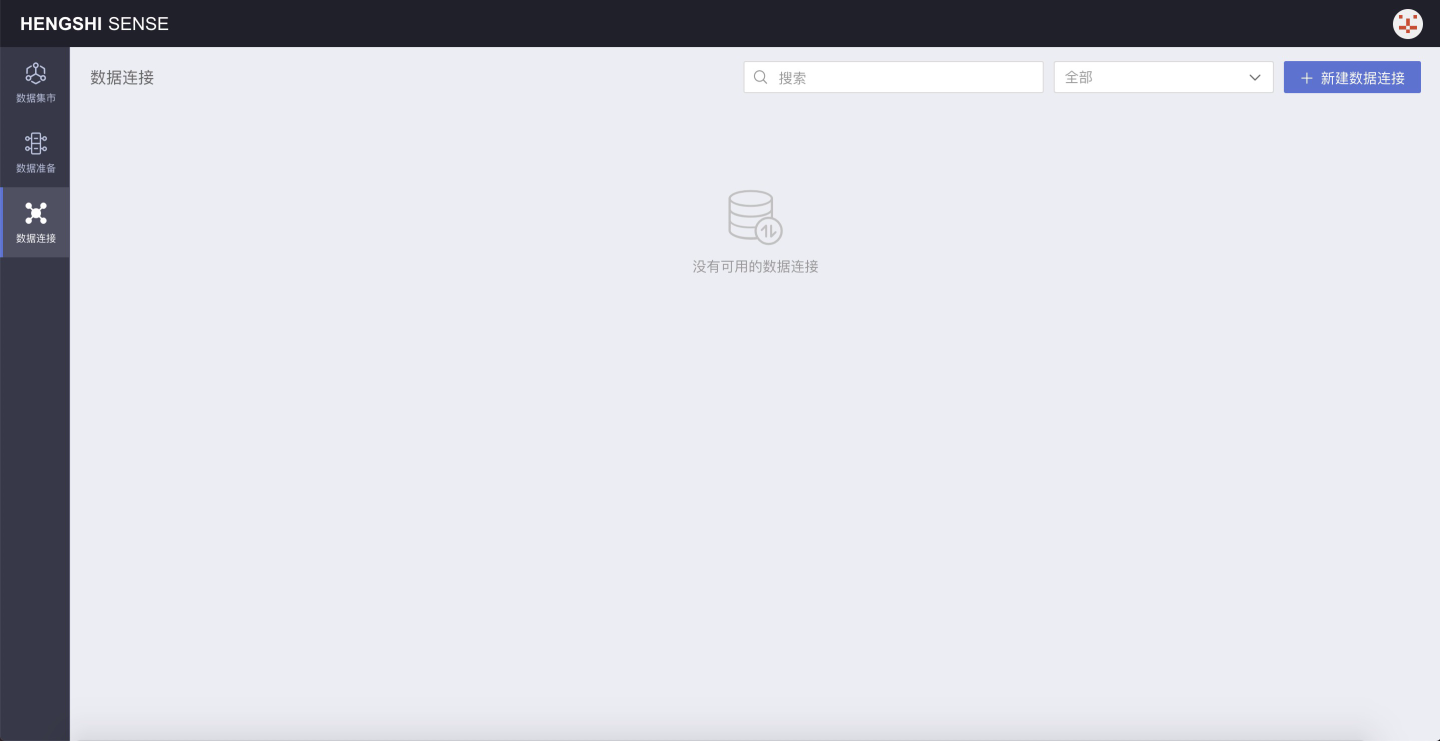
You can create a new data connection on this page, with the button New Data Connection located at the top right corner:
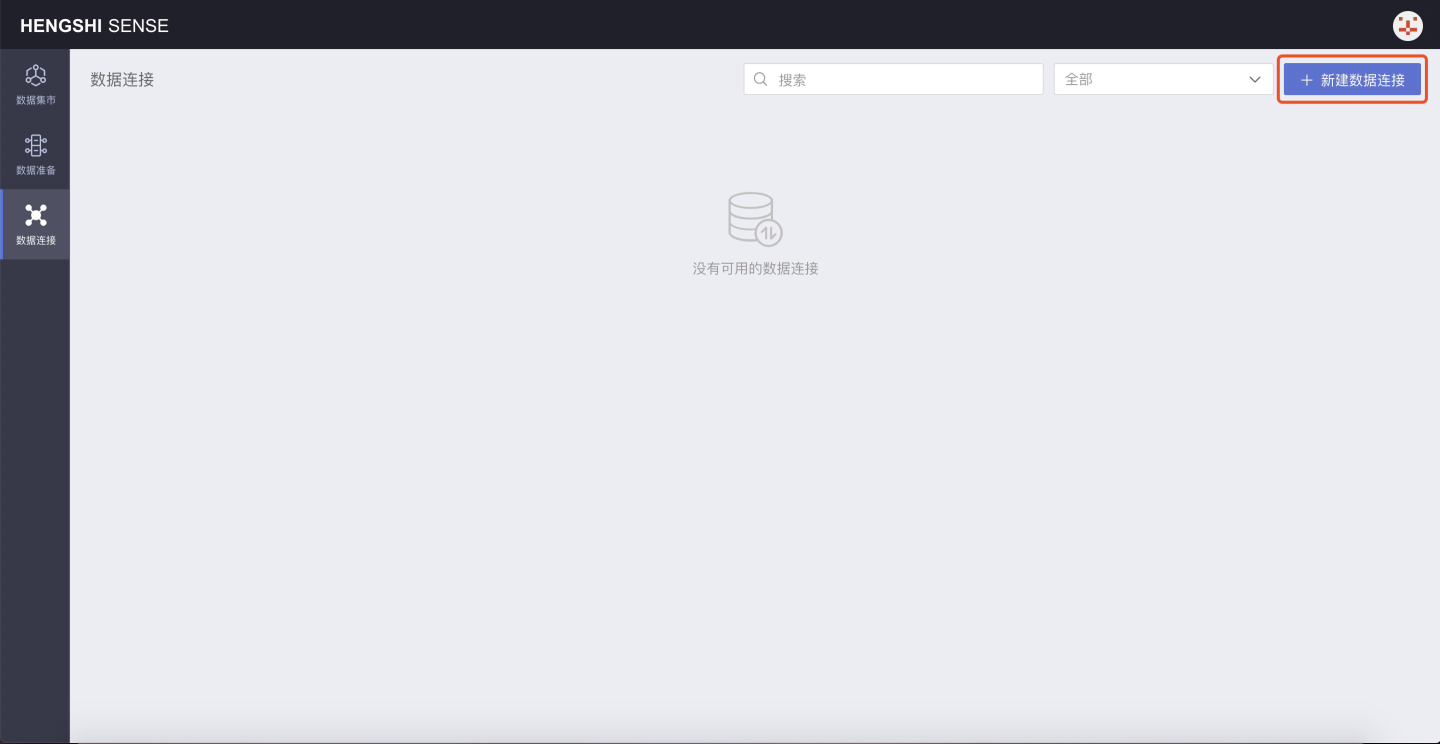
Click New Data Connection to open the connection type selection page:
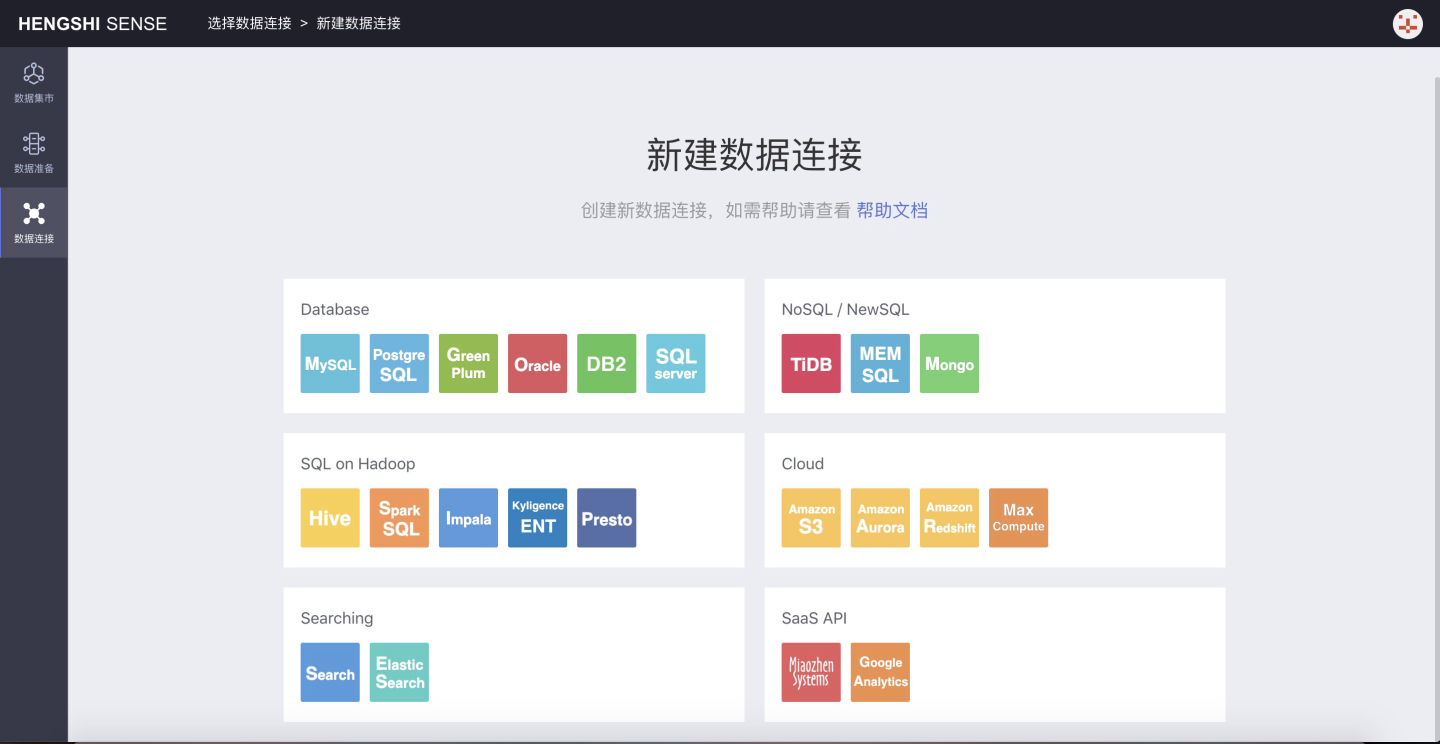
You can select a data connection based on your company's database. Below is an example of creating a new Green Plum data connection:
Database 中可以选择 Green Plum 连接:
You can choose Green Plum connection in the Database:
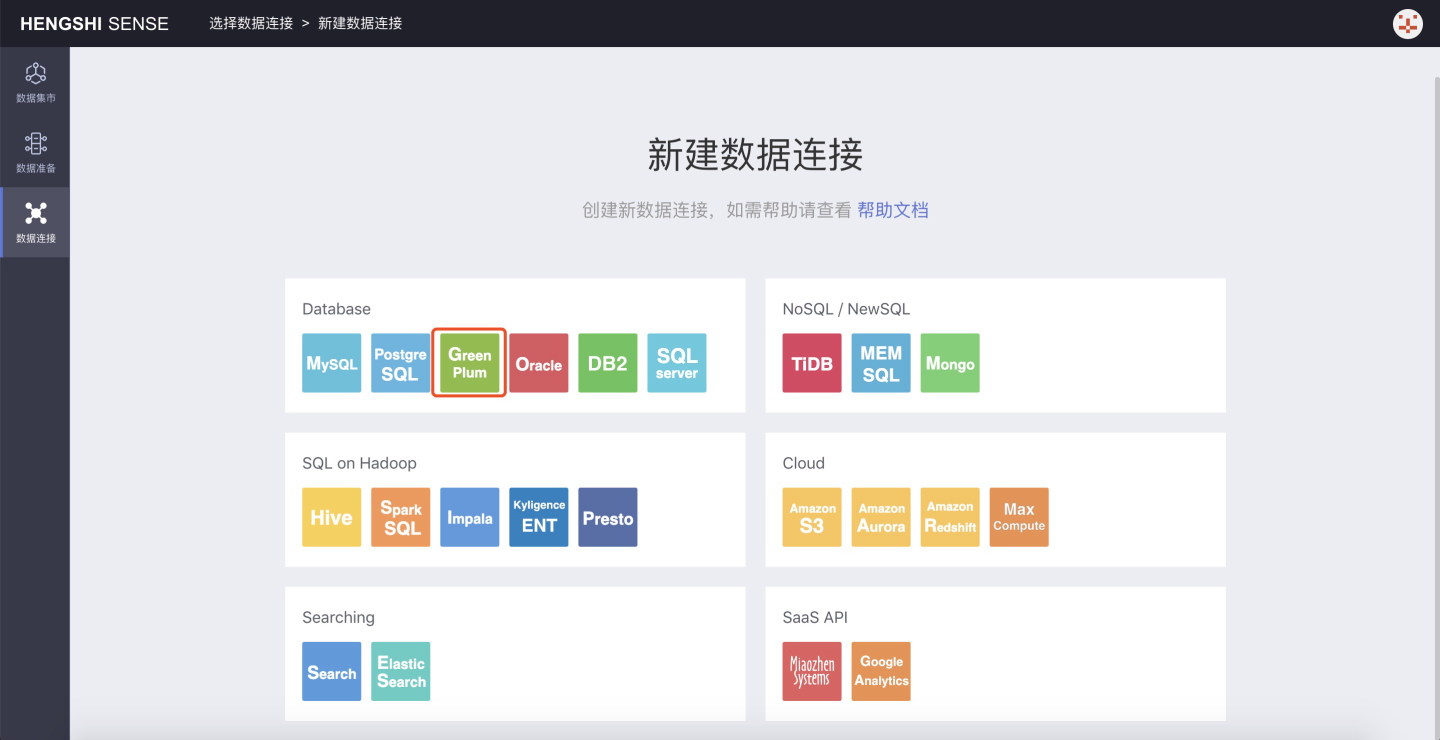
Click to select this connection, and open the configuration page for the connection:
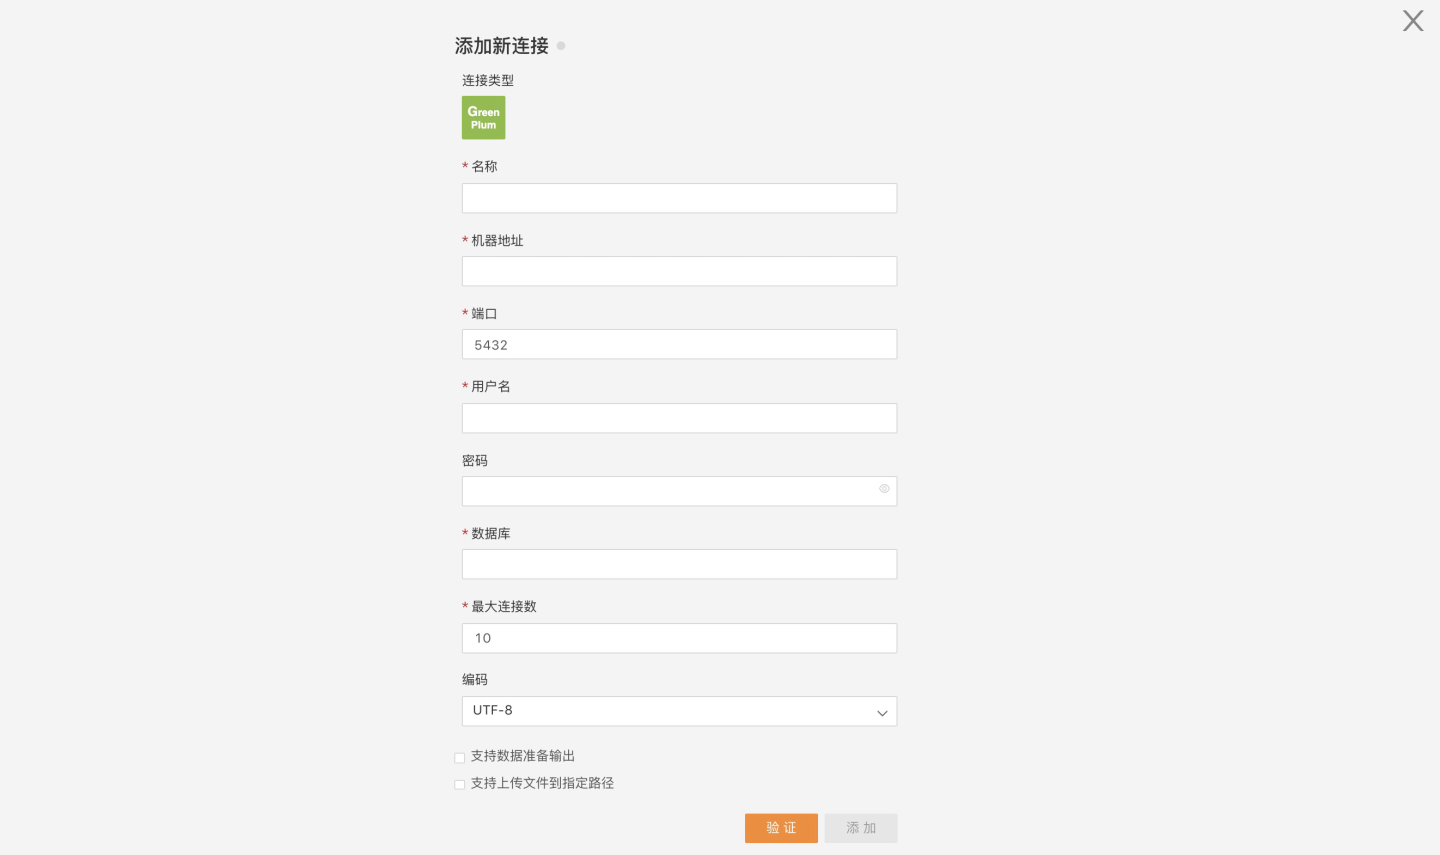
On this page, enter the connection information as required, click Verify, and the Add button will turn green and become clickable upon successful verification:
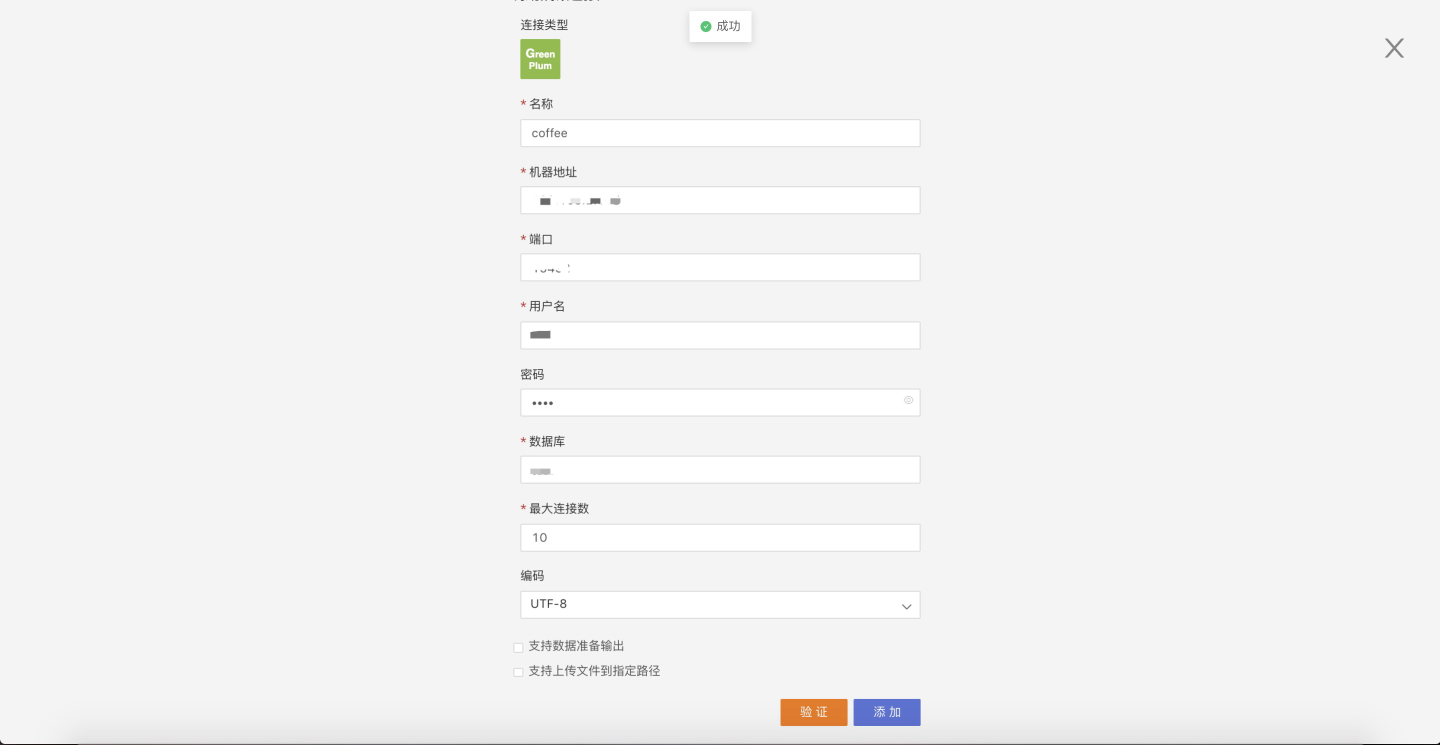
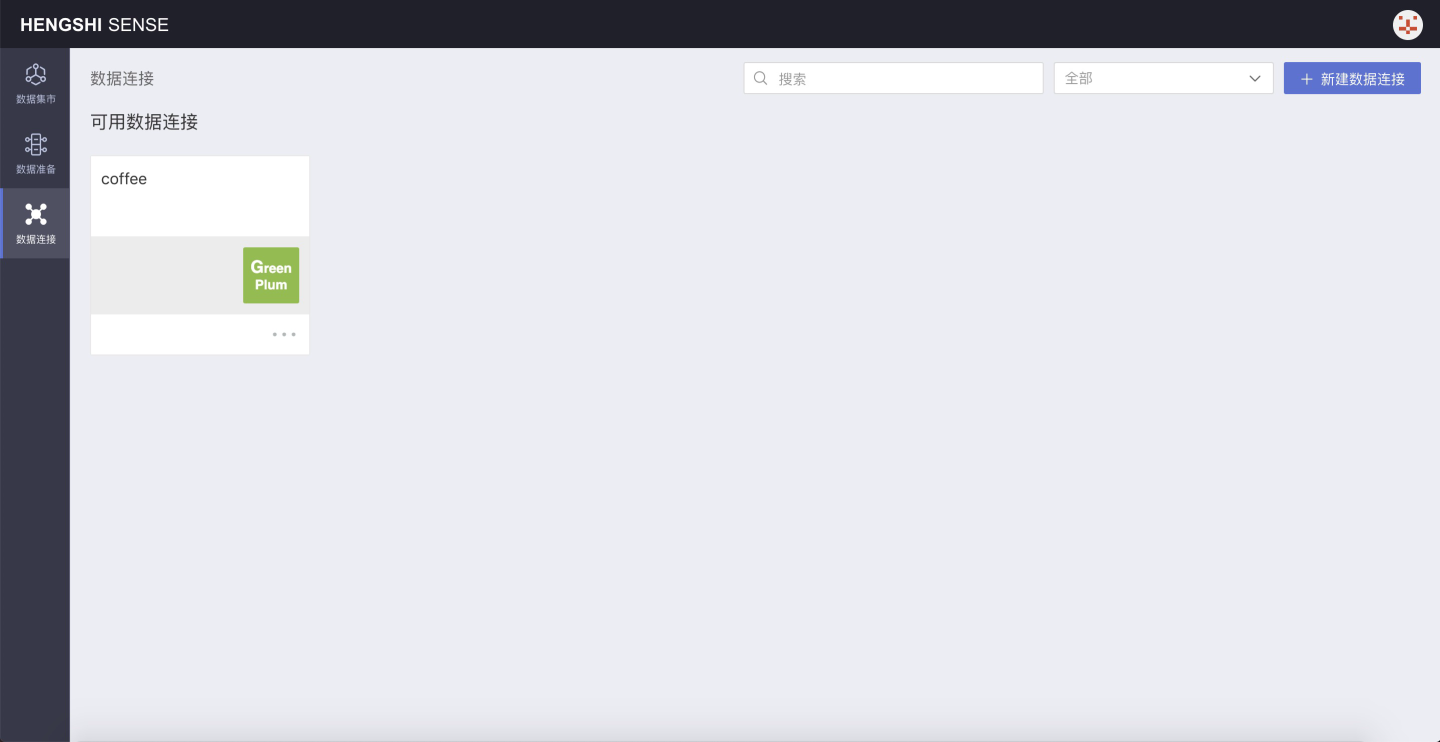
Click Add, and the data connection is successfully created:
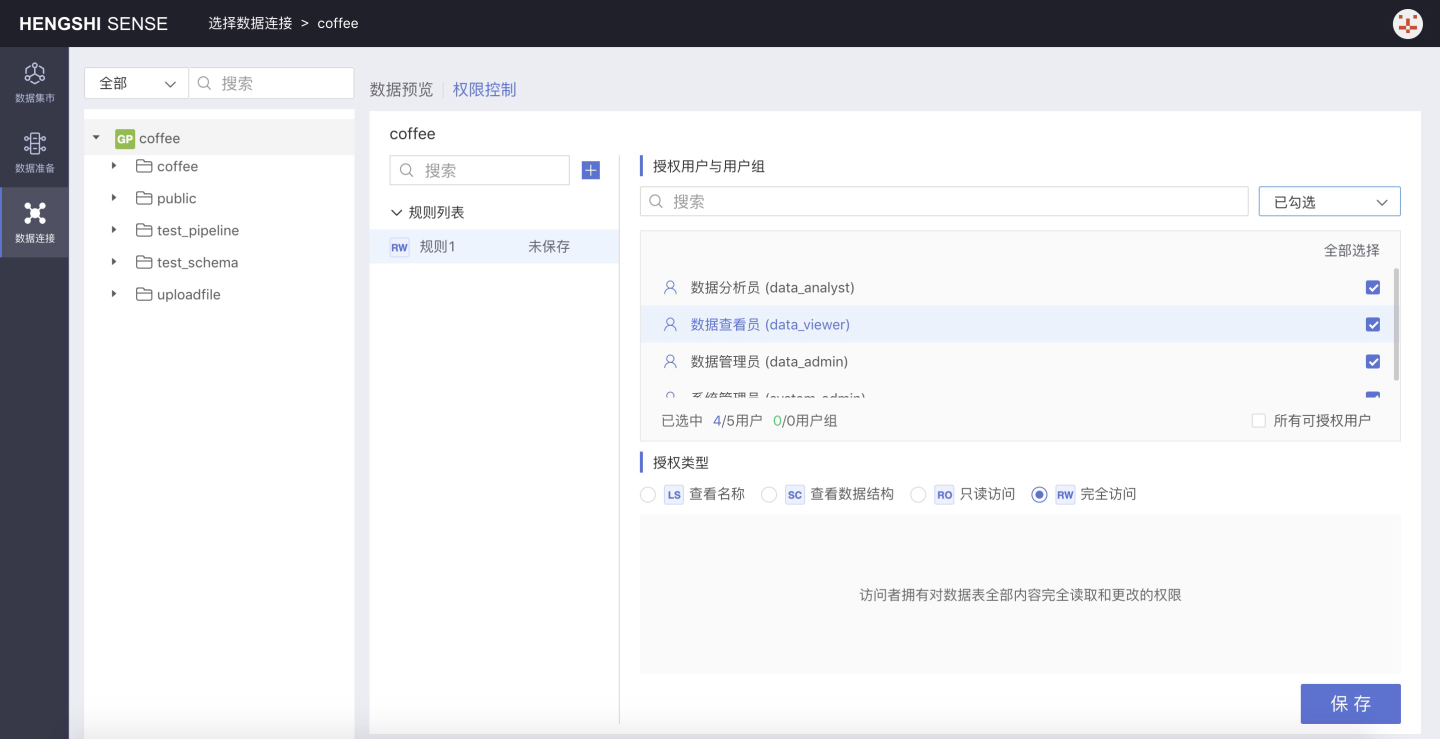
Set connection permissions, see Connection Permissions for specific operations.
3: Data Integration
Version Information: In version 3.0, the content of the input node has been enhanced, adding the ability to use datasets from the Dataset Market as input nodes. Other configurations remain unchanged.
Data integration provides ETL (Extract-Transform-Load) functionality, extracting data from different sources, performing filtering, format conversion, adding calculated columns, joining, merging, aggregating, and other transformations, and then outputting it to the user-specified data source for subsequent exploration and analysis. In version 3.0, the data modeling results from applications can be output to different databases through data integration, establishing a complete data processing pipeline. Data integration sources support incremental updates, enhancing the timeliness of data updates for analysis.
Accounts with the Data Management role can view and build the data integration module. Below is an example of logging in as a user: Data Administrator (data_admin);
Click Data Integration from the left navigation bar to open the data integration display page:
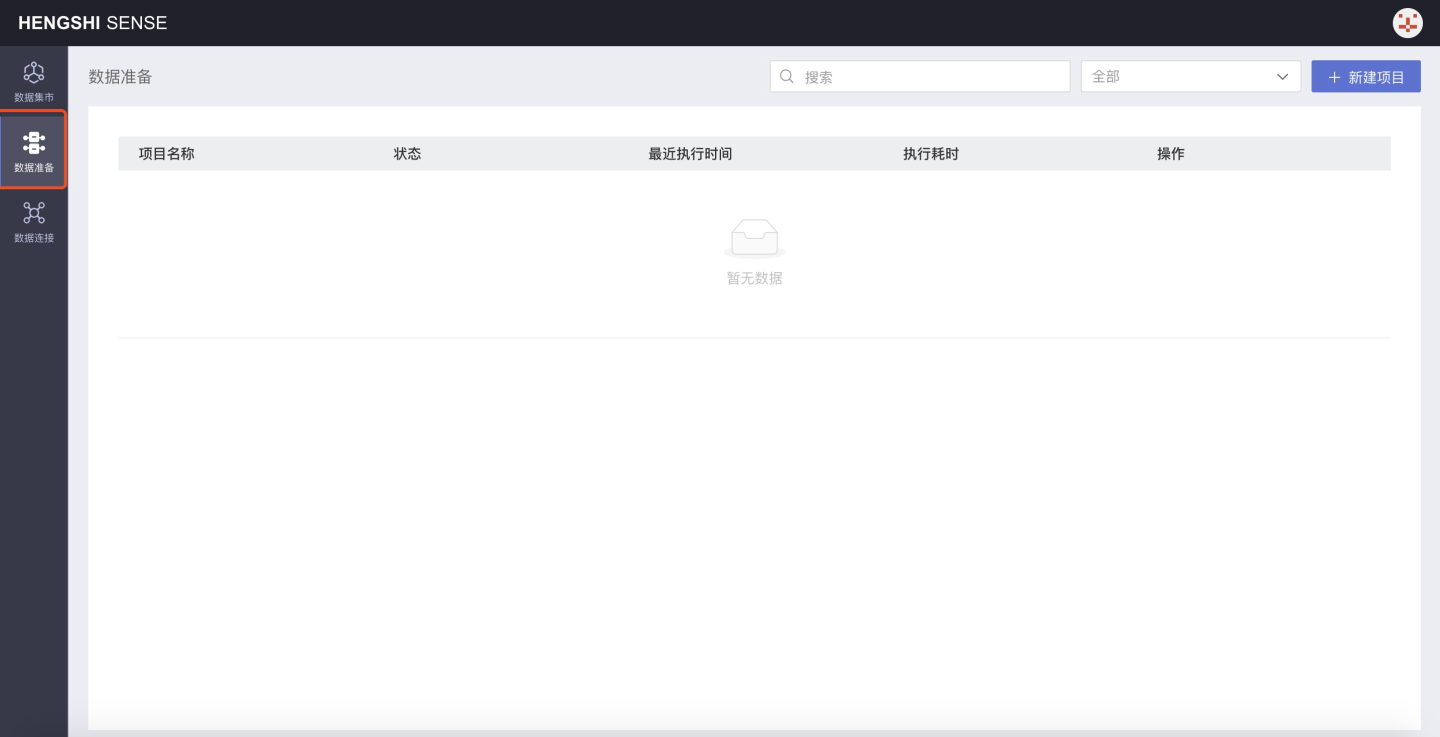
New Project
From the top right corner's New Project, you can create a new data integration project, as shown below:
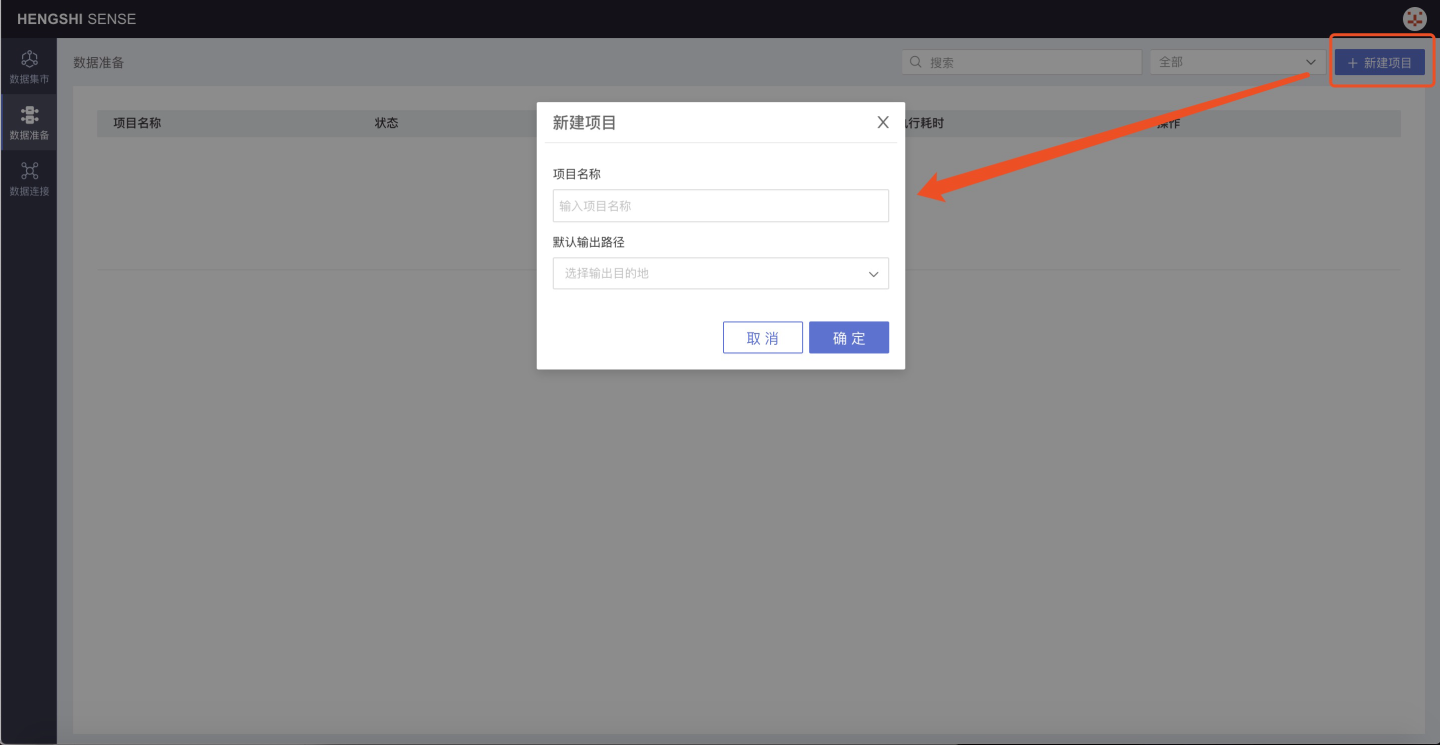
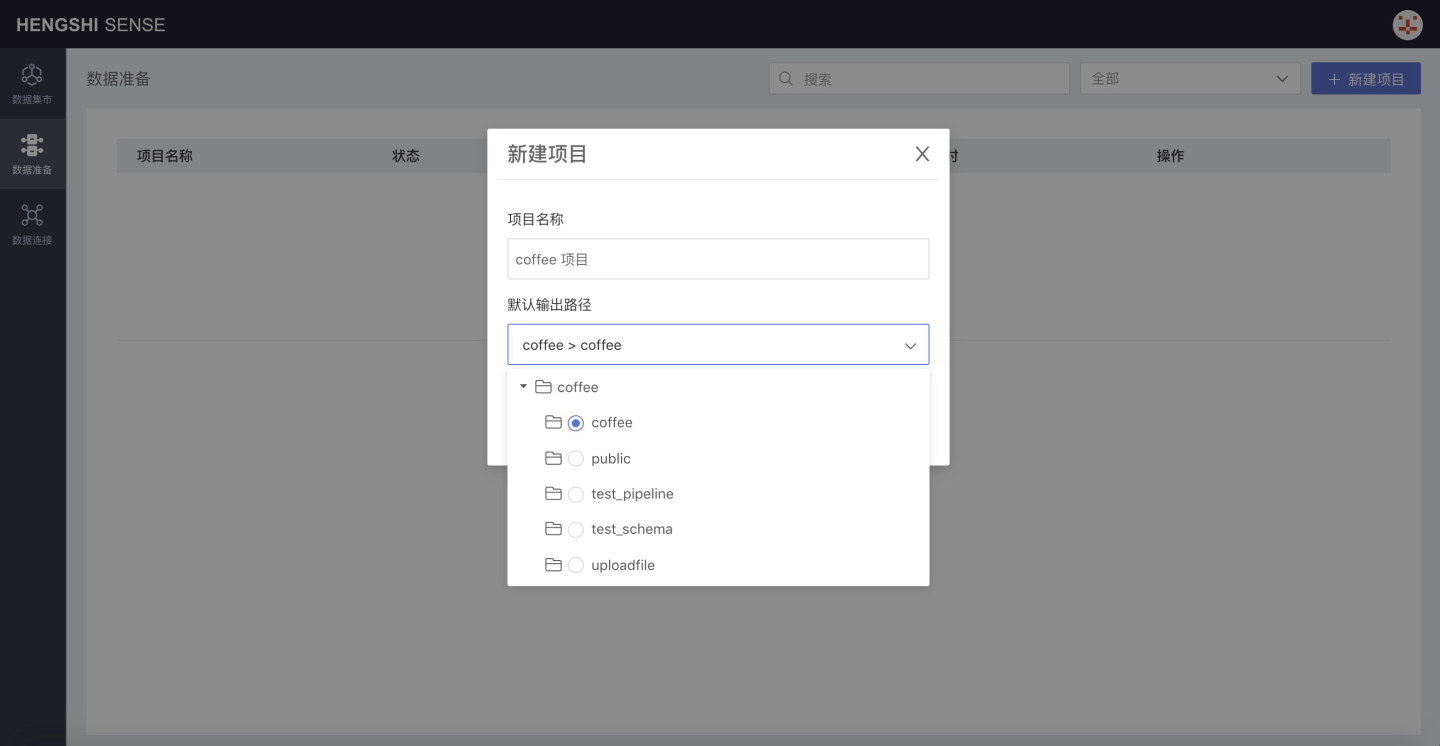
Enter the project name in the pop-up window and specify the database as the default output path in the optional data connections in the default output path dropdown.
Note:
- Currently, only Greenplum, PostgreSQL, and Amazon Redshift are supported as output paths for data sources;
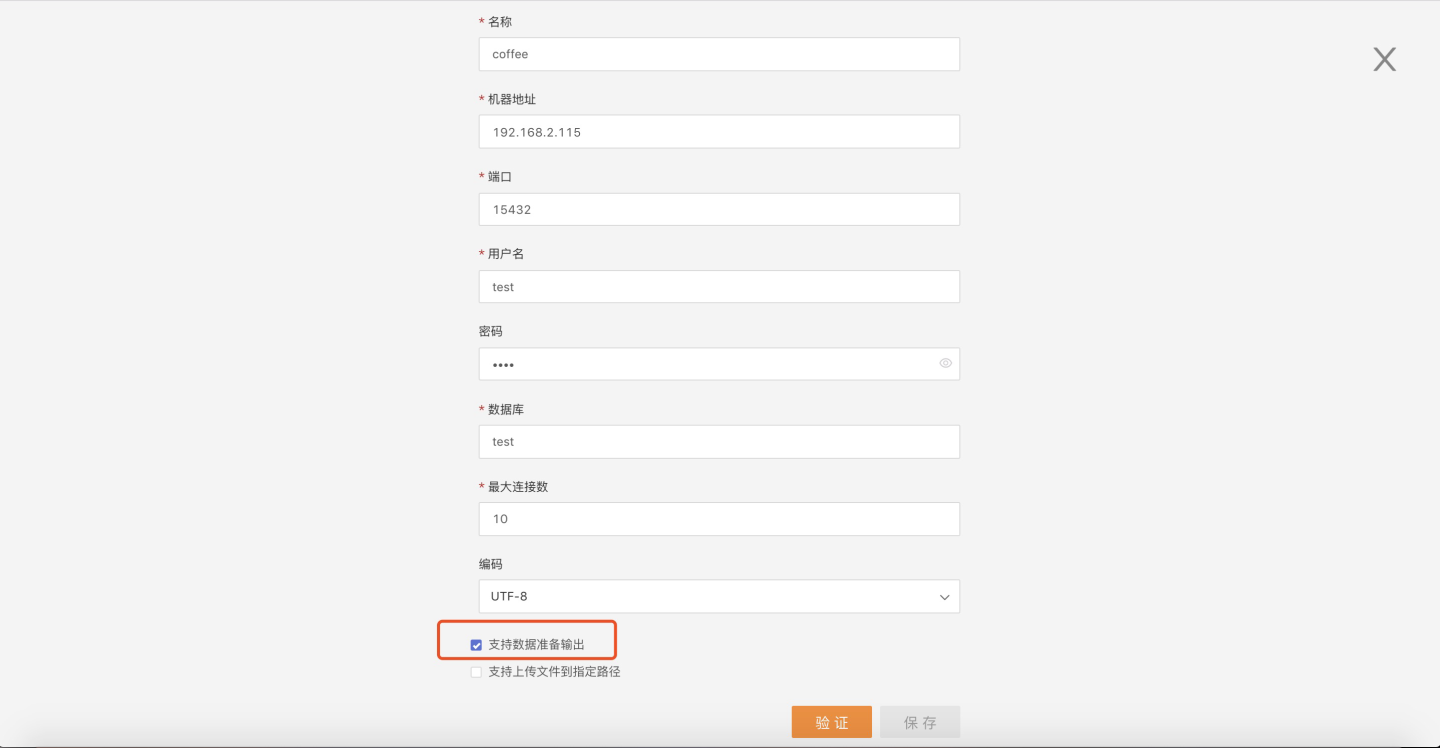
- As an optional connection for data integration output paths, the owner must select the Support Data Integration Output option when creating the connection: Greenplum, PostgreSQL, Amazon Redshift.
Take the newly created connection coffee as an example, edit the connection, check Support Data Integration Output, verify and save:
Project Operations
Step 1: Add Input Node
After creating a new project, it will open by default. In the top-right corner of the interface, there is a dropdown box for Add Input Node. In this dropdown, select the type of input node to add, which includes: Local File, Dataset Market, Data Connection:
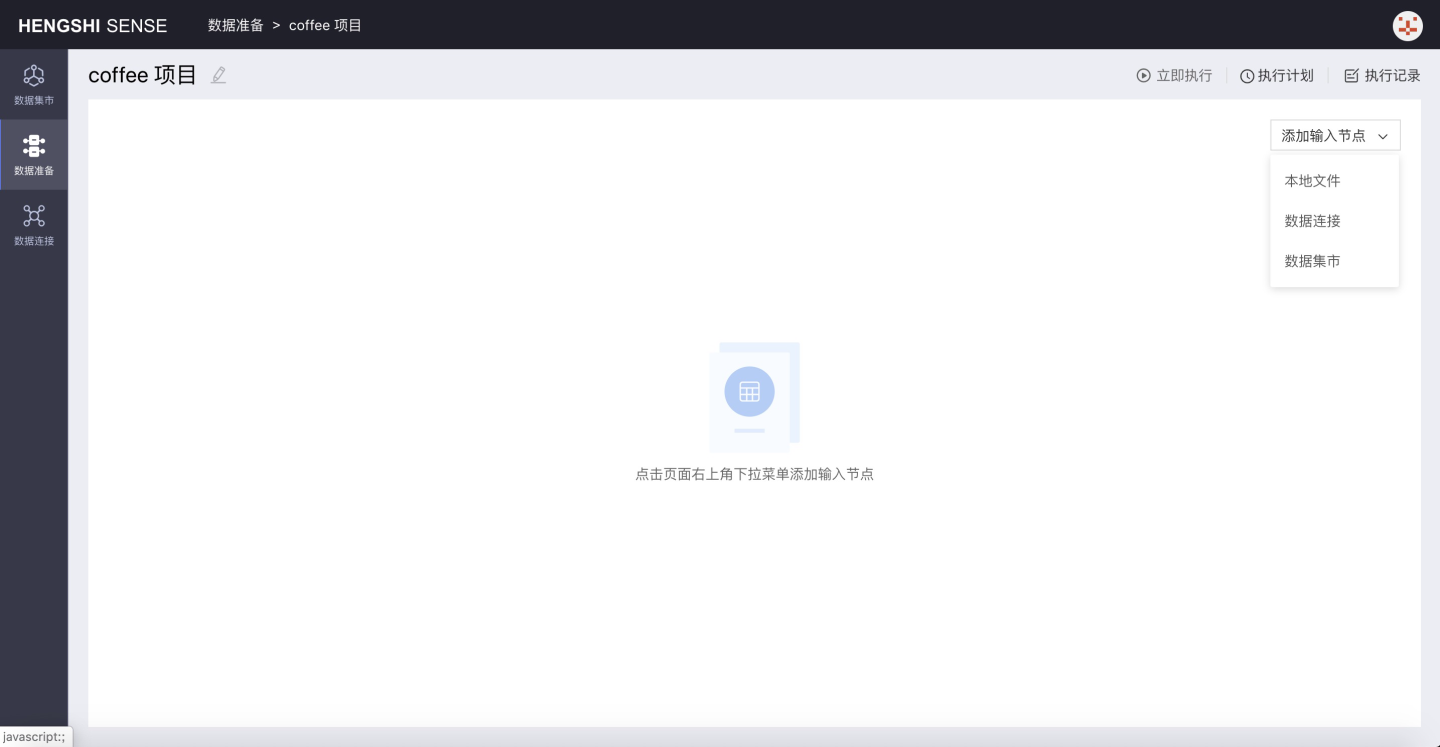
Local Files When adding a local file input node, support for Excel and CSV is provided.
Dataset Market When adding a dataset market input node, you can select any dataset from the dataset packages in the dataset market.
Data Connections When adding a table from a data connection as an input node, it is divided into built-in data connections and user data connections.
Restrictions when using a user data connection to add an input node:
- If the current account has view name permission for a specific database in the selected data connection, none of the tables under that database can be added as input nodes to the data integration project;
- If the current account has view name permission for a specific table in the selected data connection, that table cannot be added as an input node;
Below is an example of adding a dataset input node:
Click on Add Input Node and select Dataset Market from the options, which will bring up a list of items in the Dataset Market:
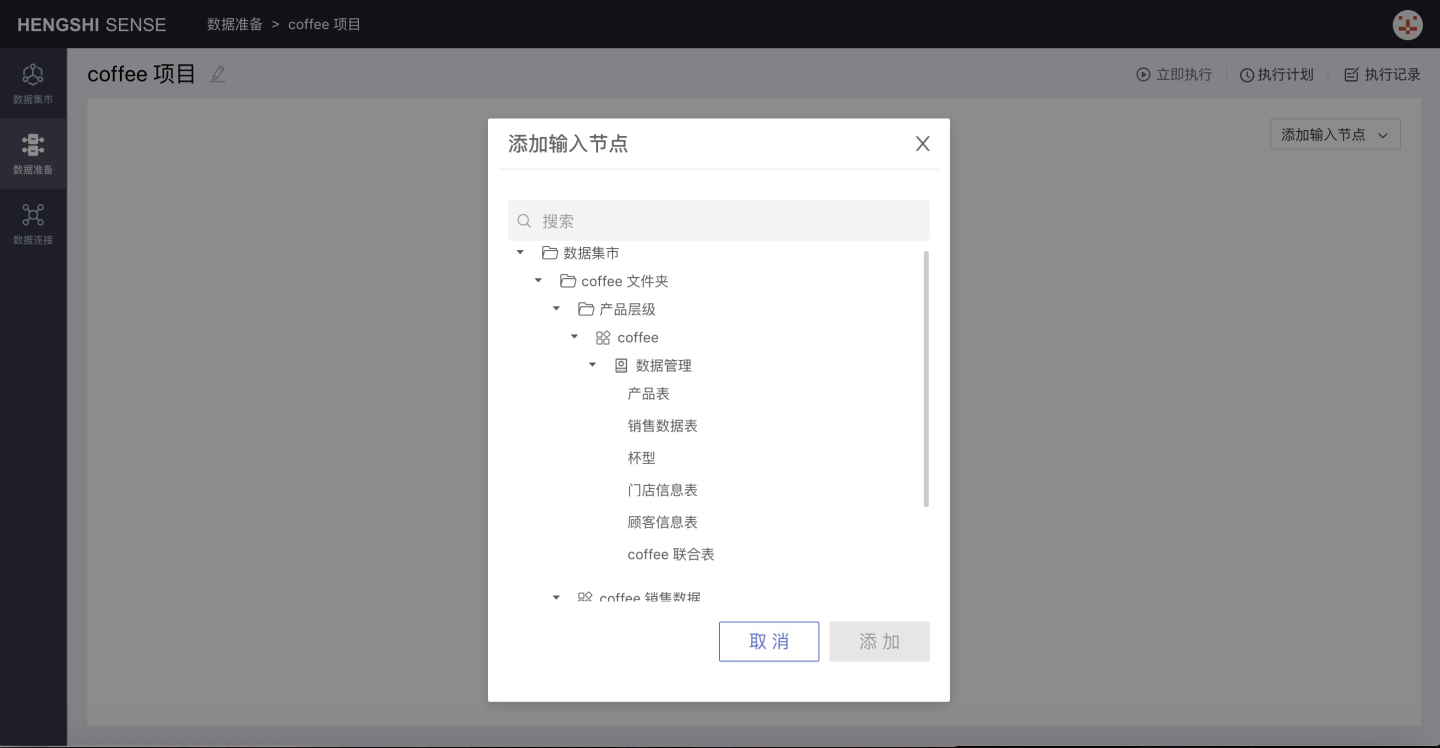
Select Sales Dataset:
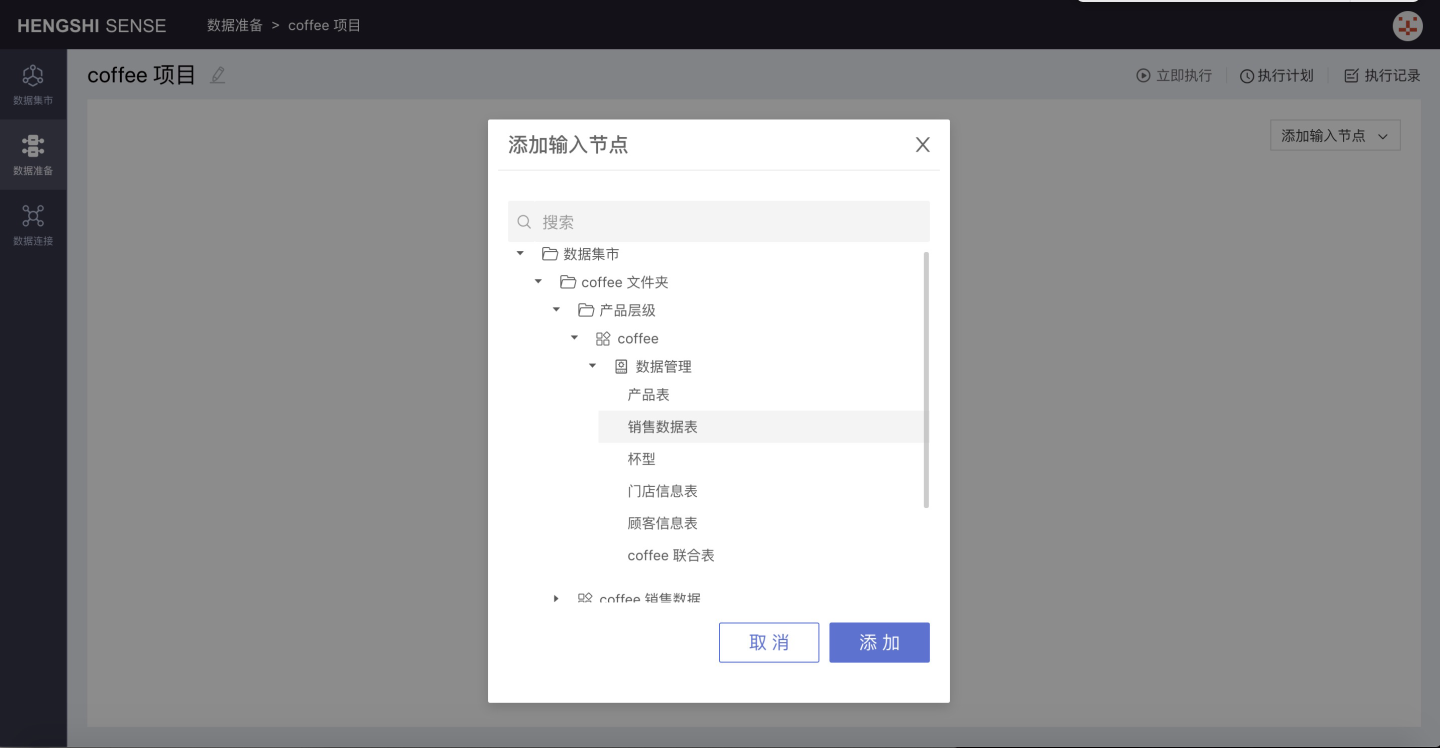
Click Confirm, the input node is added successfully.
Step 2: Set Up Input Node Information
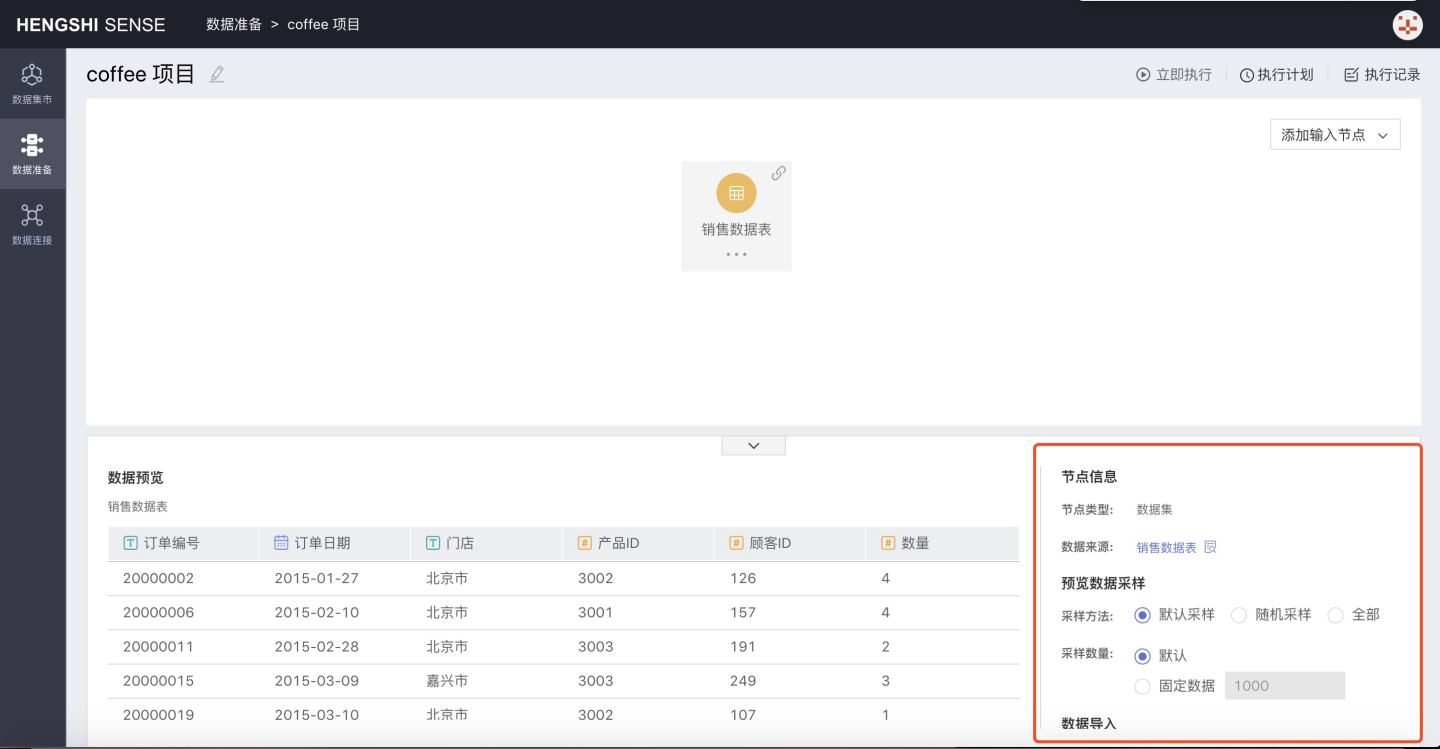
- Node Information
- Node Type: Indicates the input type of the node, corresponding to the three ways to add input nodes
- Data Source: Click the search button after the data source to directly open the dataset in the dataset market
- Data Sampling Preview
- Default Sampling Samples data sequentially based on its storage location in the database; Default: When "Default" is selected, the first 1000 rows of data stored in the database are sampled;
- Random Sampling Ignores the storage location in the database and randomly samples the specified number; Sampling quantity is divided into Default and Fixed Data:
- Default: When "Default" is selected, 1000 rows of data are randomly sampled;
- Fixed Data: When "Fixed Data" is selected, X rows are randomly sampled from the database based on the number X entered in the input box;
- All When the sampling method is set to "All", all data in the database is sampled, and the sampling quantity cannot be manually set;
- Data Import
- Full Import
- Incremental Import
The sample size is only for viewing the data of the input node in the data integration. The number of samples does not affect the data generated in the output node after the project is executed. The data in the output node is full data.
Step 3: Add Output Node
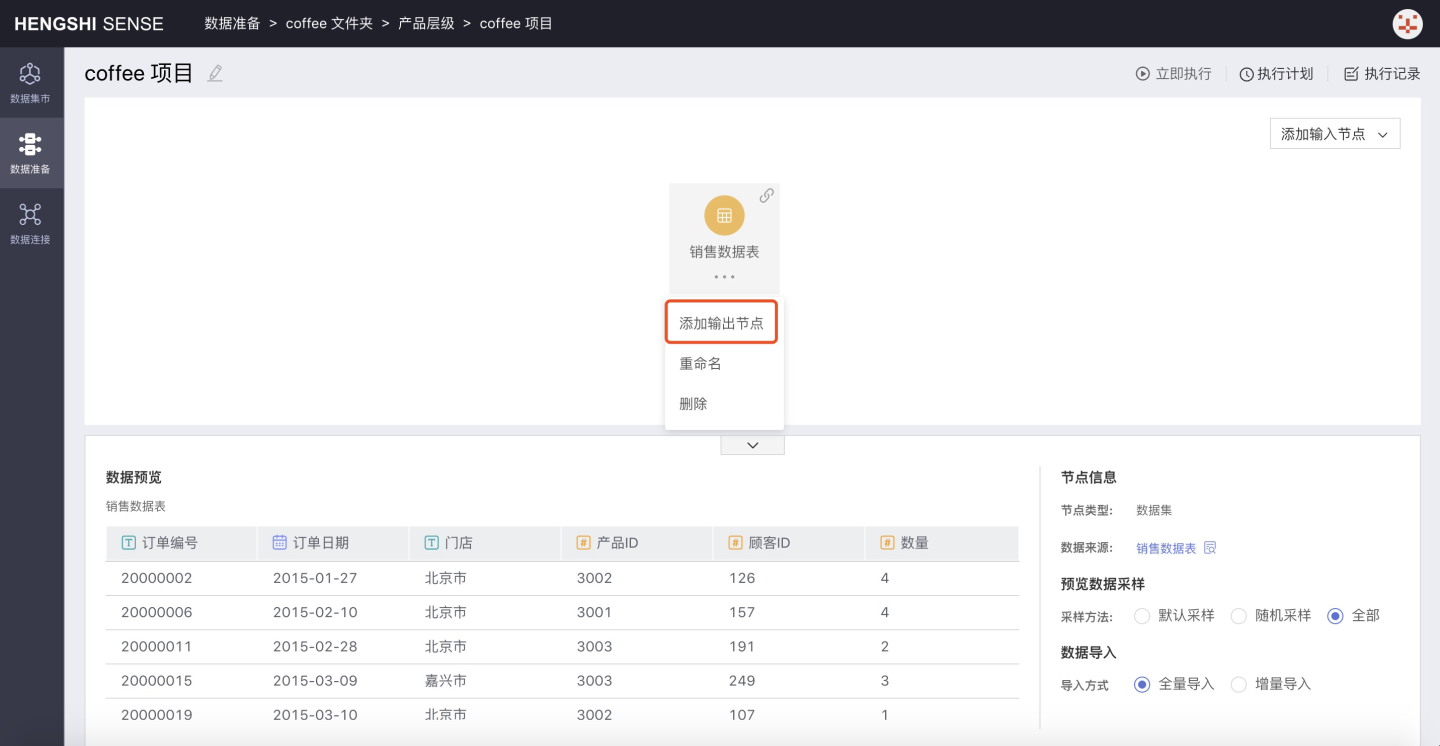
Select the input node to which you want to add an output node, click the three-dot menu of the node, choose Add Output Node, and the new output node is successfully added;
Step 4: Set Output Node Information

Output Destination Can be modified, defaults to the destination selected when creating a new project, and can be changed to another path by expanding the dropdown box;
Table Name Setting Can be modified, the table name generated by the input node after project execution in the database, defaults to Output Node;
Renaming Strategy There are two scenarios for the table name setting of the output node:
The selected database for the output node already contains a table with the same name as the specified output table (modifying an existing table in the database when executing the project);
The selected database for the output node does not contain a table with the same name as the specified output table (creating a new table in the database when executing the project);
For the first scenario, when the table name of the output node conflicts with an existing table in the selected output path, the existing table in the database needs to be modified, and the user needs to choose a renaming solution. The system currently provides four renaming solutions:
Match and Overwrite Default option, only when the table structure (field names and field types) of the input node is exactly the same as the existing table with the same name, selecting this option allows the project to overwrite the existing table with the same name when executed, and the project execution is successful, otherwise the project execution fails;
Match and Append Only when the table structure of the input node is exactly the same as the existing table with the same name, selecting this option allows the project to append to the existing table with the same name when executed, and the project execution is successful, otherwise the project execution fails;
Force Overwrite Forcefully overwrites the existing table with the same name without checking, selecting this option allows the project to execute successfully;
Force Append Forcefully appends to the existing table with the same name, and when the table structure is not the same, it appends with misalignment, filling empty positions with null, and the project execution is successful.
Step 5: Project Execution
You can execute the current project, set the project's execution schedule, and view the execution records in the upper right corner.
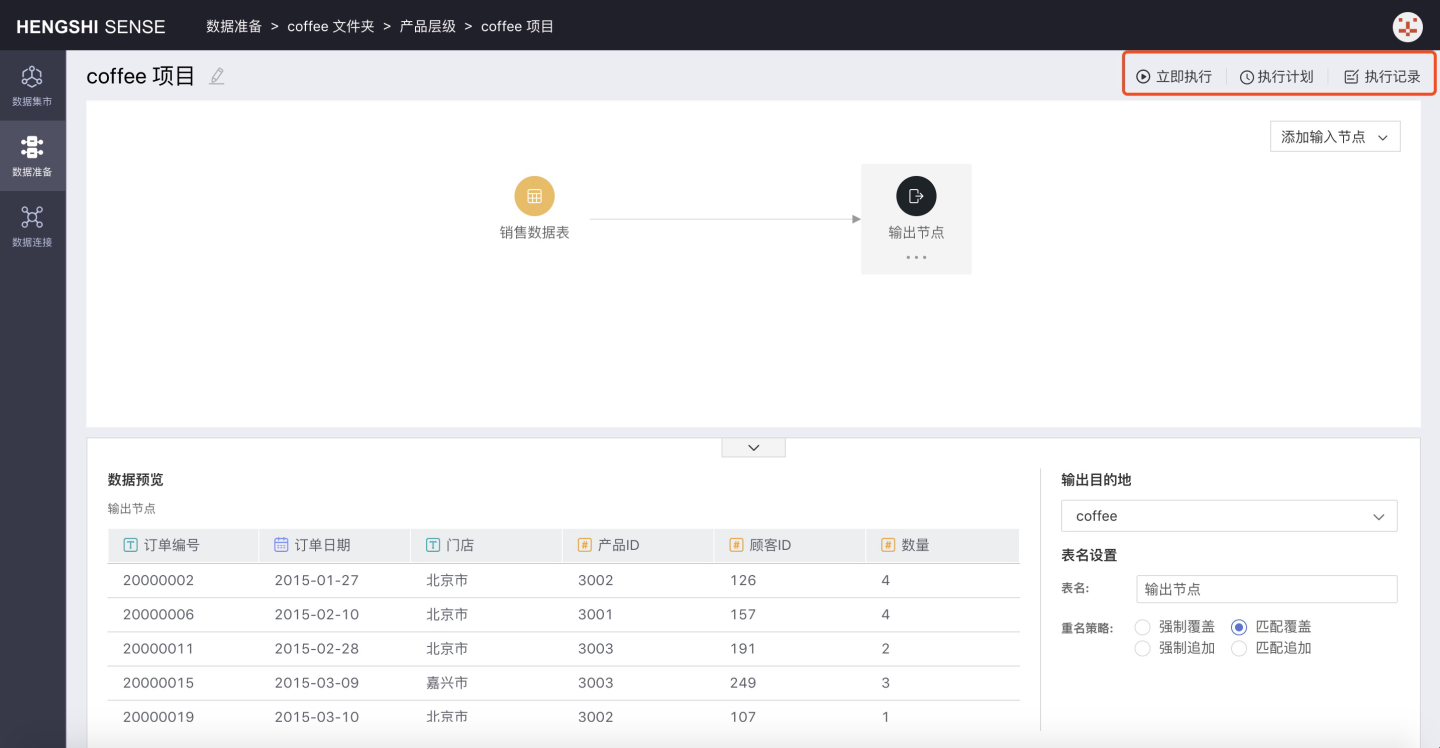
- Execution Click
Executeto immediately execute the project. - Execution Plan
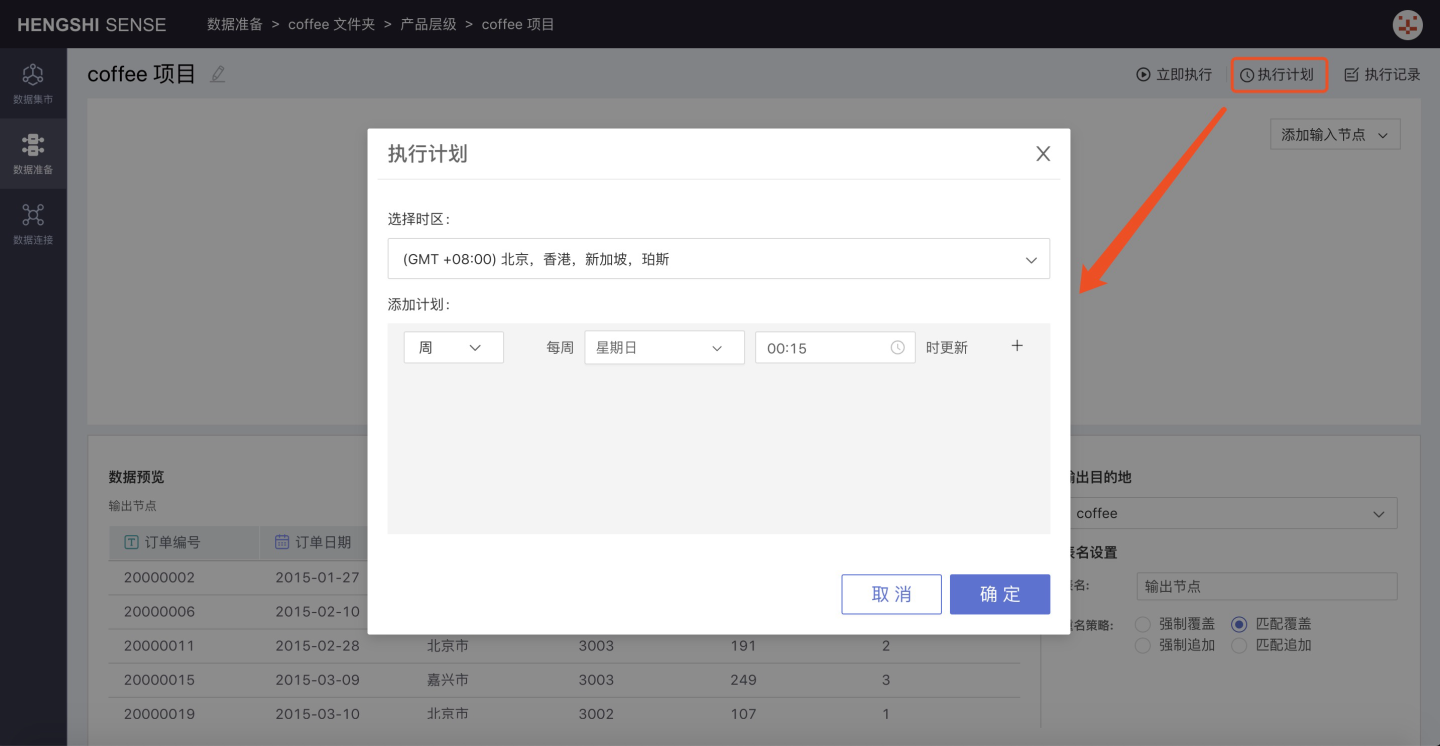
- Select Time Zone
- Add Schedule
- Hour: Can set the minute of each hour to update
- Day: Can set the specific time of day to update
- Week: Can set the specific time of day for each day of the week to update, multiple selections allowed
- Month: Can set the specific time of day for each day of the month to update, multiple selections allowed
- Custom: Can set the update time points by yourself
- Execution Records Click on Execution Records to jump to the execution record list page of the project:
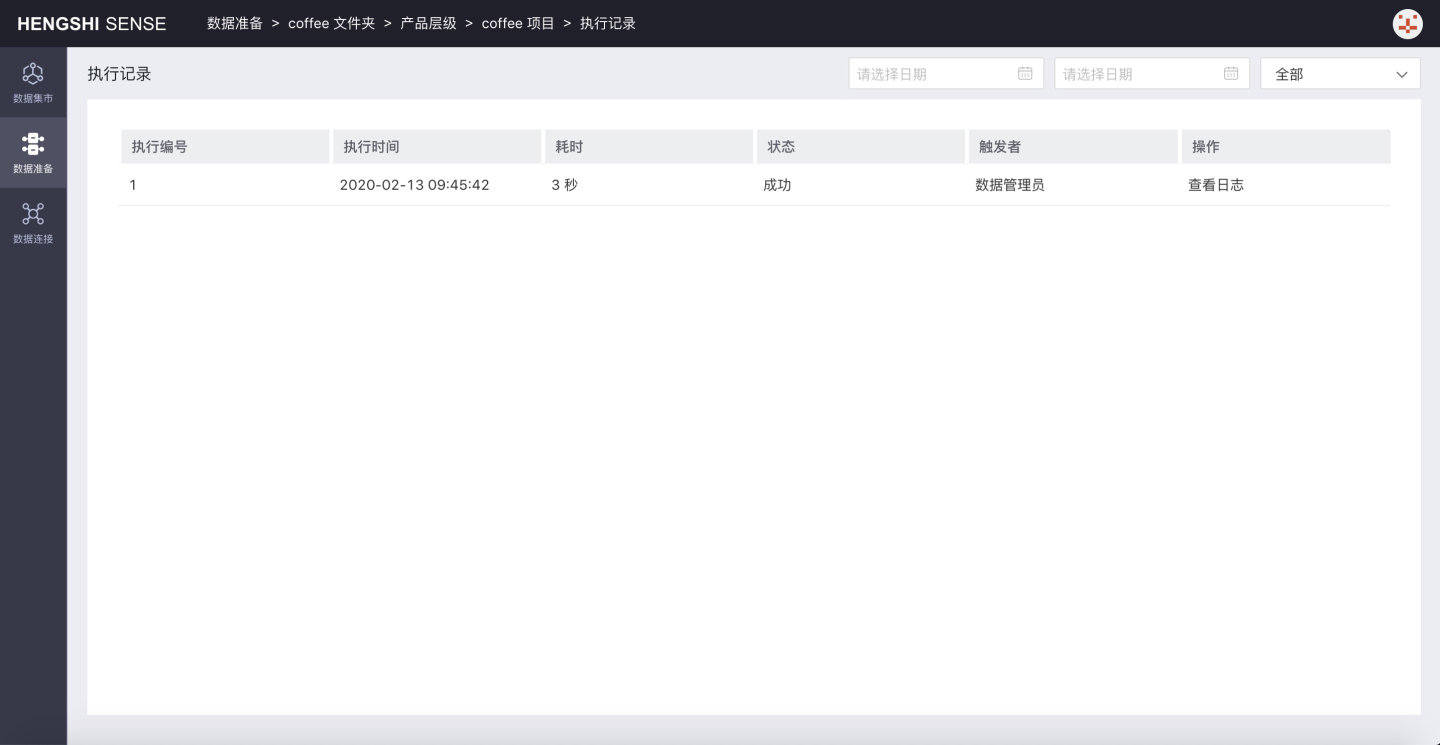
At this point, the setup for a data integration project is complete.
IV: Data Mart Construction
Version Information: New content added in version 3.0.
The Dataset Market feature has been added in version 3.0, providing centralized management of the dataset market. The dataset market supports the establishment of hierarchical dataset markets, authorizing data by user, user group, and organizational structure, ensuring that data is allocated to the right people. It supports unified management of calculated fields and calculated indicators, enabling consistent statistical logic for key KPIs across the enterprise, ensuring uniform algorithms across departments, and eliminating data inconsistencies. Comprehensive data permission settings support various permission models for data connection permissions and row permissions, meeting different permission management scenarios.
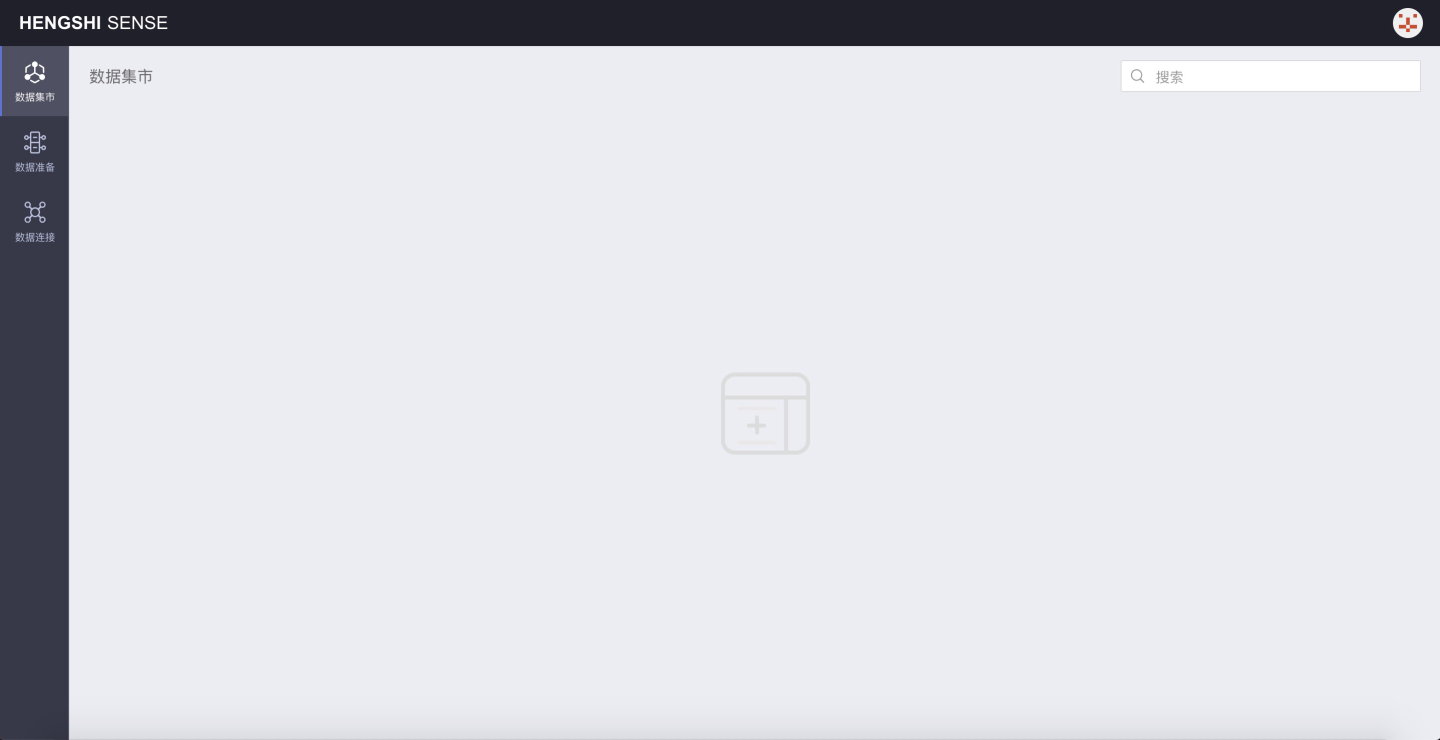
For data security considerations: The restrictions on dataset operations for user roles are shown in the figure below
| User Role | Dataset Market Visibility | Create Folder in Dataset Market | Create Dataset in Dataset Market Folder |
|---|---|---|---|
| System Admin | Invisible | ----- | ----- |
| Data Admin | Visible | Cannot Create | ----- |
| Data Analyst | Invisible | ----- | ----- |
| Data Viewer | Invisible | ----- | ----- |
| System Admin + Data Admin | Visible | Can Create | Can Create Any Dataset |
| System Admin + Data Analyst | Invisible | ----- | ----- |
| System Admin + Data Viewer | Invisible | ----- | ----- |
| Data Admin + Data Analyst | Visible | Cannot Create | ----- |
| Data Admin + Data Viewer | Visible | Cannot Create | ----- |
| Data Analyst + Data Viewer | Invisible | ----- | ----- |
| System Admin + Data Admin + Data Analyst | Visible | Can Create | Can Create Any Dataset |
| System Admin + Data Admin + Data Viewer | Visible | Can Create | Can Create Any Dataset |
| System Admin + Data Analyst + Data Viewer | Invisible | ----- | ----- |
| Data Admin + Data Analyst + Data Viewer | Visible | Cannot Create | ----- |
| System Admin + Data Admin + Data Analyst + Data Viewer | Visible | Can Create | Can Create Any Dataset |
From the above table, it can be concluded that:
- With the Data Management + System Management role, after logging into the system, you can build the directory structure of the data mart.
- With the Data Management role, after logging into the system, you can view the folders already created in the data mart, and build the directory structure of the folder, and perform data processing within the created folder.
Data Management + System Management Role User Login
Create Folder and Dataset
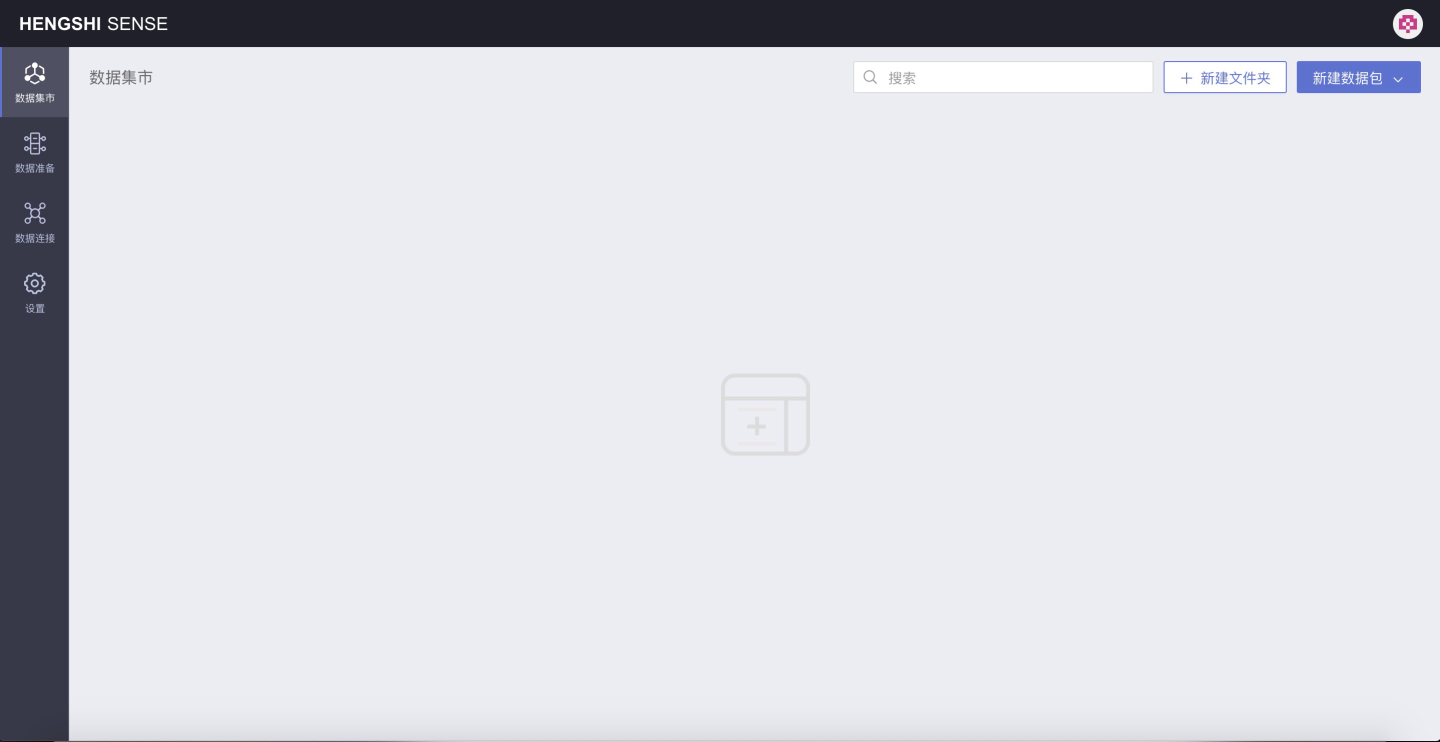
As shown in the image above, you can directly create folders and data packages on the homepage of the dataset market.
Create a new folder coffee folder and a new dataset coffee dataset:
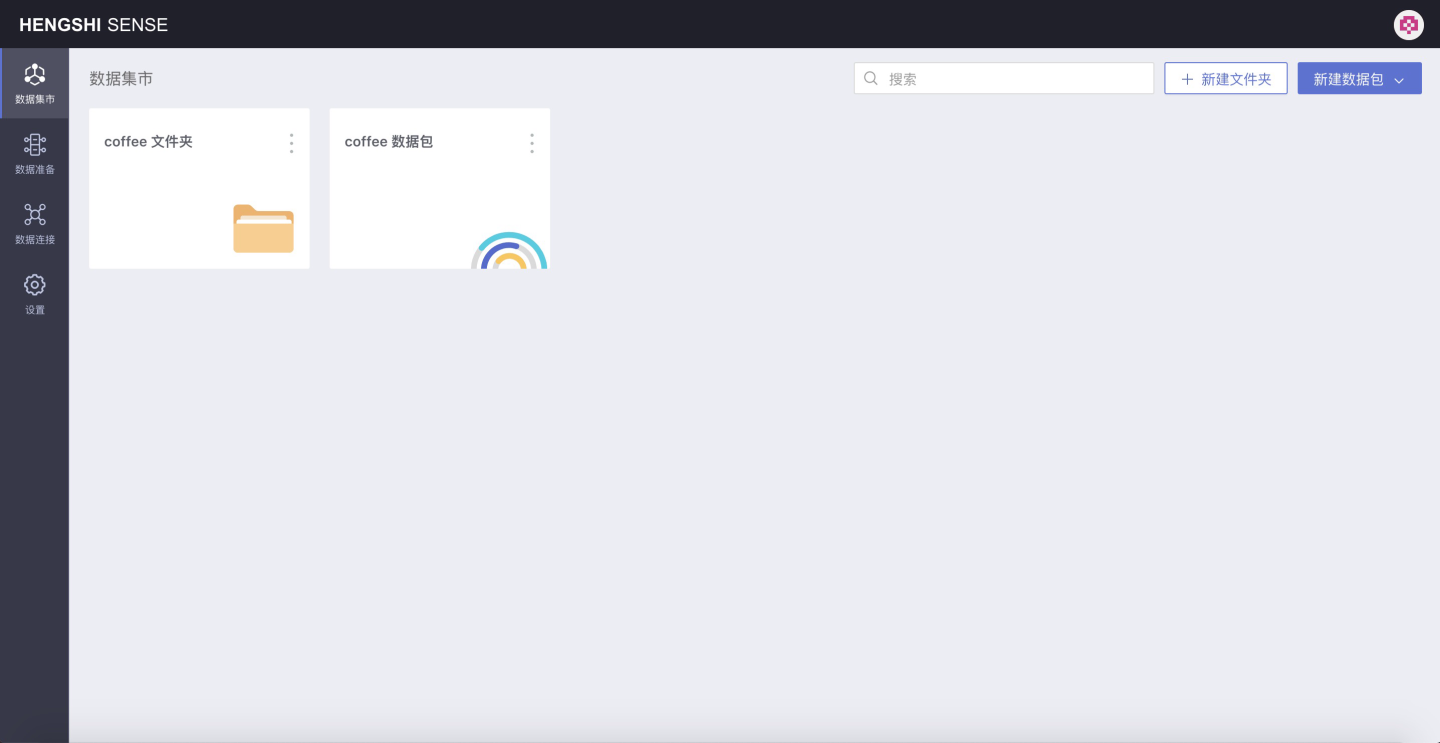
In the image above: The first one identified by the folder icon is the newly created folder; the second one identified by the ripple pattern is the newly created dataset.
Folder, Data Package Access Permissions Settings
Select a folder or data package, taking the coffee folder as an example:
Click the three-dot menu on the folder
The folder operation buttons pop up as shown below:
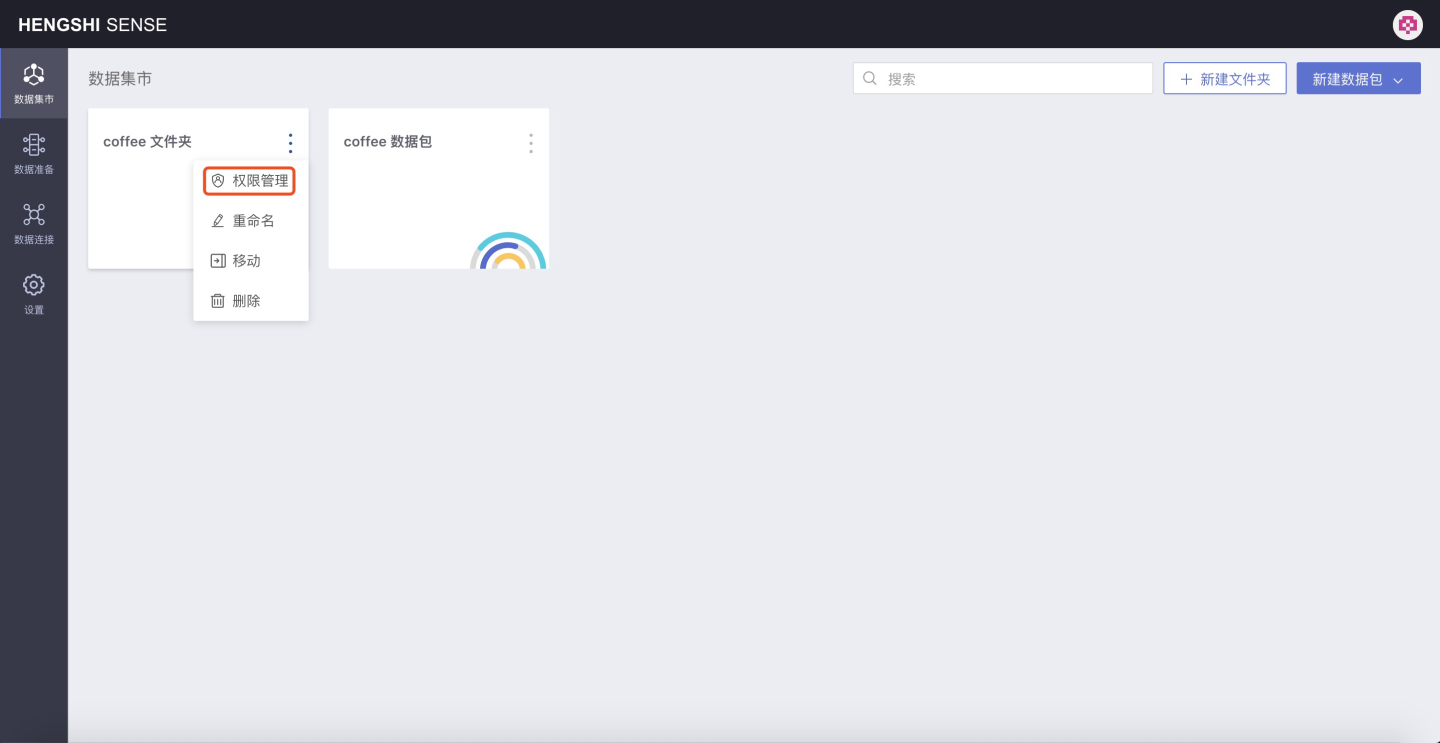
Click on Privilege Management
The privilege management page for the folder opens:
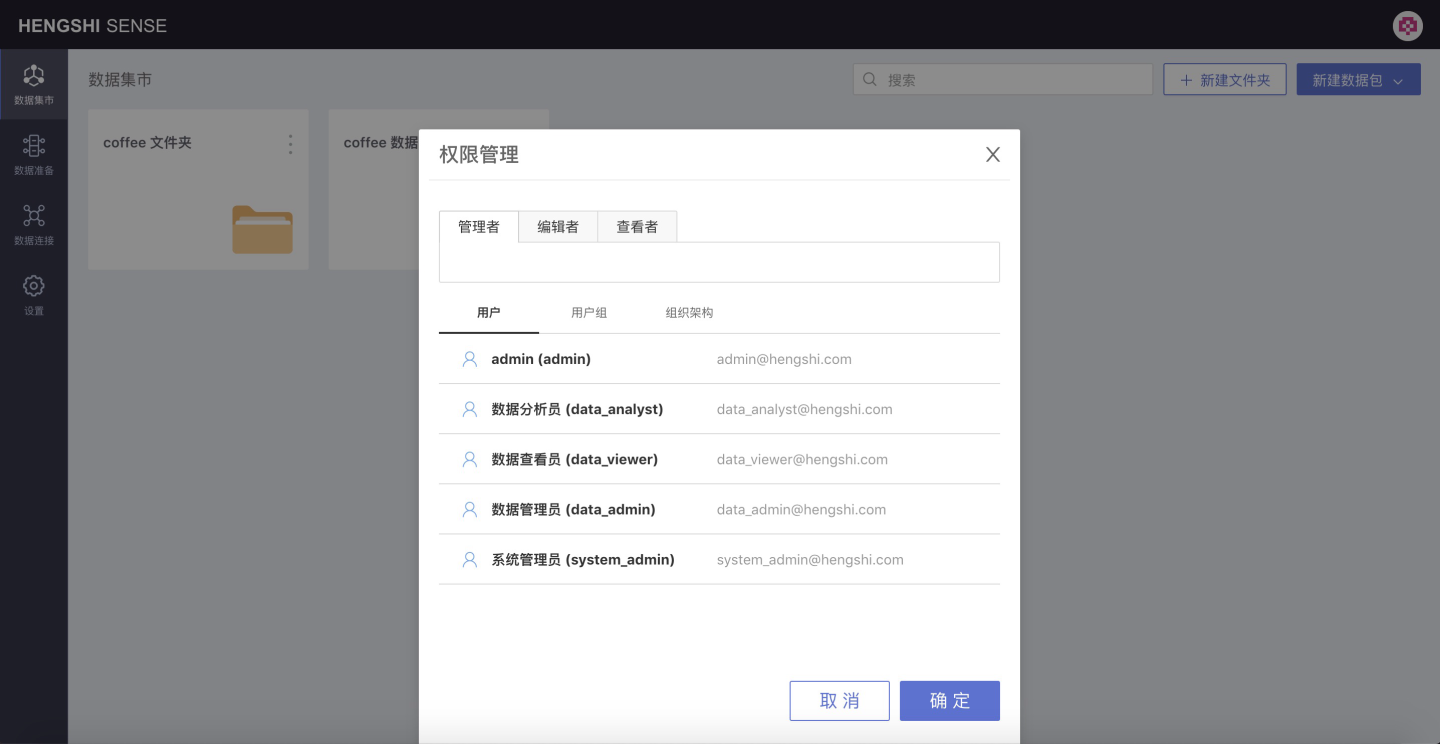
- Manager: Can edit, view, and use the folders, data packages, and datasets under it, and can modify the privilege management of the folder/data package.
- Editor: Can edit, view, and use the folders, data packages, and datasets under it.
- Viewer: Can view and use the folders, data packages, and datasets under it.
Set permissions for the users created above:
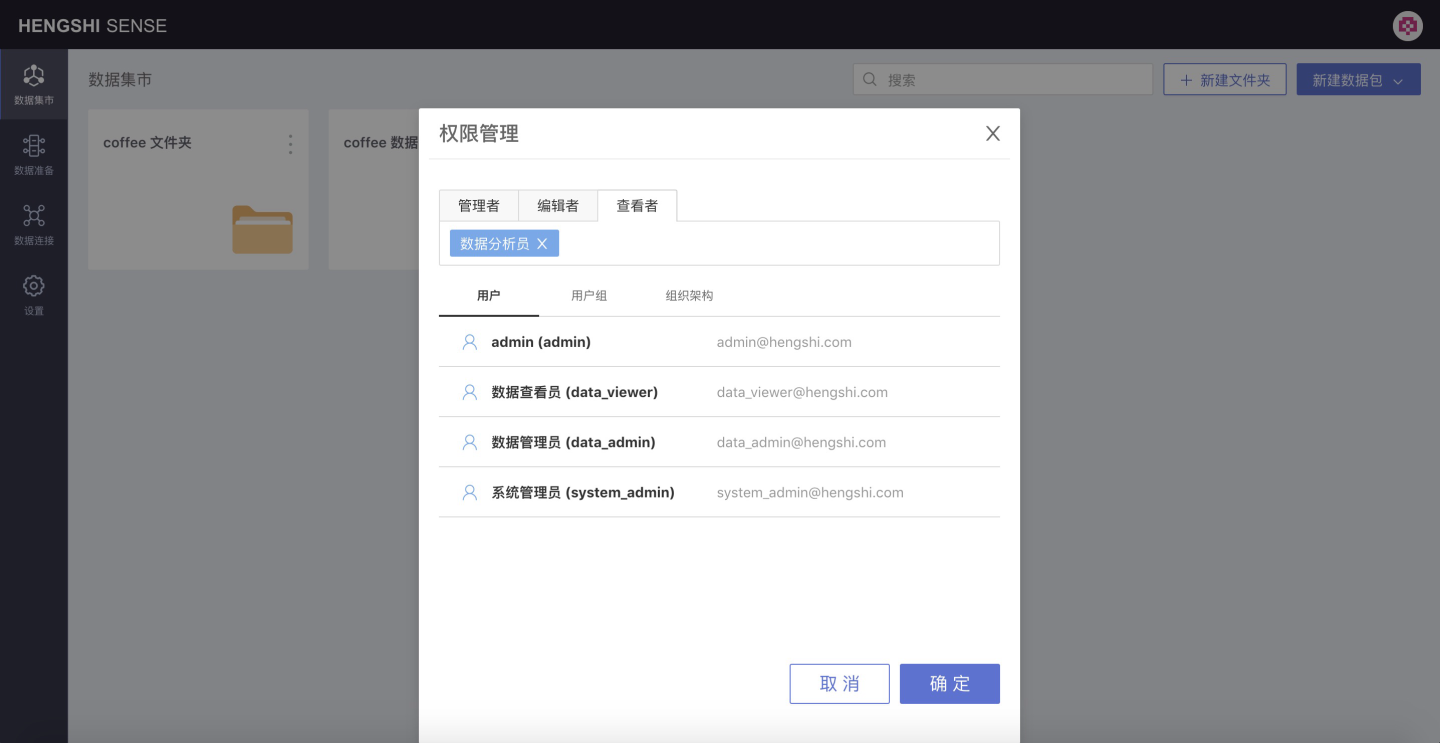
As shown in the figure above, after selecting the user, click the OK button to successfully set the privilege management. The users and corresponding permissions are as follows:
Permission User Manager System Administrator (system_admin) Editor Data Administrator (data_admin) Viewer Data Analyst (data_analyst)
Open the coffee folder:
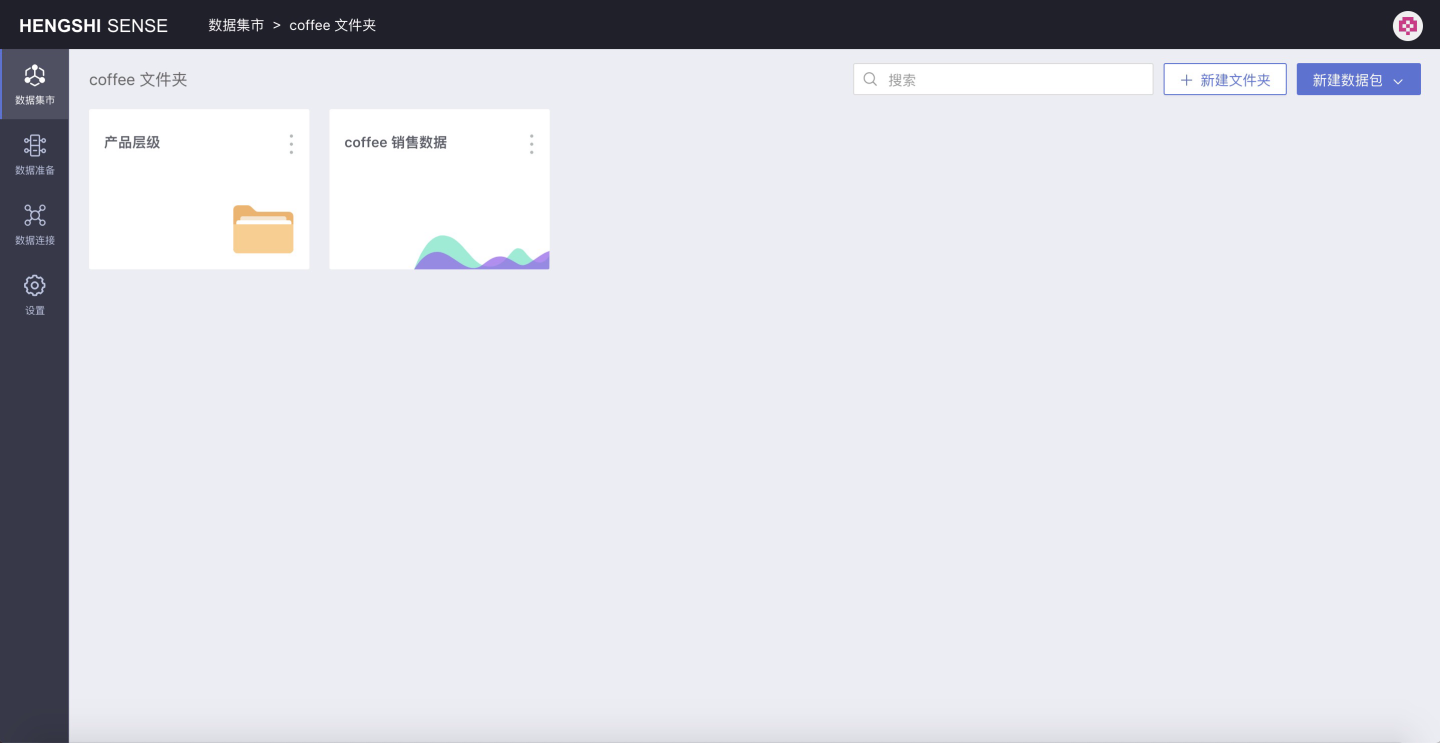
In the folder, you can continue to create folders or datasets according to the required hierarchical structure, as shown in the figure above, create a new folder Product Hierarchy, and create a new dataset coffee sales data.
Open Dataset:
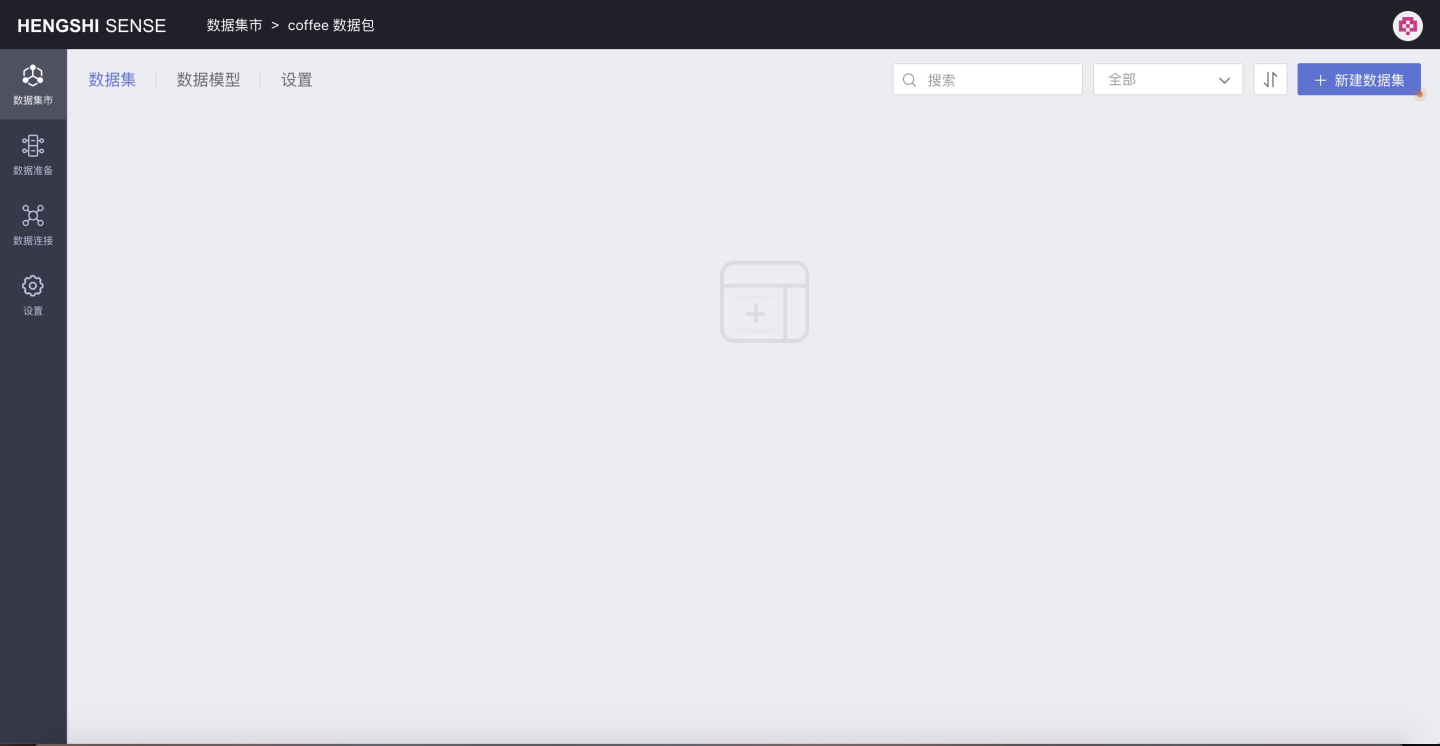
In the data package, you can create datasets, build data models, and set data permissions for the current data package.
Users with the Data Management + System Management roles can view the complete system marketplace construction, i.e., accounts with these roles can see all folders, data packages, and datasets created by all users in the marketplace.
Login with Data Management Role Only
Having the role of a data administrator allows you to perform data processing in the dataset market. However, users with only the Data Management role cannot create new folders on the dataset market homepage; they can only proceed with operations in folders and data packages that they have been authorized to access.
Taking the newly added user Data Administrator (data_admin) as an example, the interface displayed after logging in is shown in the figure below:
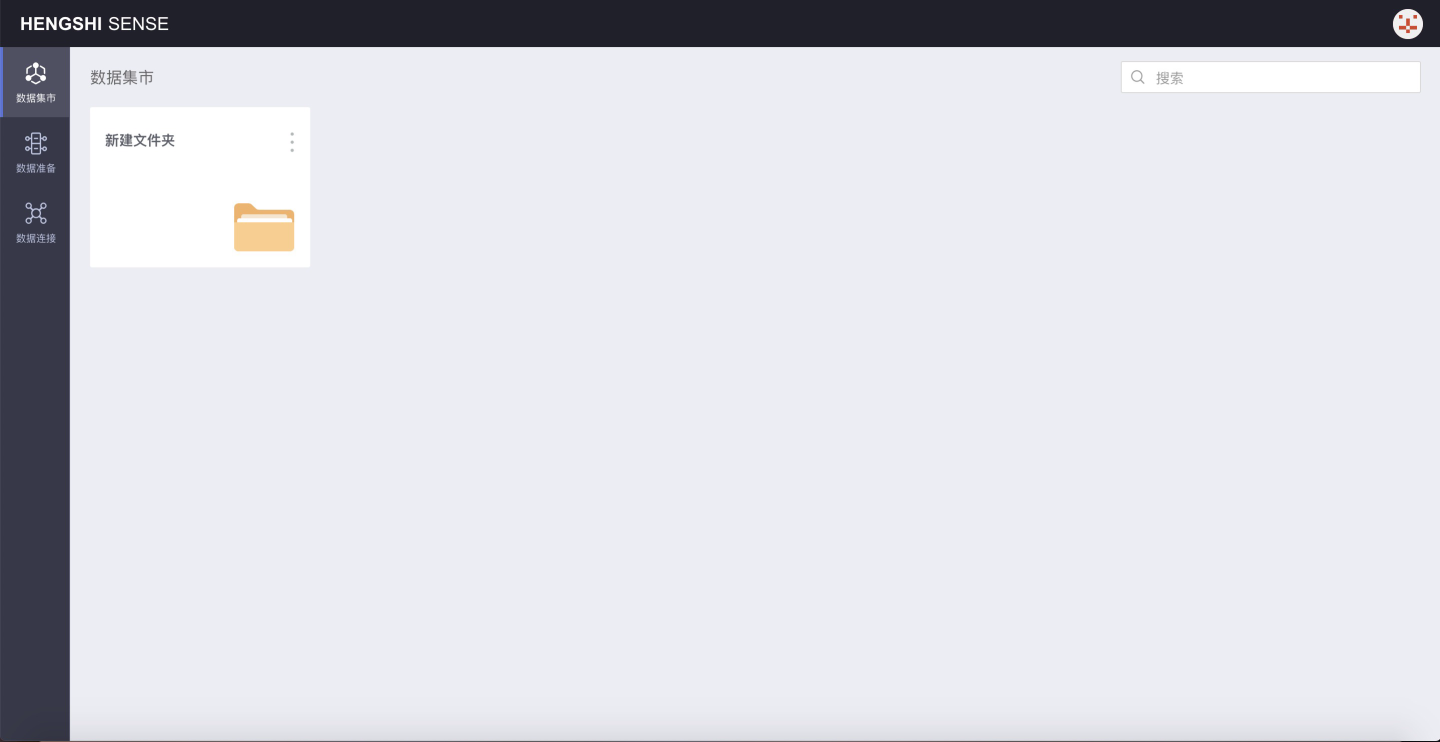
You can view the coffee folder that has already been authorized, but you cannot create new folders or datasets.
User data_admin has Editor permissions for the coffee folder, so they can create new folders, create new data packages, create new datasets in the data packages under the folder, and perform data processing.
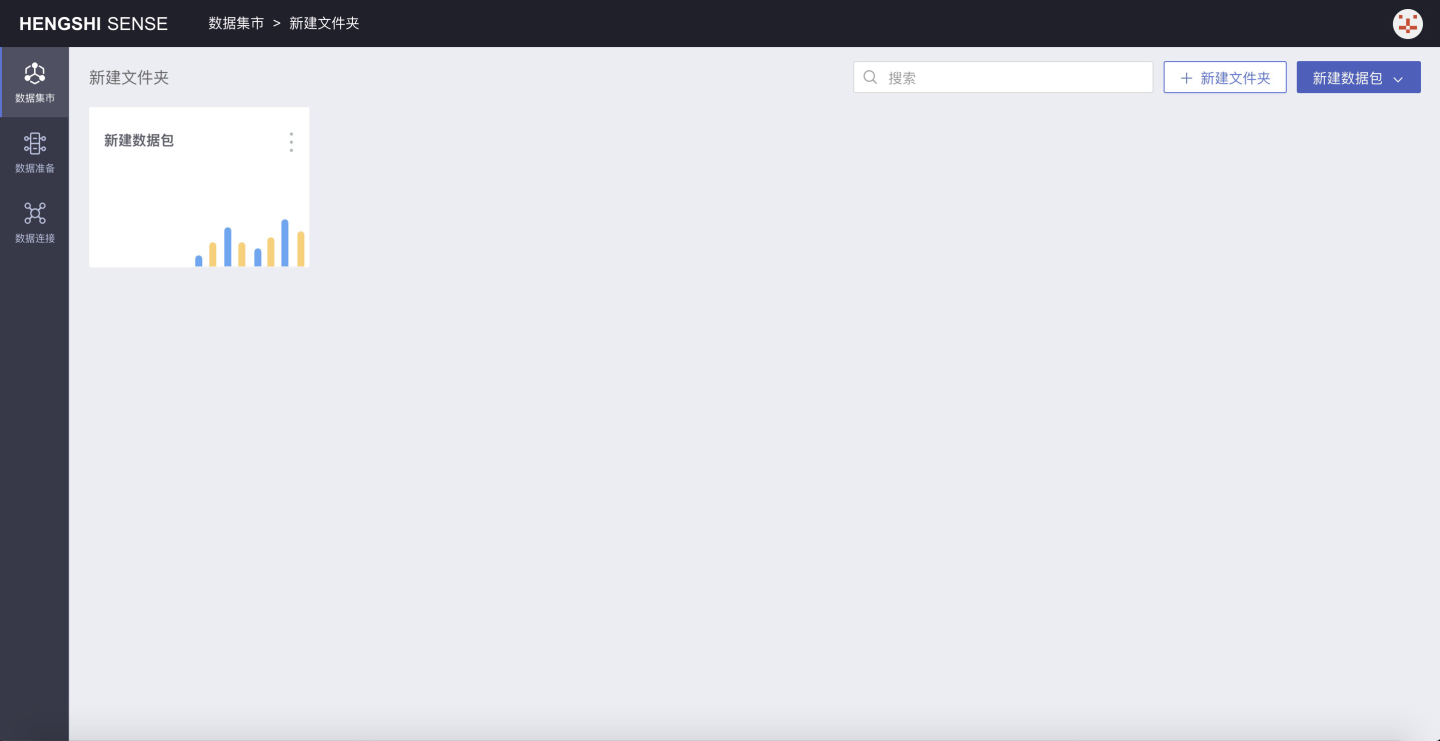
Only users with the Data Management role in the Dataset Market cannot create folders or data packages at the top level; they can create folders, create data packages, and perform data processing in folders they have permission to access in the Dataset Market.
The construction of the dataset market hierarchy requires users to have both roles: Data Management + System Management
Fifth: Team Space Construction
Version Information: New content added in version 3.0.
The Team Space feature has been added in version 3.0, providing report application management categorized by themes. Team Space supports the establishment of shared applications with hierarchical structures, granting different permissions such as management, editing, and viewing according to different departments and application scenarios, enabling various work scenarios for business management, business analysis, and business viewing.
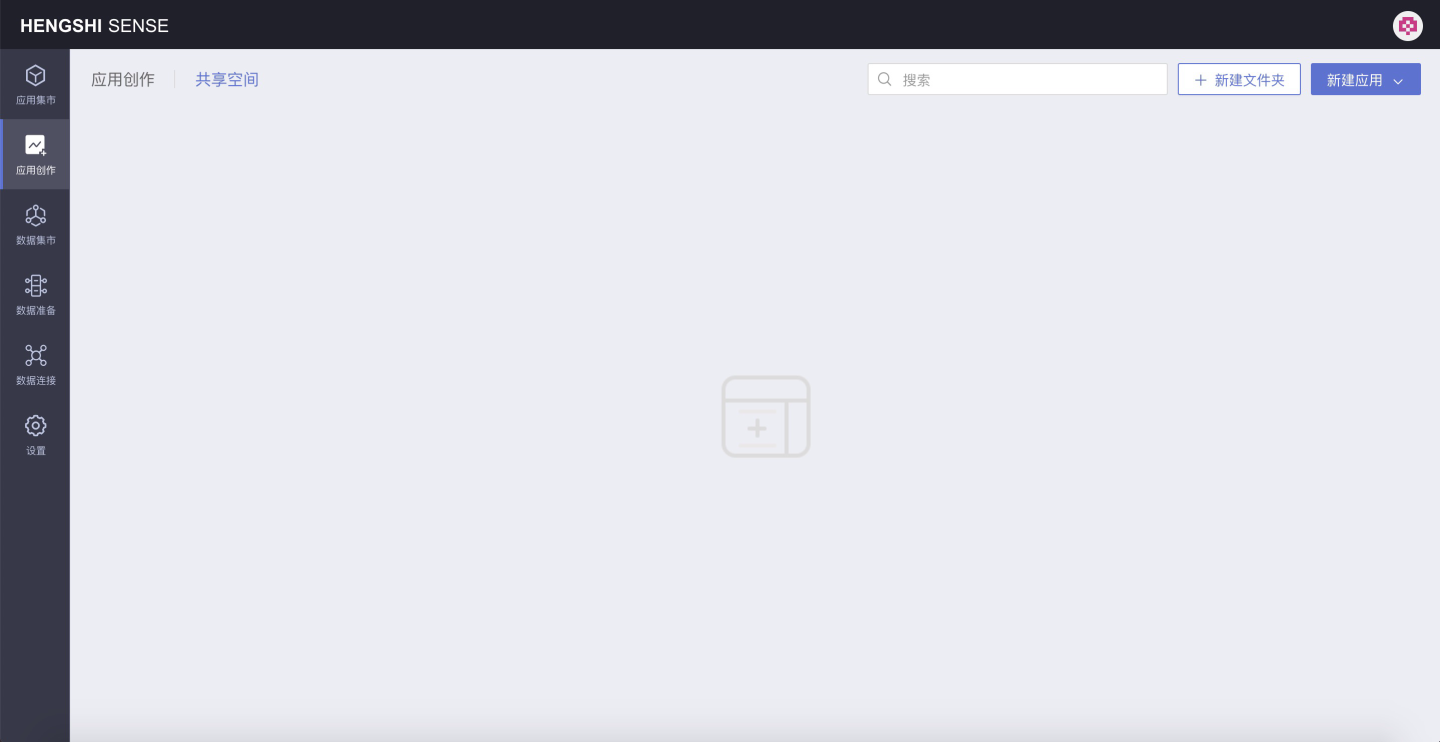
The restrictions on data roles in team spaces are as follows:
| User Role | Is Team Space Visible | Create Folder in Team Space |
|---|---|---|
| System Admin | Invisible | ----- |
| Data Admin | Invisible | ----- |
| Data Analyst | Visible | Cannot Create |
| Data Viewer | Invisible | ----- |
| System Admin + Data Admin | Invisible | ----- |
| System Admin + Data Analyst | Visible | Cannot Create |
| System Admin + Data Viewer | Invisible | ----- |
| Data Admin + Data Analyst | Visible | Cannot Create |
| Data Admin + Data Viewer | Invisible | ----- |
| Data Analyst + Data Viewer | Visible | Cannot Create |
| System Admin + Data Admin + Data Analyst | Visible | Can Create |
| System Admin + Data Admin + Data Viewer | Invisible | ----- |
| System Admin + Data Analyst + Data Viewer | Visible | Cannot Create |
| Data Admin + Data Analyst + Data Viewer | Visible | Cannot Create |
| System Admin + Data Admin + Data Analyst + Data Viewer | Visible | Can Create |
As shown in the table above:
Users accessing the
Team Spacemust have the Data Analysis role.Users with only the Data Analysis role cannot create apps or folders on the team space homepage.
Users with Data Management + Data Analysis + System Management roles can create folders and apps on the team space homepage.
Users with the Data Analysis role can access folders and apps that have been authorized by others.
Data Management + Data Analysis + System Management Role User Login
Create Folder and App
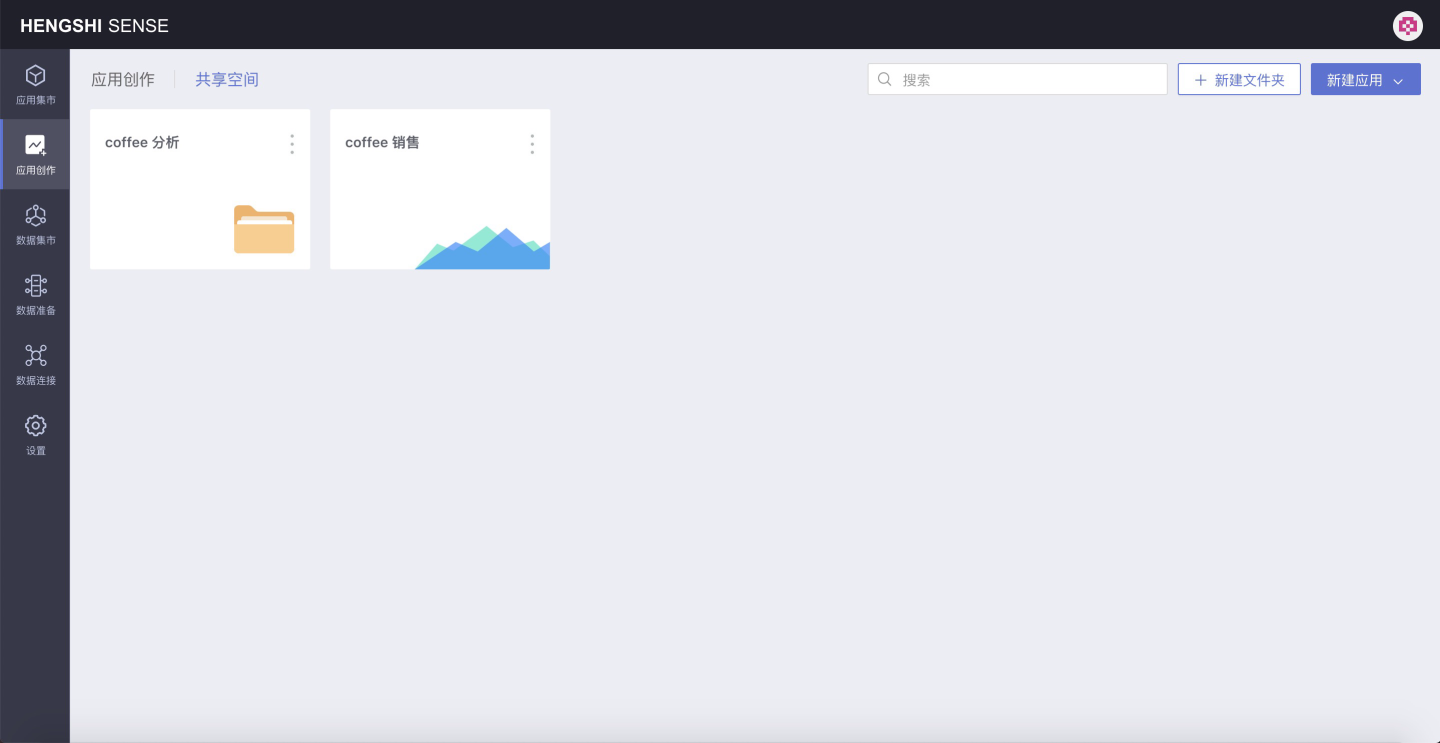
As shown in the image above, you can create folders and apps on the homepage of the Team Space. In the image, a folder named coffee analysis and an app named coffee sales have already been created.
Set Folder and App Access Permissions
Permissions can be set for folders and apps. Below is an example using the folder coffee analysis. Click the three-dot menu in the upper right corner of the folder:
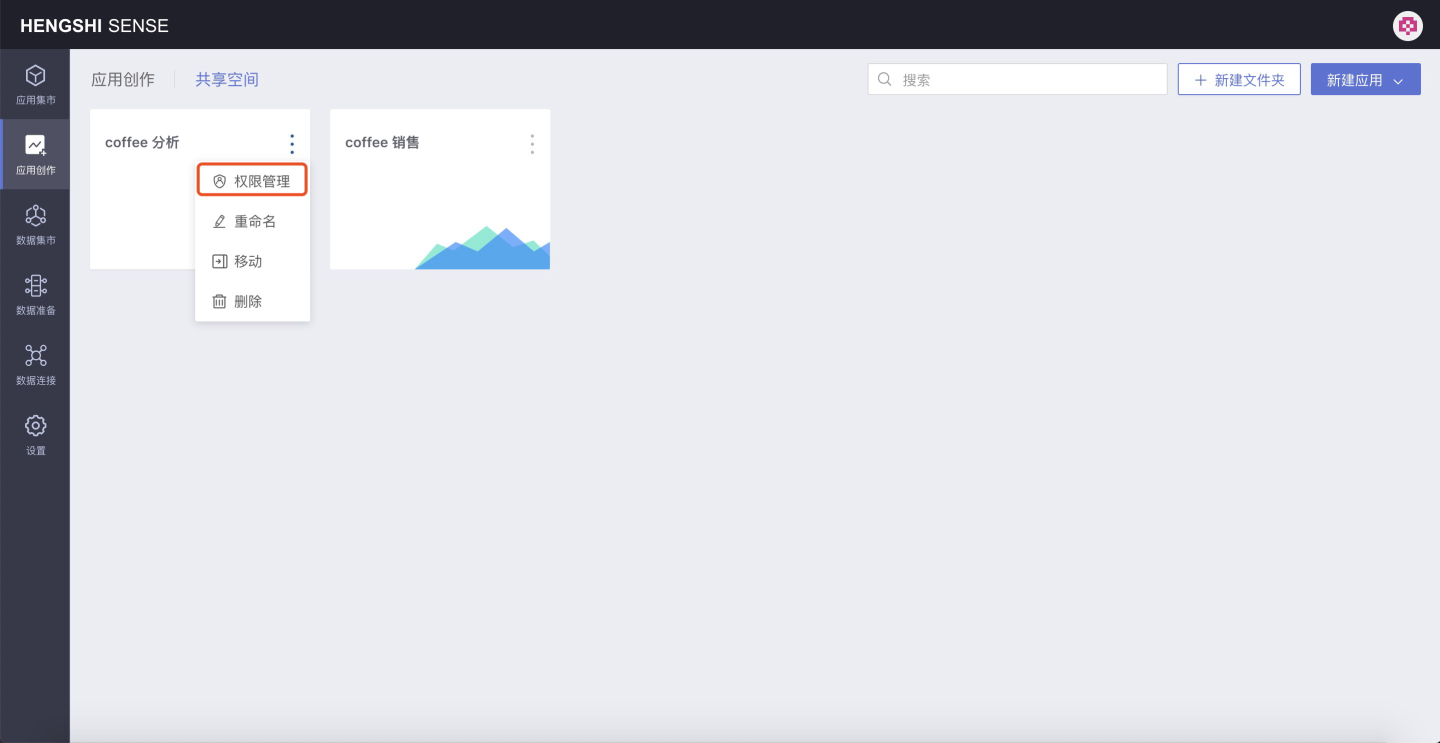
Click on Permission Management in the menu list:
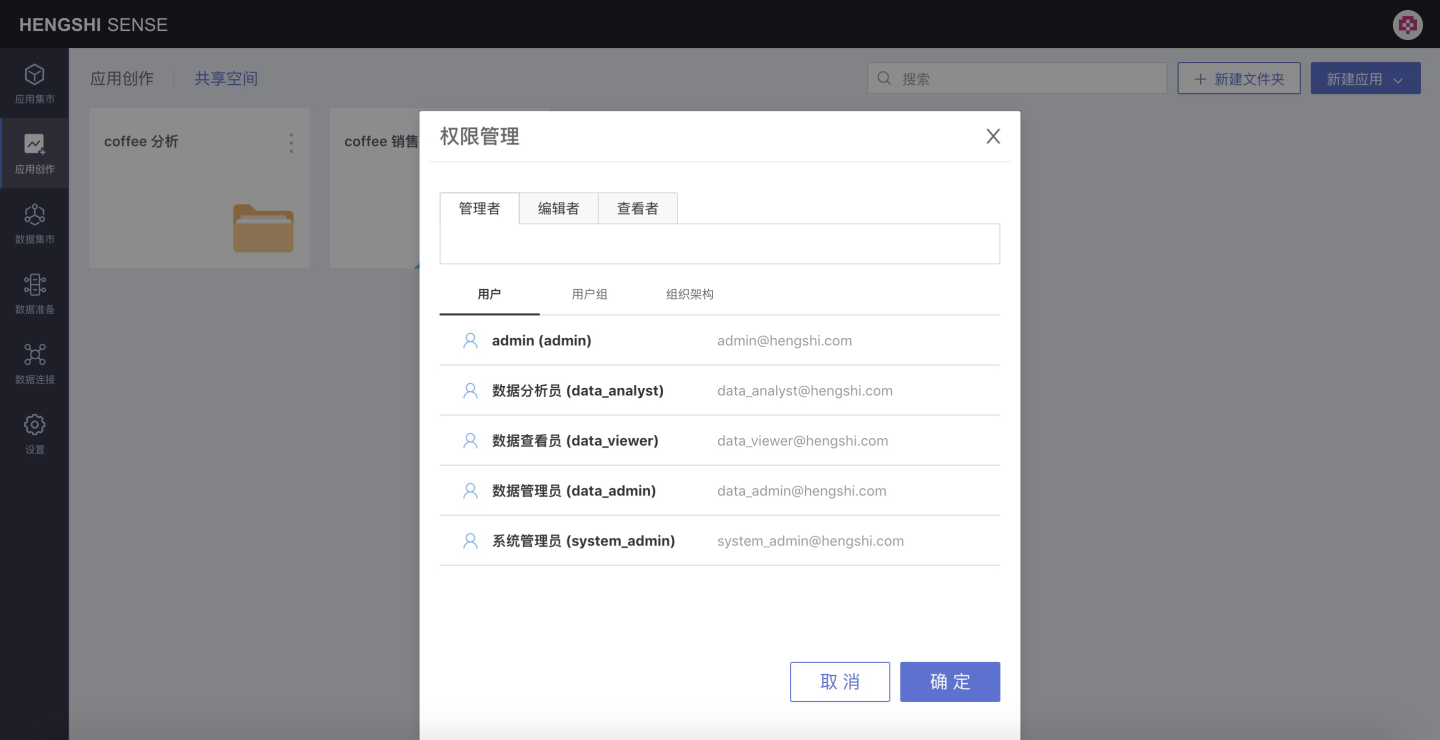
- Manager: Can edit, view, and use the folders, data packages, and datasets within the data packages under their management, and can modify the permission management of the folder/data package.
- Editor: Can edit, view, and use the folders, data packages, and datasets within the data packages under their management;
- Viewer: Can view and use the folders, data packages, and datasets within the data packages under their management;
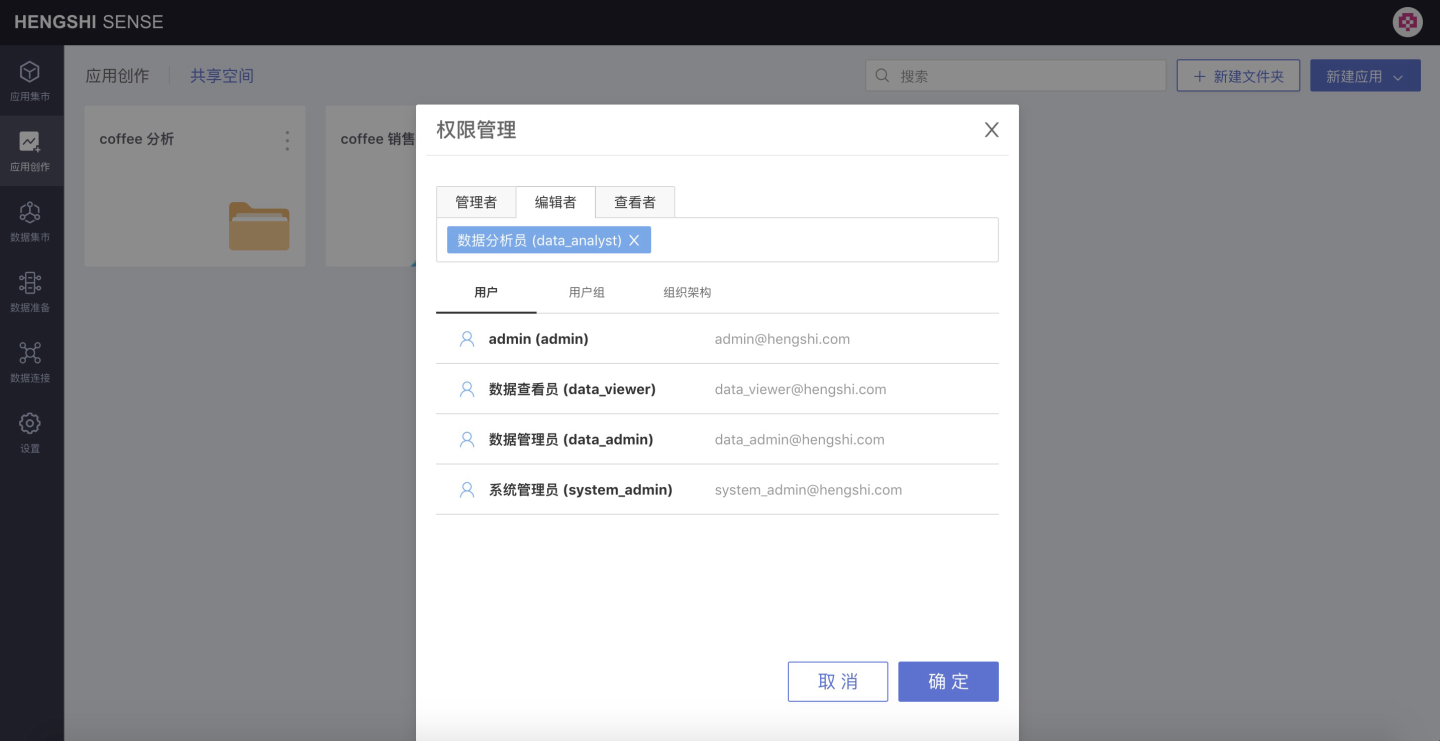
Set the permissions for the newly created user Data Analyst (data_analyst) in Section 1 as Editor:
Logged in with the Data Analysis role only
Users with the Data Analysis role can perform data visualization in team spaces. However, users with only the Data Analysis role cannot create new folders or apps on the team space homepage; they can only proceed with operations in folders or apps that they have been granted access to.
In the first section, the newly created user Data Analyst (data_analyst) only has the Data Analysis role and already has edit permissions for the coffee analysis folder. Below, we will use the operations after logging in with this user as an example:
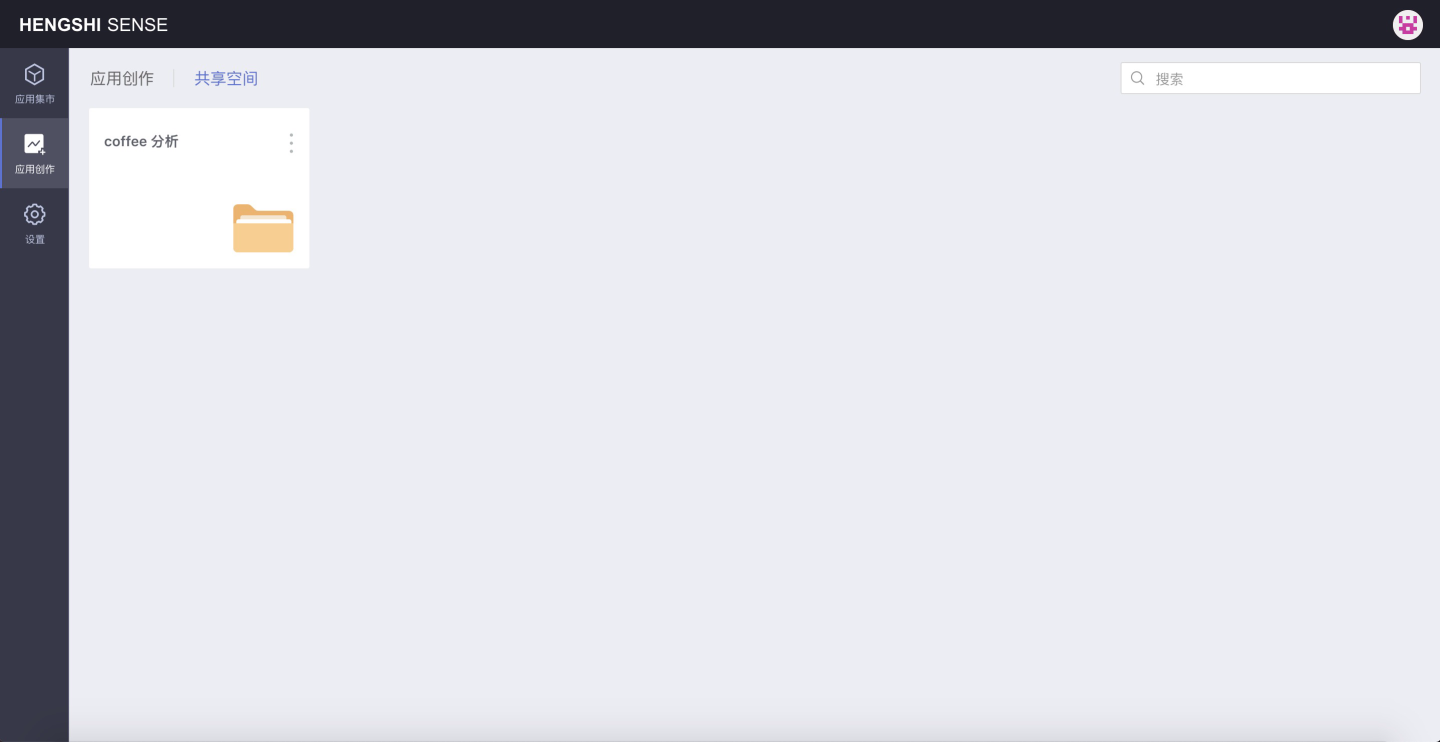
You can view the coffee analysis folder that has already been authorized, but you cannot create new folders or apps.
User data analyst (data_analyst) has editor permissions for the coffee analysis folder, so they can create folders, create apps, create datasets in the data packages under the folder, and perform data processing.
As shown in the image below, in coffee analysis, create a new folder coffee products and a new app coffee sales:
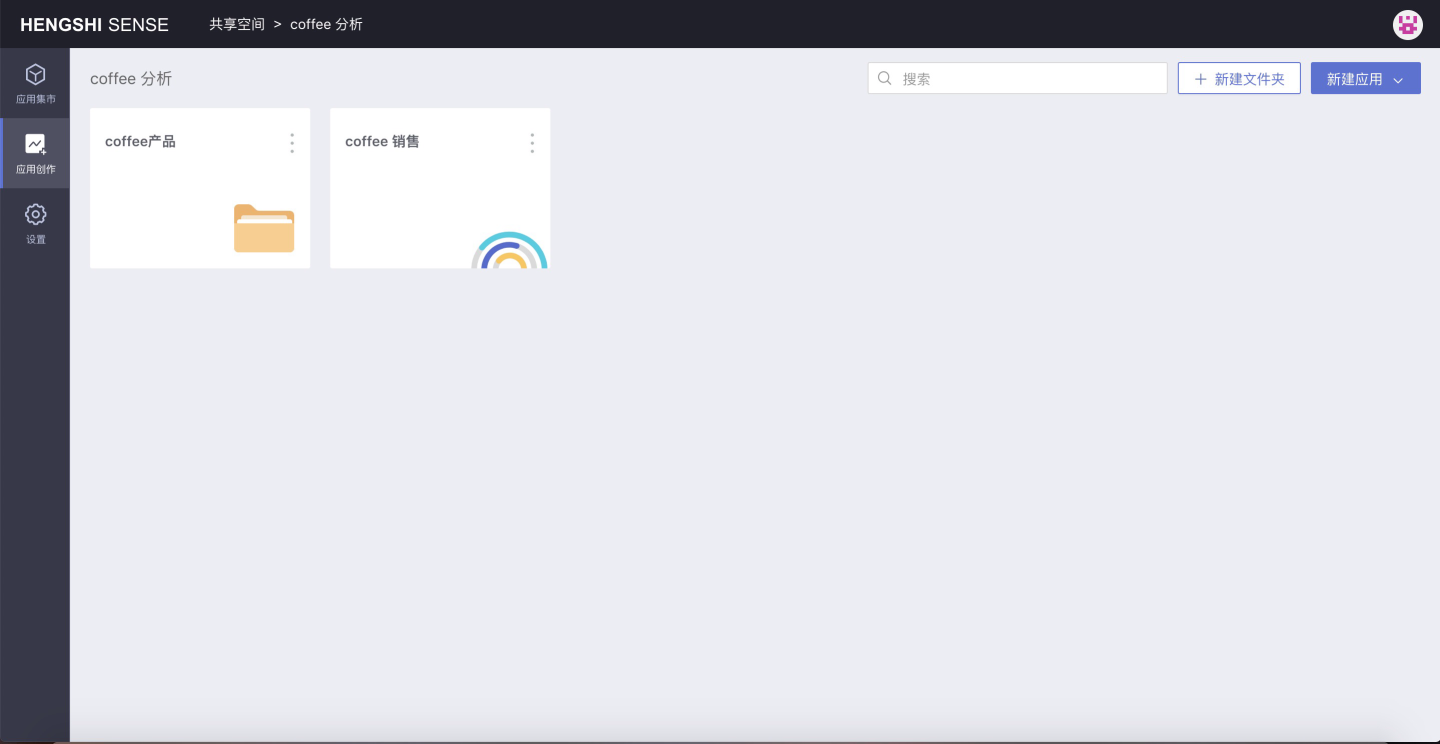
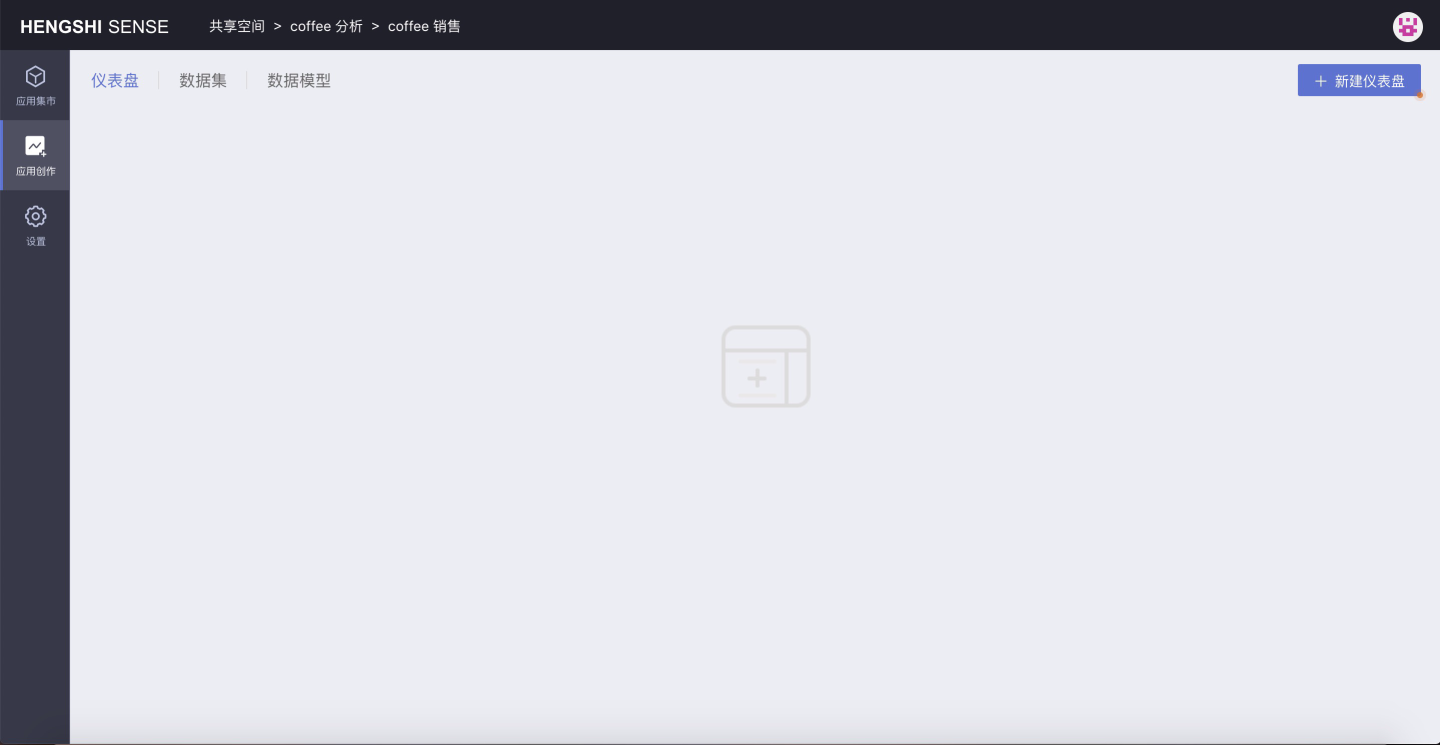
In the coffee sales app, you can create a dashboard, create a dataset, data model, and data processing, etc.:
Create Chart
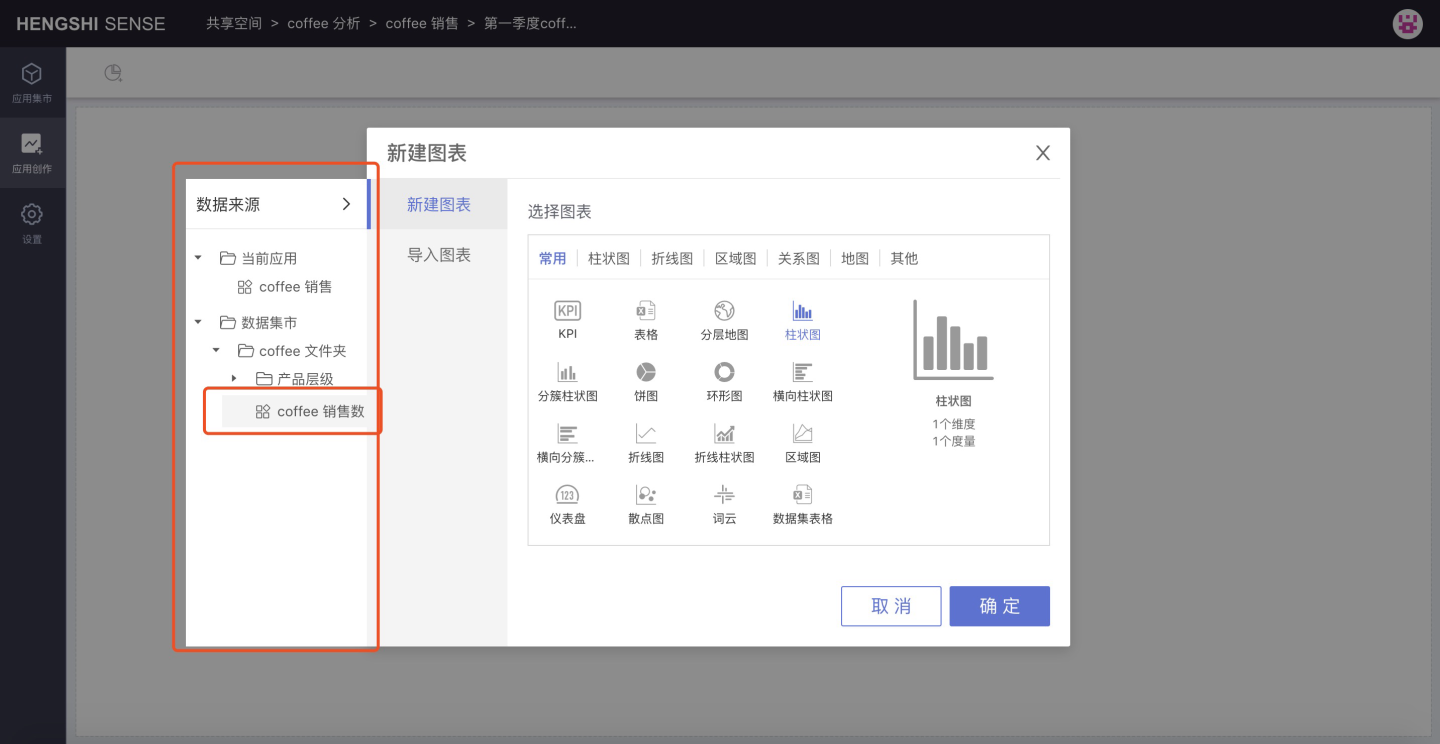
When creating a chart, you can use a dataset from a specific data package in the dataset market, or directly use a dataset from the current app.
Use Dataset Market Dataset
When creating a chart, click the expand button on the side of the chart type selection, choose the data package from the dataset market that the chart needs to use, where gray indicates the selected state, as shown below, select the coffee sales data data package:
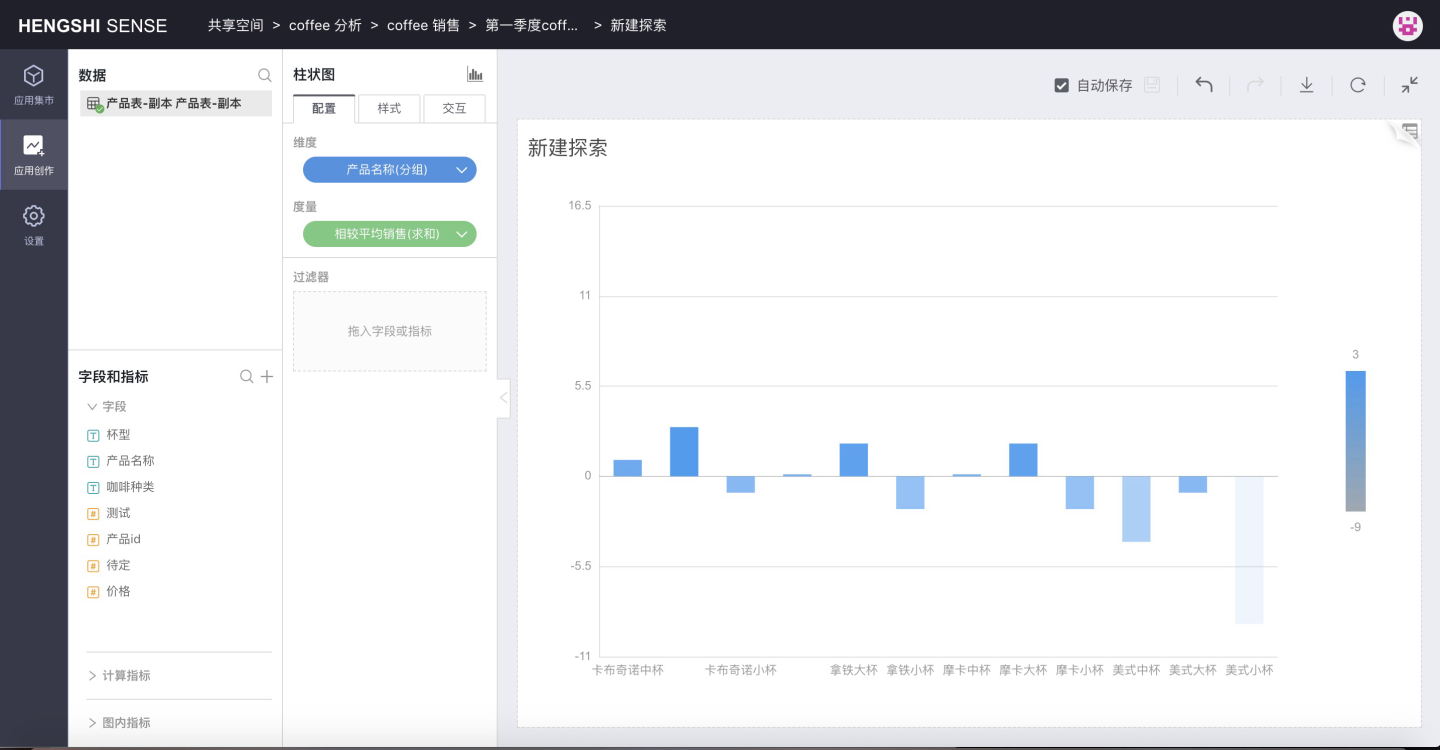
Click OK to successfully select the chart type and data package, and open the chart editing page. The dataset list on the left side lists the datasets in the selected data package, which can be used to create charts:
Use the Current App Dataset
When creating a chart, expand the expand button on the side of the chart type selection, the default selected is the name of the current application:
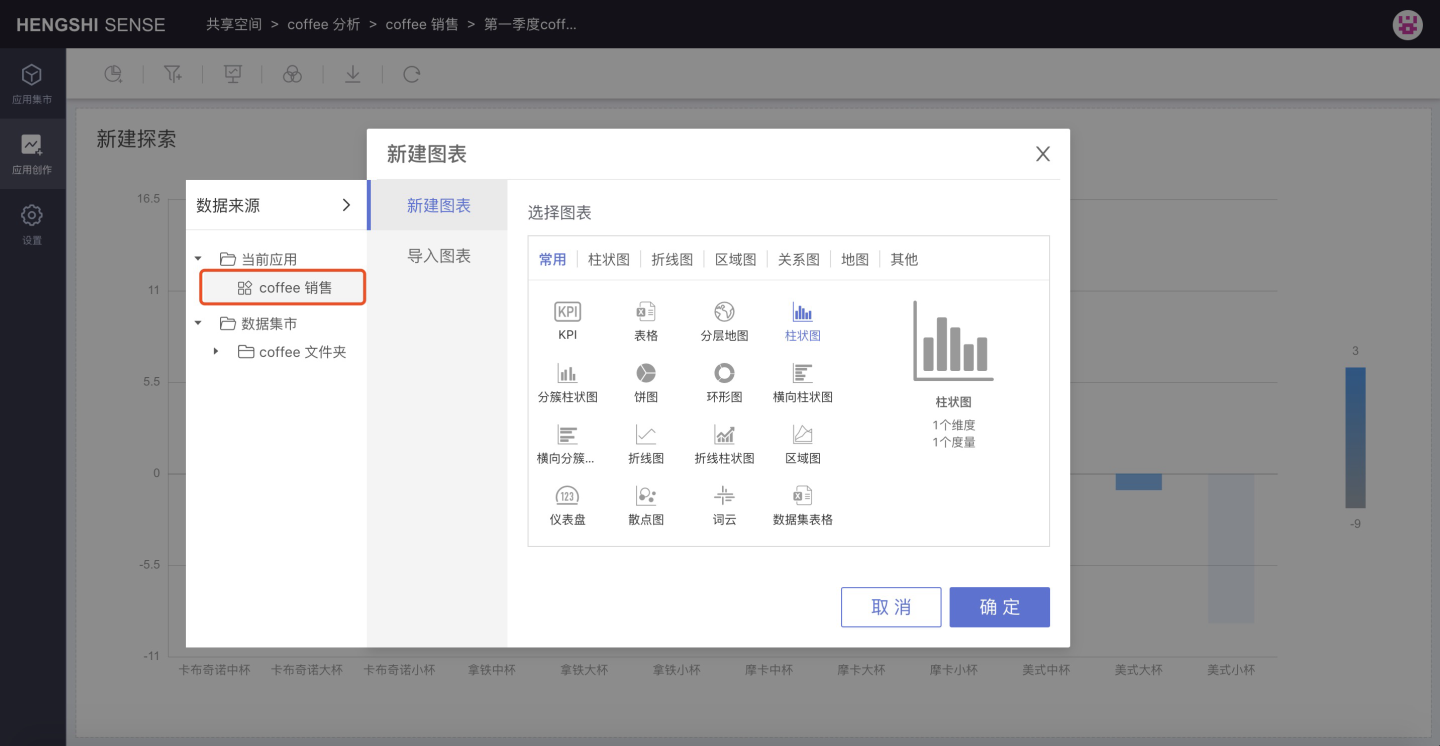
When using the dataset of the current app to create a chart, on the page where you select the dataset and chart type, you can directly choose the chart type, click OK, and it will default to the dataset within the current app.
Click OK, the chart type and data package selection are successful, and the chart editing page is opened. The dataset list on the left side lists all datasets in the current app, which can be used to create charts:
