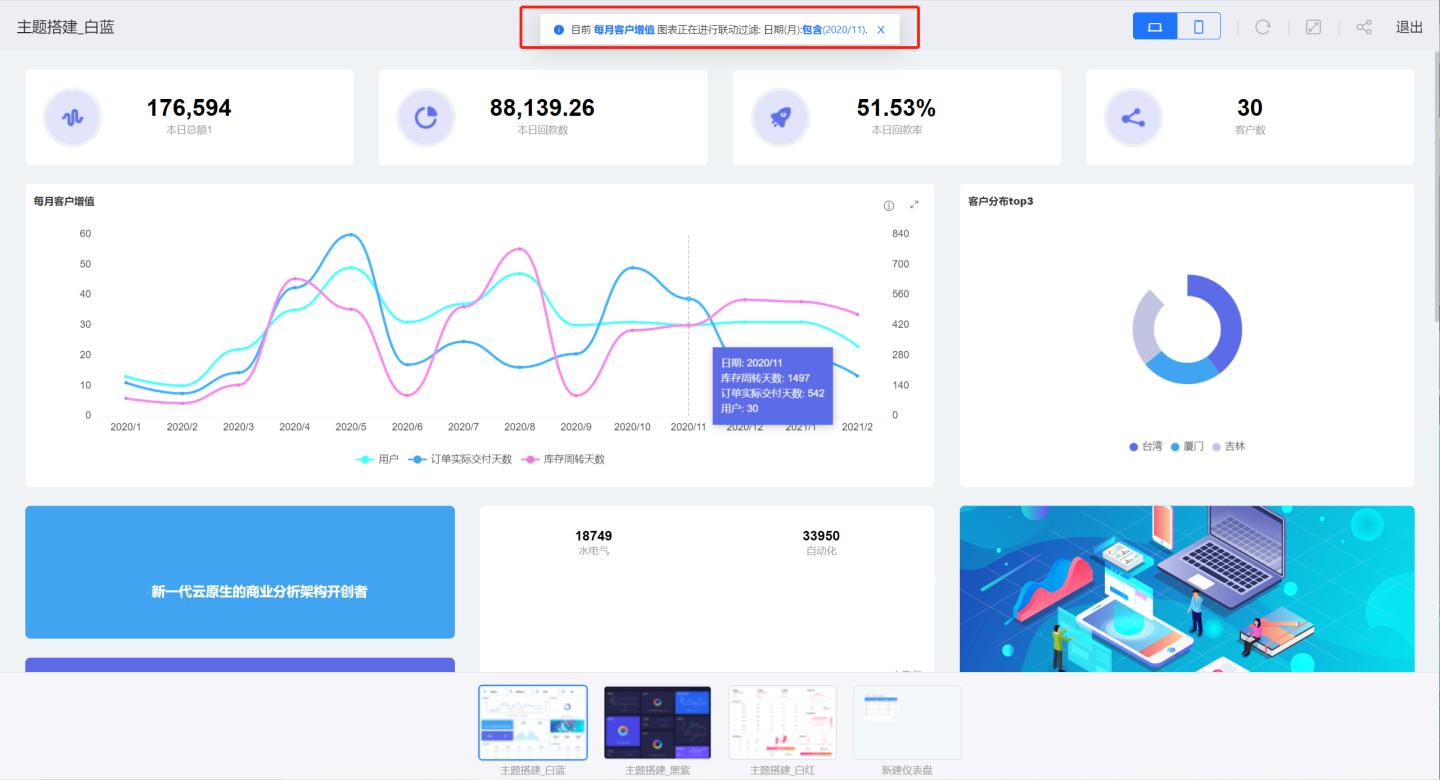
Application Display Interaction
The App Market, when displaying apps, interacts with dashboards and charts, primarily including functions such as Go to Analysis, Save Current Filter Snapshot, Refresh, Full Screen, Embed, and Export.
Go to Analysis
Analysis is an enhanced feature for charts. The system integrates the Metrics Analysis functionality with published apps, enabling published charts to have secondary analysis capabilities.
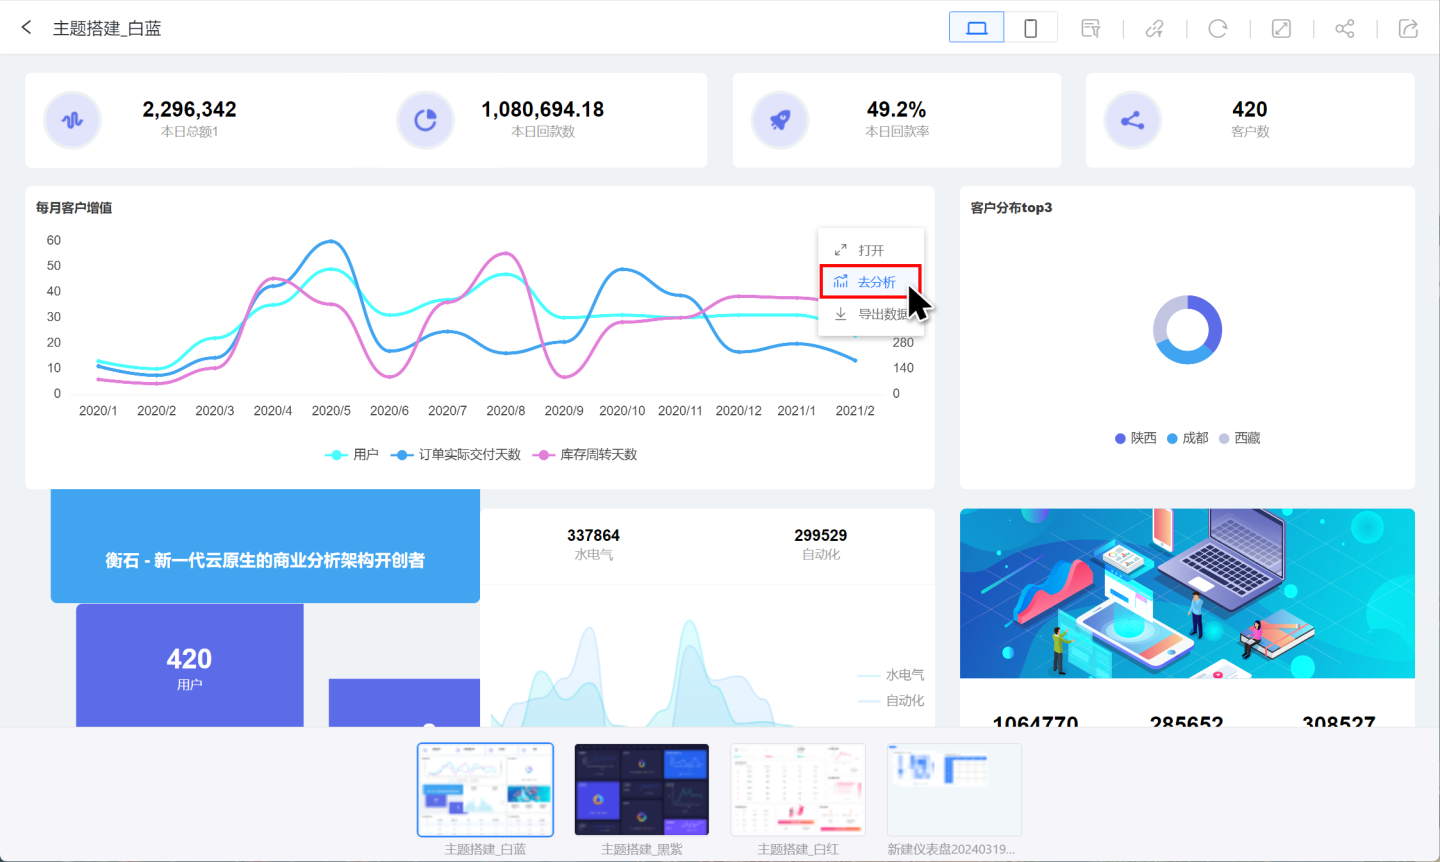
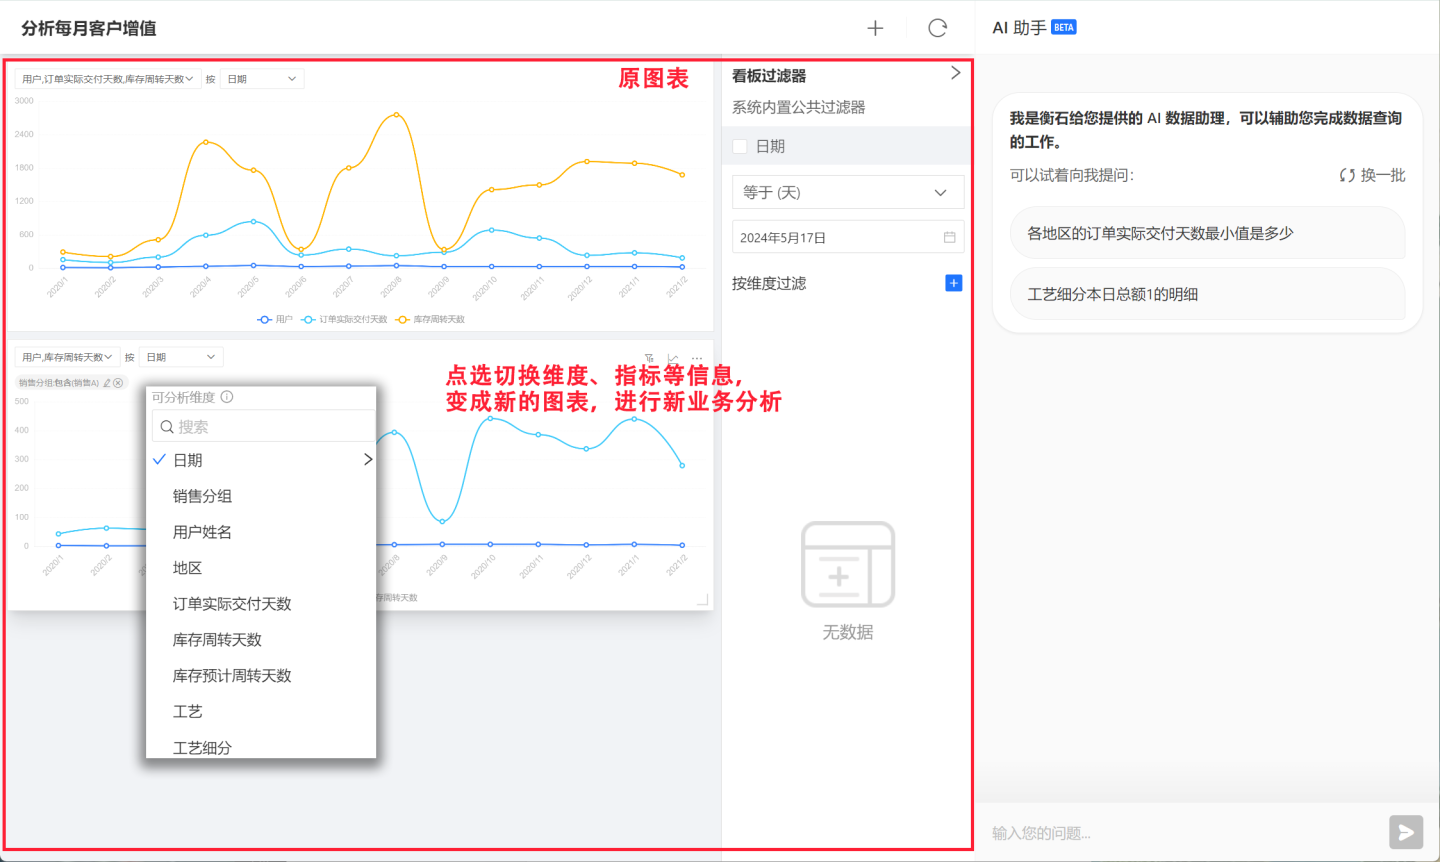
Chart exploration consists of two parts: the first part is the self-service analysis of chart indicators, and the second part is the AI query assistant.
Metrics Self-Service Analysis for Charts
In the analysis page (red box in the image below), users can select chart indicators and their analysis dimensions to present new business chart information. Users can analyze the business from multiple angles. Multiple charts can be copied for comparative analysis, and functions such as dimension filtering are supported. The entire operation process is point-and-click, requiring no data analysis foundation from the user. For detailed guidance on indicator analysis, please refer to Indicator Analysis.
AI Data Query Assistant
To analyze the AI Assistant feature carried by the analysis page, users can input questions in the Q&A box to obtain corresponding charts and summary analyses. The charts can be inserted into the left dashboard for comparative analysis.

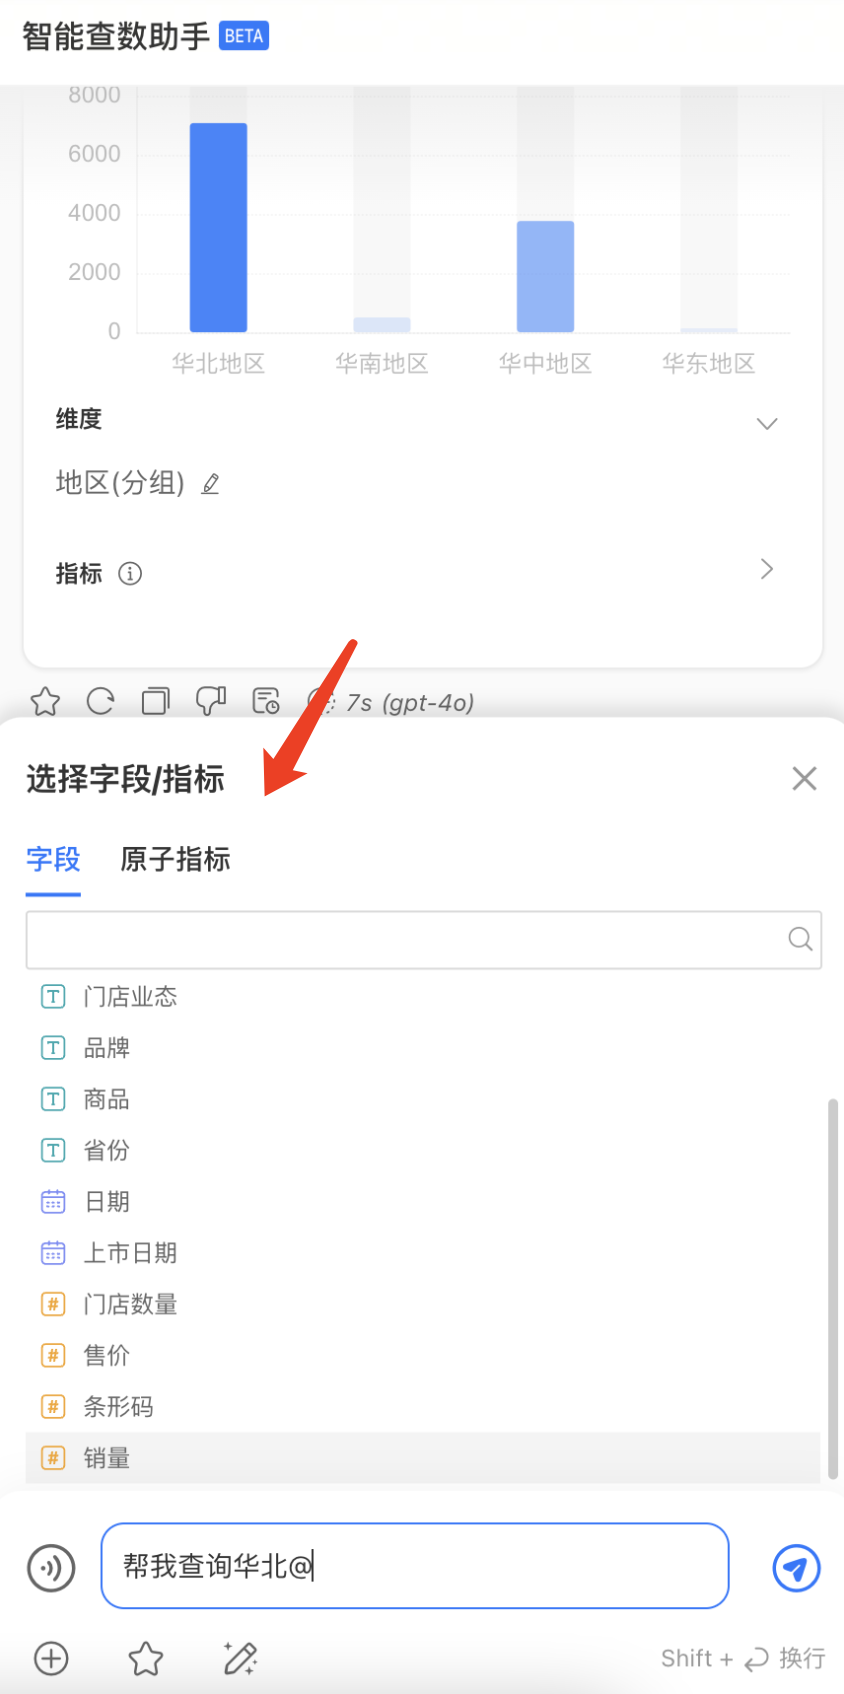
AI Assistant supports the following 3 methods to assist in inputting queries, allowing for more accurate and efficient data retrieval.
- Support saving queried issues
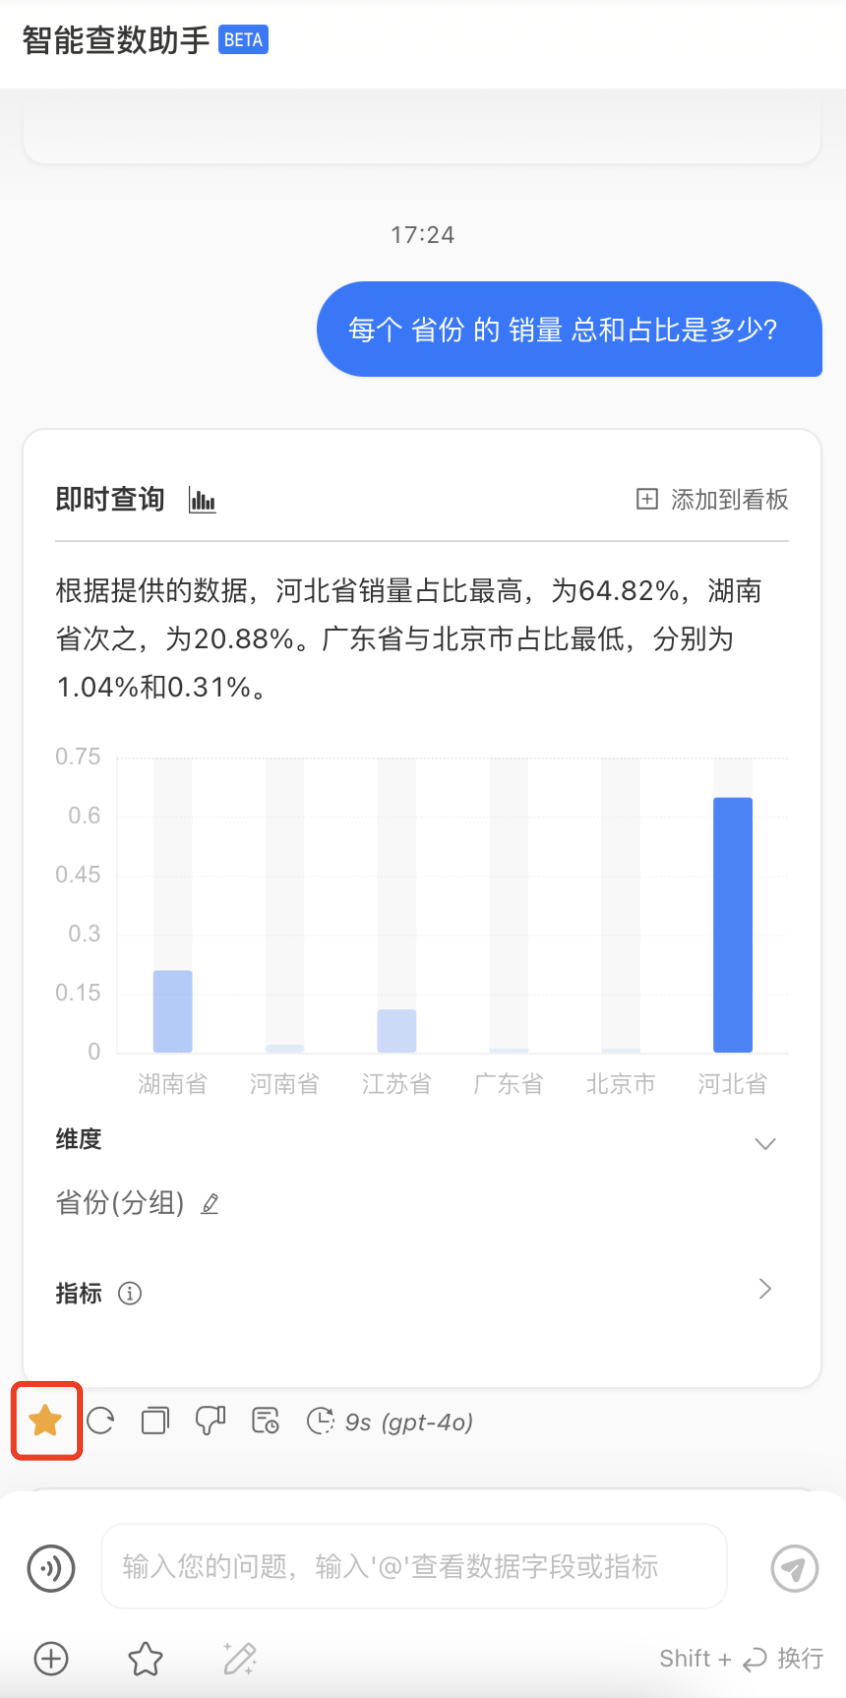
- Supports large model calibration and optimization of input box content
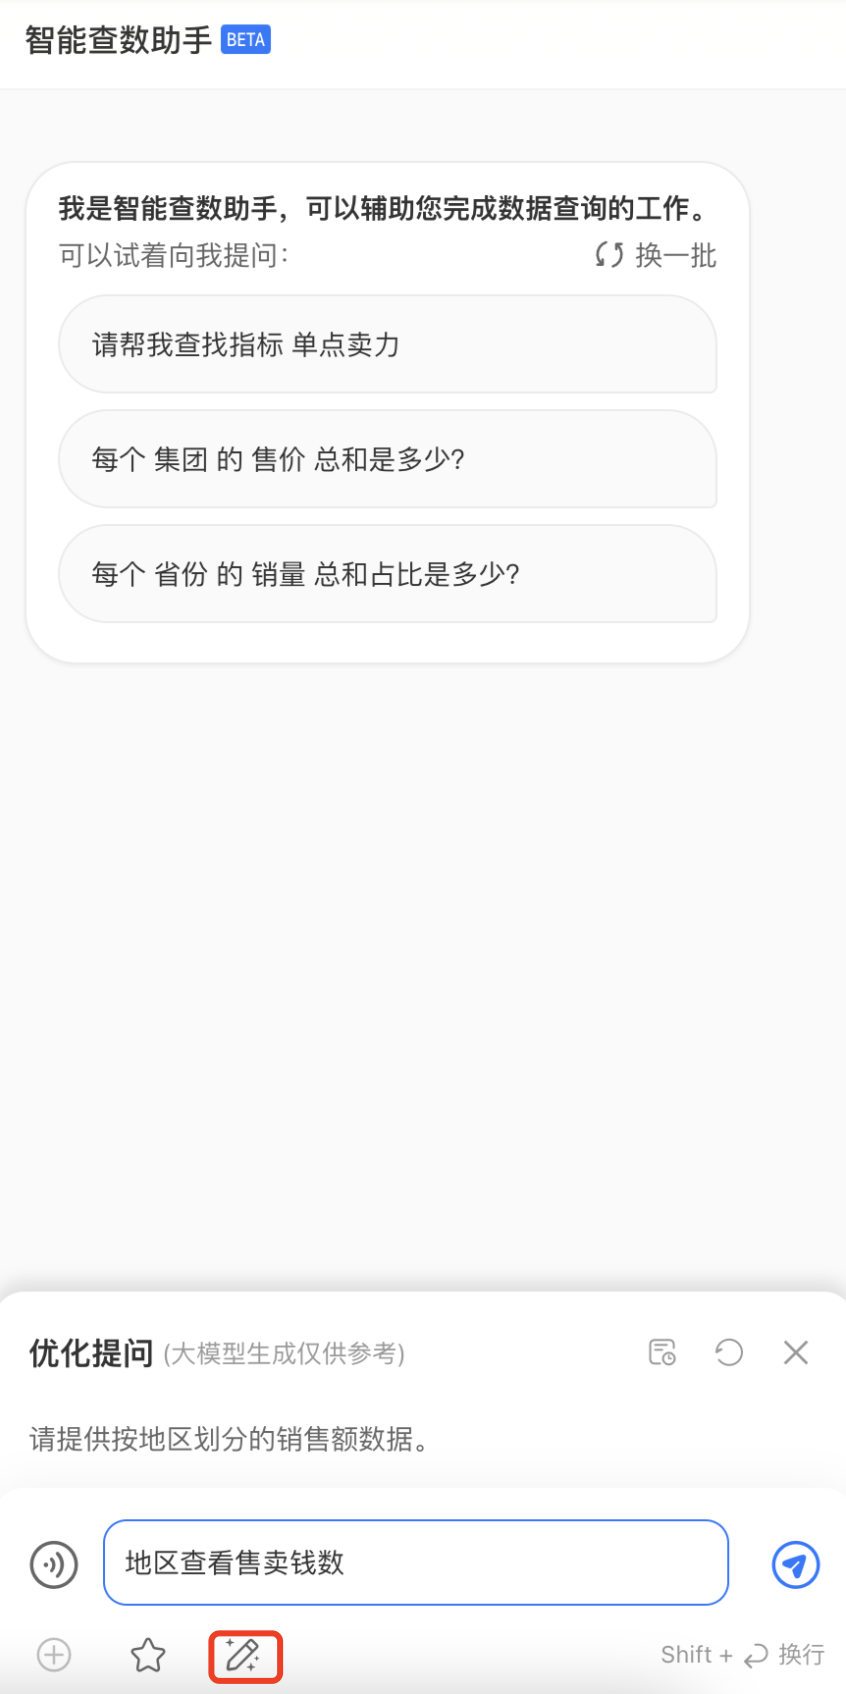
- Supports inserting fields or indicator information from the current analysis data source into the input box using the
@symbol
Tip
Before using the AI assistant feature, you need to configure.
Export
After analyzing the charts within the app in the App Market, it supports exporting the analyzed dashboard results.

Save Current Filter Snapshot
Dashboards often use filters to view analysis data in different scenarios. When users switch from one scenario to another, they need to adjust the corresponding filter option values. When there are many filters or the user's display scenarios change frequently, it is necessary to operate the filters frequently.
The dashboard's save filter snapshot feature allows users to save different business scenario filtering conditions. When displaying, users only need to import the corresponding scenario snapshot, eliminating the need to operate the filter again, enabling quick switching between different business scenarios. As shown in the figure, User A is responsible for sales information in the Northeast and North China regions. When viewing the dashboard, they want the filter to display information for the Northeast and North China regions. Therefore, they save the filtering configuration for the Northeast and North China regions, and each time they only need to import the snapshot information to see the corresponding information, without the need for further filtering.

Saving the current filter snapshot is straightforward. When users encounter a snapshot they need to save during filter selection, they can click to save the filter snapshot to the temporary storage area. Snapshots in the temporary area will be lost when the snapshot window is closed. By clicking save in the temporary area, users can save the snapshot to their system (permanent area). When reopening the dashboard, users can find the saved snapshot information in the permanent storage area.

Snapshots saved in the system can support operations such as setting as default, importing, renaming, and deleting.
- Set as Default: Use the filter options in the snapshot as the default option values for the filter. Each time the dashboard is opened, it will read the information from the snapshot instead of the initial settings of the dashboard. Users can customize the business scenarios displayed by the dashboard through this function.
- Import: Import the filter information from the snapshot during the dashboard display process to show the corresponding data.
- Rename: Rename the filter snapshot.
- Delete: Delete the snapshot information.
Refresh
Refresh chart data directly without using chart cache data.
Full Screen
Dashboard full screen display. In full screen mode, you can set Auto Play.
Embedding
Dashboards, charts, and the app itself within the application support embedding. Users can perform embedding operations at different levels based on their presentation needs. Both the apps in the App Market and those created in the App Authoring section support embedding.
Iframe Embedding Guide
Take the embedding of an app as an example to introduce how to perform Iframe embedding. The process of embedding and sharing dashboards and charts is similar to that of app embedding, so it will not be elaborated here.
Click the embed button in the upper right corner of the app and select "Embed This App."
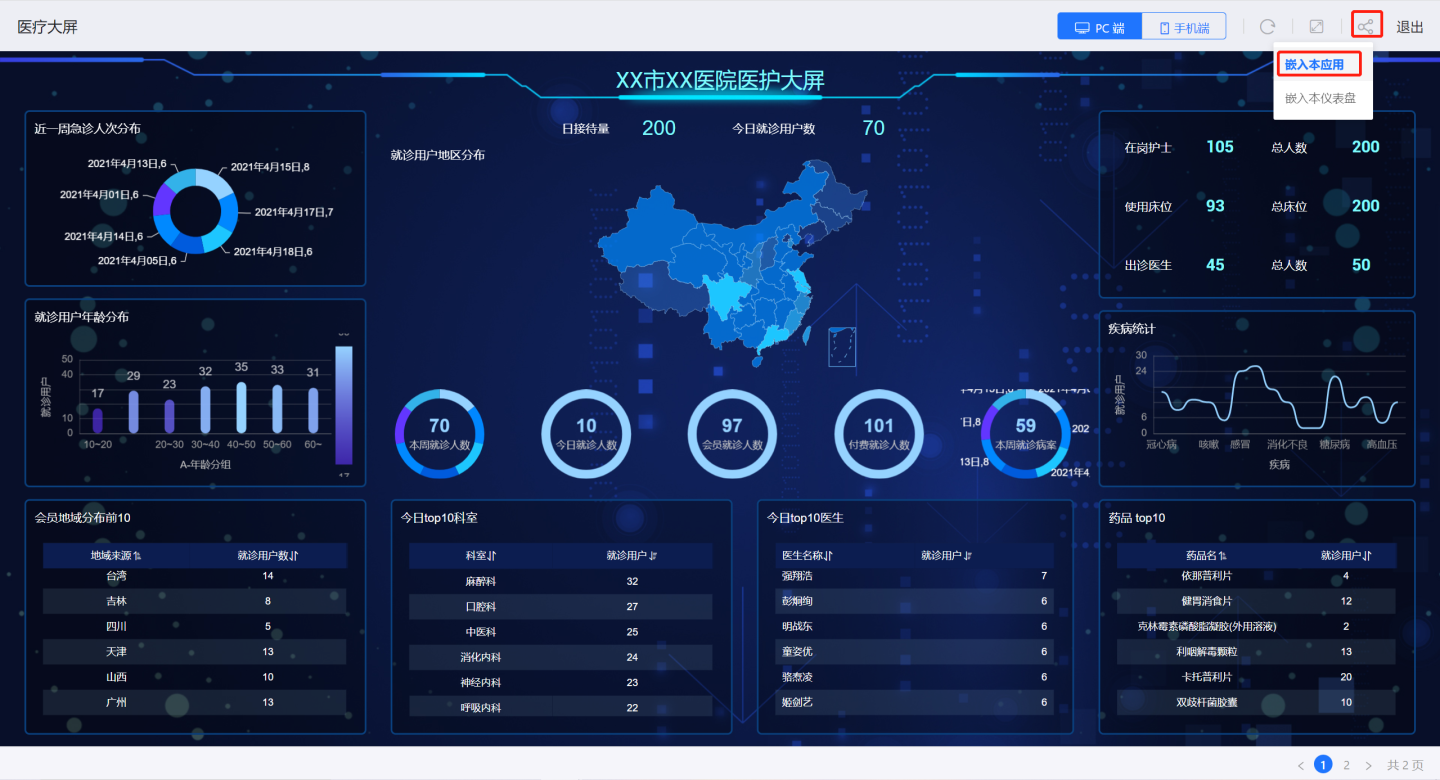
The embed window is displayed, containing the embed URL and iframe example.
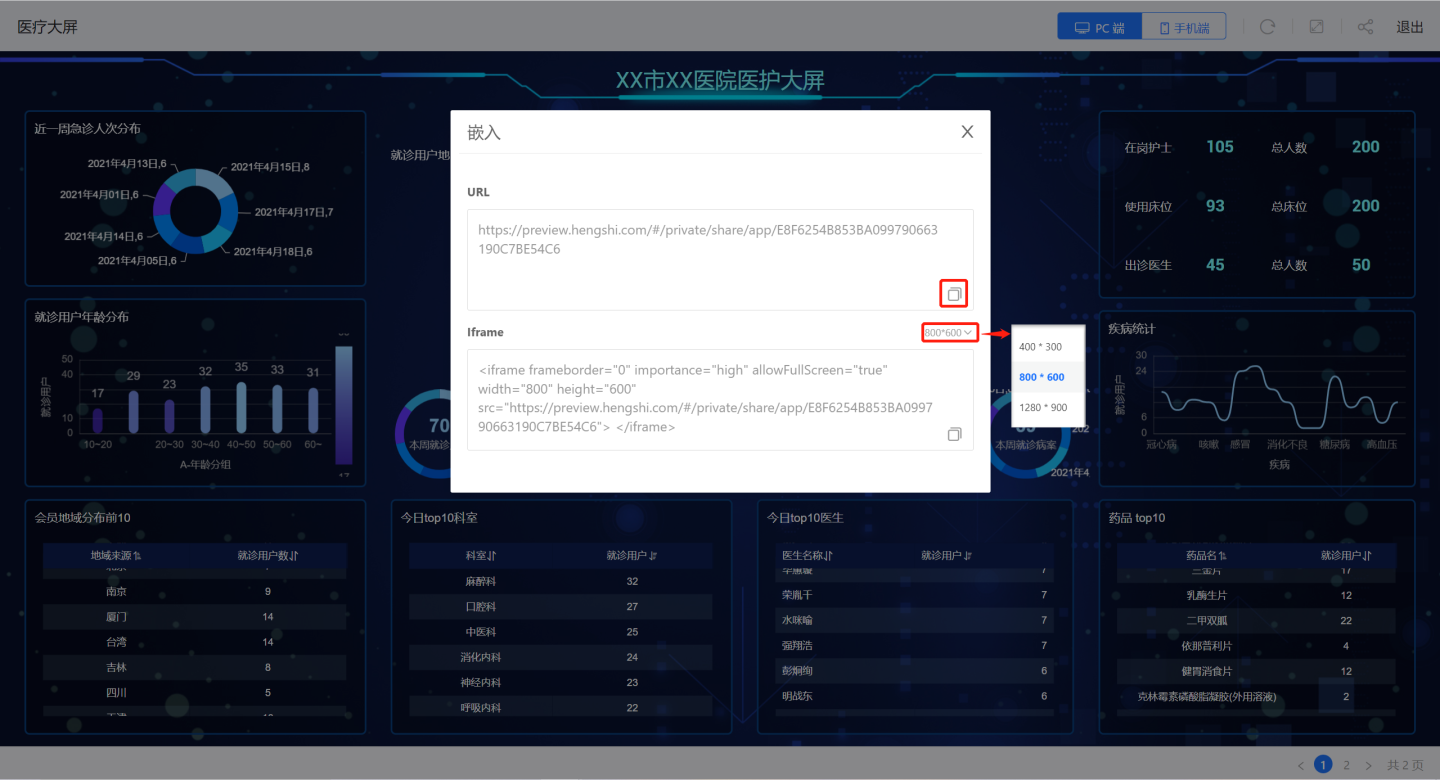
The URL in the embed window can be directly shared, allowing users to display it directly in the browser using this link. As shown in the figure, the embedded page only has refresh, full-screen, and export buttons, with no other functional operation buttons.
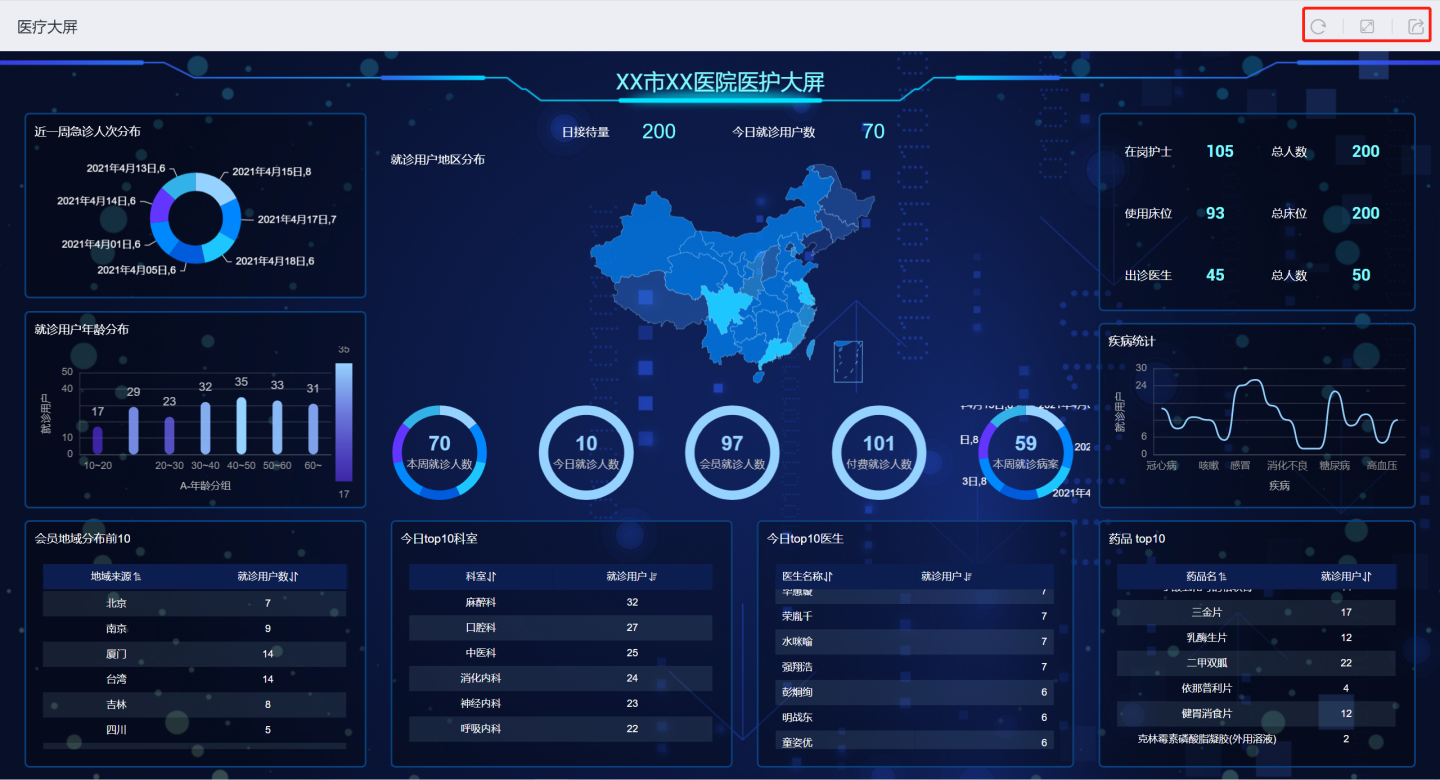
The iframe in the embed window provides an example for embedding in code, supporting various custom parameters, allowing users to adjust the display style after embedding through parameters. The example below shows the display effect after embedding with an iframe size set to 800*600.

Instructions
- When embedding Apps or Dashboards, only the refresh, full-screen, and export buttons are displayed; PC-specific function buttons are not shown.
- To embed a Chart, first open the Chart, then click the embed button to obtain the link content.
- Filters are not carried over during embedding.
Custom Parameters for Embedded Scenarios
Apps, Dashboards, and Charts support various custom parameters when embedded, allowing users to set embedding parameters as needed to influence the display effects after embedding.
Embed Chart Parameters
| Parameter Name | Usage Example | Description |
|---|---|---|
| noTitle | 1. noTitle=true 2. noTitle=false 3. Default setting | Set whether to display the title: true - Do not display the title false - Display the title Default setting, display the title |
| titleColor | 1. titleColor=rgb(0, 0, 0) 2. titleColor=rgba(0, 0, 0, 1) 3. titleColor=red 4. titleColor=hsl(0,0,0) | Set the title color of the chart, does not support RGB hexadecimal color setting |
| chartBackground | 1. chartBackground=rgb(0, 0, 0) 2. chartBackground=rgba(0, 0, 0, 1) 3. chartBackground=red 4. chartBackground=hsl(0,0,0) 5. chartBackground=transparent | Set the background color of the chart, does not support RGB hexadecimal color setting When the parameter is "transparent", the chart displays a transparent background color |
Embed Dashboard Parameters
| Parameter Name | Usage Example | Description |
|---|---|---|
| copyright | 1. copyright=true 2. copyright=false 3. copyright=other values | Whether to display the header and footer: true, display false, do not display Default setting is to display |
| background | 1. background=rgb(0, 0, 0) 2. background=rgba(0, 0, 0, 1) 3. background=red 4. background=hsl(0,0,0) | Dashboard background color, does not support RGB hexadecimal color setting |
| padding | padding=5 | Set margin, unit is pixel px |
| scrollable | 1. scrollable=true 2. scrollable=false 3. scrollable=other values | Dashboard vertical axis scrollbar setting: true, can scroll false, cannot scroll Other values, default setting can |
| chartBackground | 1. chartBackground=rgb(0, 0, 0) 2. chartBackground=rgba(0, 0, 0, 1) 3. chartBackground=red 4. chartBackground=hsl(0,0,0) chartBackground=transparent | Set chart background color, does not support RGB hexadecimal color setting When the parameter is "transparent", it is a transparent background color |
| chartGap | chartGap=5 | Set the spacing between charts, unit is pixel px |
| chartTitleColor | 1. chartTitleColor=rgb(0, 0, 0) 2. chartTitleColor=rgba(0, 0, 0, 1) 3. chartTitleColor=red 4. chartTitleColor=hsl(0,0,0) | Set chart title color, does not support RGB hexadecimal color setting |
| chartAccessible | 1. chartAccessible=true 2. chartAccessible=false 3. chartAccessible=other values | true, can be opened false, cannot be opened Other values, default setting can be opened |
| isMobile | name="isMobile" | When using this parameter, the dashboard is displayed in mobile style. Note that if the dashboard does not have a corresponding mobile display style, using this parameter will result in a 404 error. |
JS SDK Embedding
Iframe embedding involves two renderings in the browser, which increases the page loading time. When multiple charts are embedded in a single page, each chart undergoes two renderings, resulting in a slow overall page loading speed, affecting the page display effect.
To better address the performance issues of embedding dashboards and charts, the system has introduced the JS SDK embedding method, which directly renders dashboards and charts within the embedded page. When multiple dashboards or charts are embedded on the same page, each embedded page only loads static resources once, significantly improving rendering speed compared to iframe embedding. The JS SDK supports dynamic adjustment of the embedded page's style and interaction, making the embedding method more flexible. The JS SDK has a higher entry barrier than iframe, requiring embedding personnel to be familiar with JavaScript.
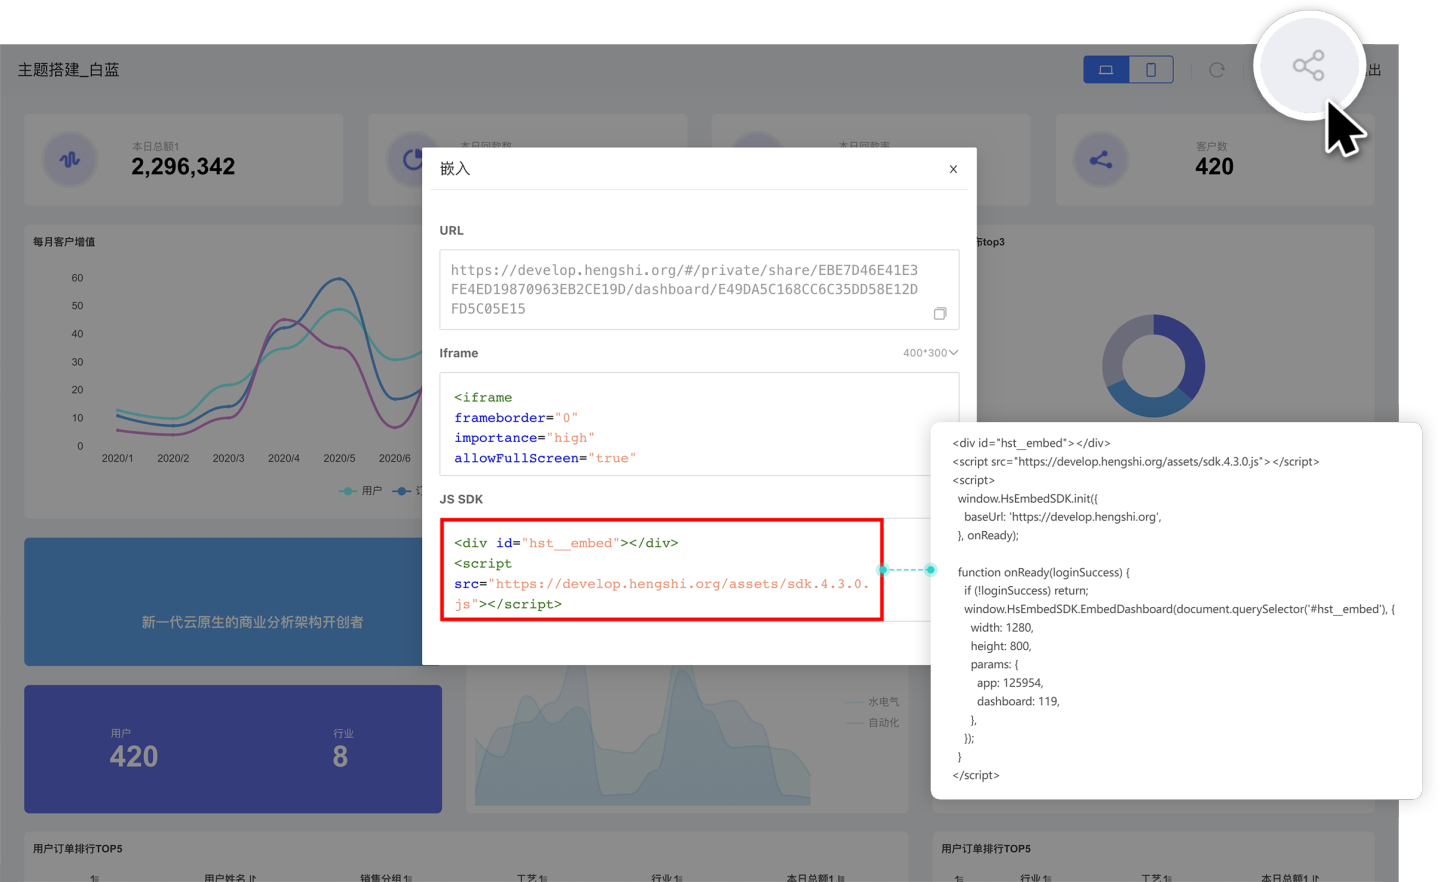
The JS SDK embedding example is as follows, which can be divided into three parts: importing the sdk.js file, initializing the sdk, and embedding.
<div id="hst__embed"></div>
<script src="https://develop.hengshi.org/assets/sdk.4.3.0.js"></script>
<script>
  window.HsEmbedSDK.init({
    baseUrl: 'https://develop.hengshi.org',
  }, onReady);

  function onReady(loginSuccess) {
    if (!loginSuccess) return;
    window.HsEmbedSDK.EmbedChart(document.querySelector('#hst__embed'), {
      width: "1573",
      height: "948",
      params: {
        app: 126457,
        dashboard: 5,
        chart: 37,
      },
    });
  }
</script>2
3
4
5
6
7
8
9
10
11
12
13
14
15
16
17
18
19
20
Reference the SDK's js file
Below is an example of referencing the SDK's js file, which differs for each environment. The purpose of the reference is to include the global variable HsEmbedSDK on the windows domain of the embedded page, preparing for subsequent drawing of embedded dashboards or charts.
<script src="https://develop.hengshi.org/assets/sdk.4.3.0.js"></script>Initialize SDK
Use the HsEmbedSDK.init function to initialize the SDK, as shown in the example below.
<script>
  window.HsEmbedSDK.init({
    baseUrl: 'https://develop.hengshi.org',
  }, onReady);

  function onReady(loginSuccess) {
    if (!loginSuccess) return;
    window.HsEmbedSDK.EmbedChart(document.querySelector('#hst__embed'), {
      width: "1573",
      height: "948",
      params: {
        app: 126457,
        dashboard: 5,
        chart: 37,
      },
    });
  }
</script>2
3
4
5
6
7
8
9
10
11
12
13
14
15
16
17
18
During initialization, two parameters need to be passed in.
- Parameter 1 is an object with the following structure. The
baseUrlis the address where the system is deployed. The examplehttps://develop.hengshi.orgis a top-level address, but it also supports second-level addresses.noAuthindicates whether authentication is enabled. The default istrue, meaning authentication is enabled. When set tofalse, it means skipping authentication.
interface SDKConfig {
    baseUrl: string;
    noAuth?: boolean;
}2
3
4
- Parameter 2 is the callback function, onReady in the example is the callback function.
Tip
If using jwt authentication, noAuth needs to be configured as true, and the jwt parameter should be passed in the embedded dashboard or chart. Example as follows:
  window.HsEmbedSDK.init({
    noAuth: true,
    baseUrl: 'https://develop.hengshi.org',
  }, onReady);
  function onReady(loginSuccess) {
    if (!loginSuccess) return;
    window.HsEmbedSDK.EmbedDashboard(document.querySelector('#hst__embed'), {
      width: window.innerWidth,
      height: window.innerHeight,
      params: {
        app: 125396,
        dashboard: 1,
      },
      location: {
        query: {
          activeAuth: 'jwt-param',
          jwtParam: 'c3MiOiLlj5HooYzogIU6emhlbmdjaHVueGkiLCJzdWIiOiJtYXJzaGFsbCJ9.cCX2yMcMpJYnE4mU7xDewD22uCyj-o'
        },
      },
    });
}2
3
4
5
6
7
8
9
10
11
12
13
14
15
16
17
18
19
20
21
Embed Dashboard/Chart
After referencing the SDK's js file and initializing the SDK, start embedding the dashboards and charts of the application.
Tip
When embedding multiple dashboards and charts, you only need to reference the SDK's js file and initialize the SDK for the first embedding. When embedding apps and dashboards, only refresh, full screen, export, etc., buttons are displayed, and PC-side function buttons are not displayed. When embedding charts, you need to first open the chart, then click the embed button to get the link content. Filters are not carried over during embedding. The JS SDK initially supports embedding dashboards and charts in analysis apps, with support for embedding scope to be expanded in subsequent versions.
Embed Dashboard
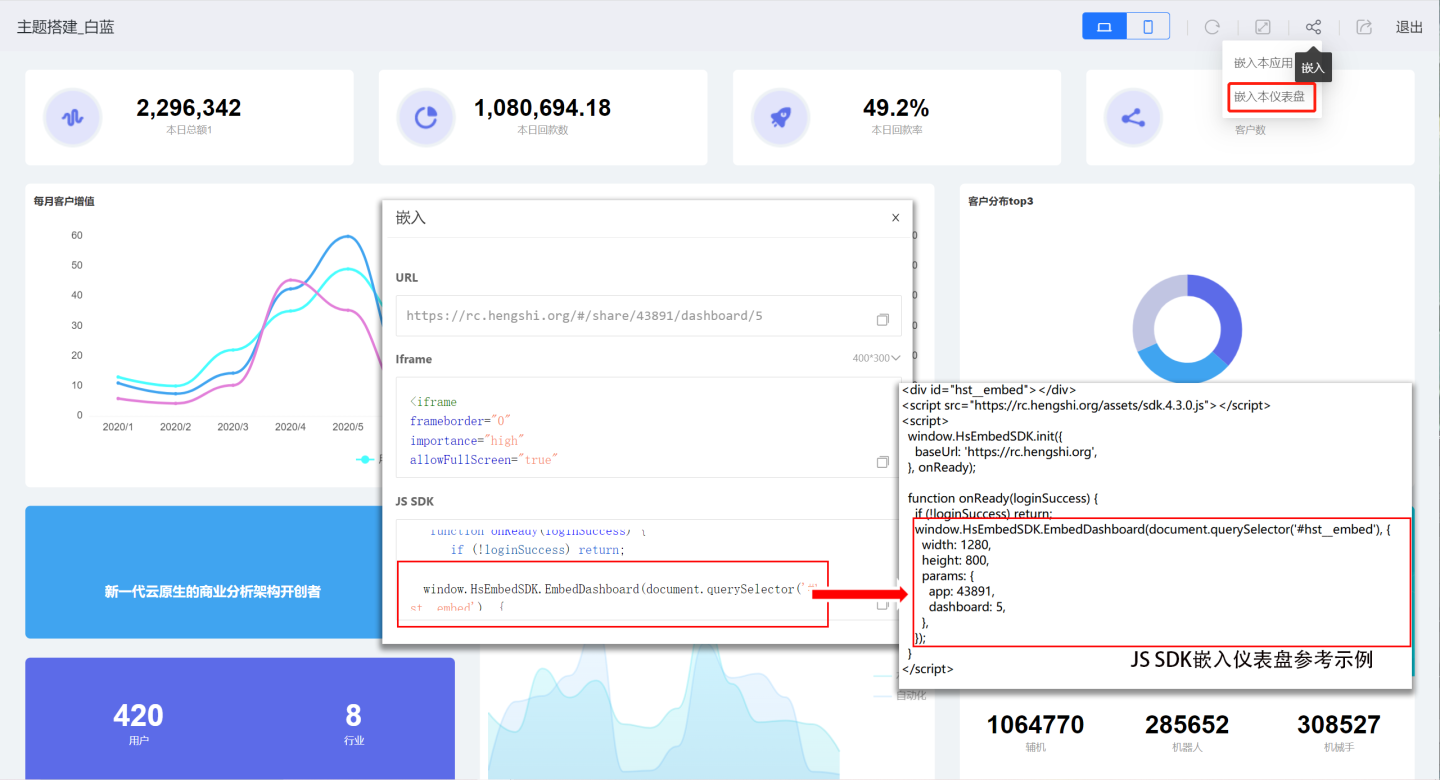
Use the HsEmbedSDK.EmbedDashboard(Element, DashboardOptions) function to embed a dashboard, which requires passing two parameters: Element and DashboardOptions. Click the embed icon in the dashboard, select Embed this dashboard, and view the embed example.
The Element is an embedded DOM element, which can be obtained from the embedded example. The Element passed in the example is
document.querySelector('#hst__embed').DashboardOptions are parameters related to the dashboard, with the following structure:
- useshadowDom: Use shadow DOM for style isolation, boolean type, default is true, this item is optional.
- width: The width of the embedded dashboard, numeric type, unit is px, this item is required.
- height: The height of the embedded dashboard, numeric type, unit is px, this item is required.
- params: The application ID and dashboard ID where the dashboard is located, which can be obtained from the embedded example, this item is required.
- location: When you need to add filter parameters to the URL, you can pass parameters through location.query, this item is optional.
interface Dashboardoptions {
  useshadowDom?: boolean;
  width: number;
  height:number;
  params:{
    app: number | string;
    dashboard: number | string;
  };
  location?:{
    query?: string | Record<string, any>;
  },
}2
3
4
5
6
7
8
9
10
11
12
Embed Chart
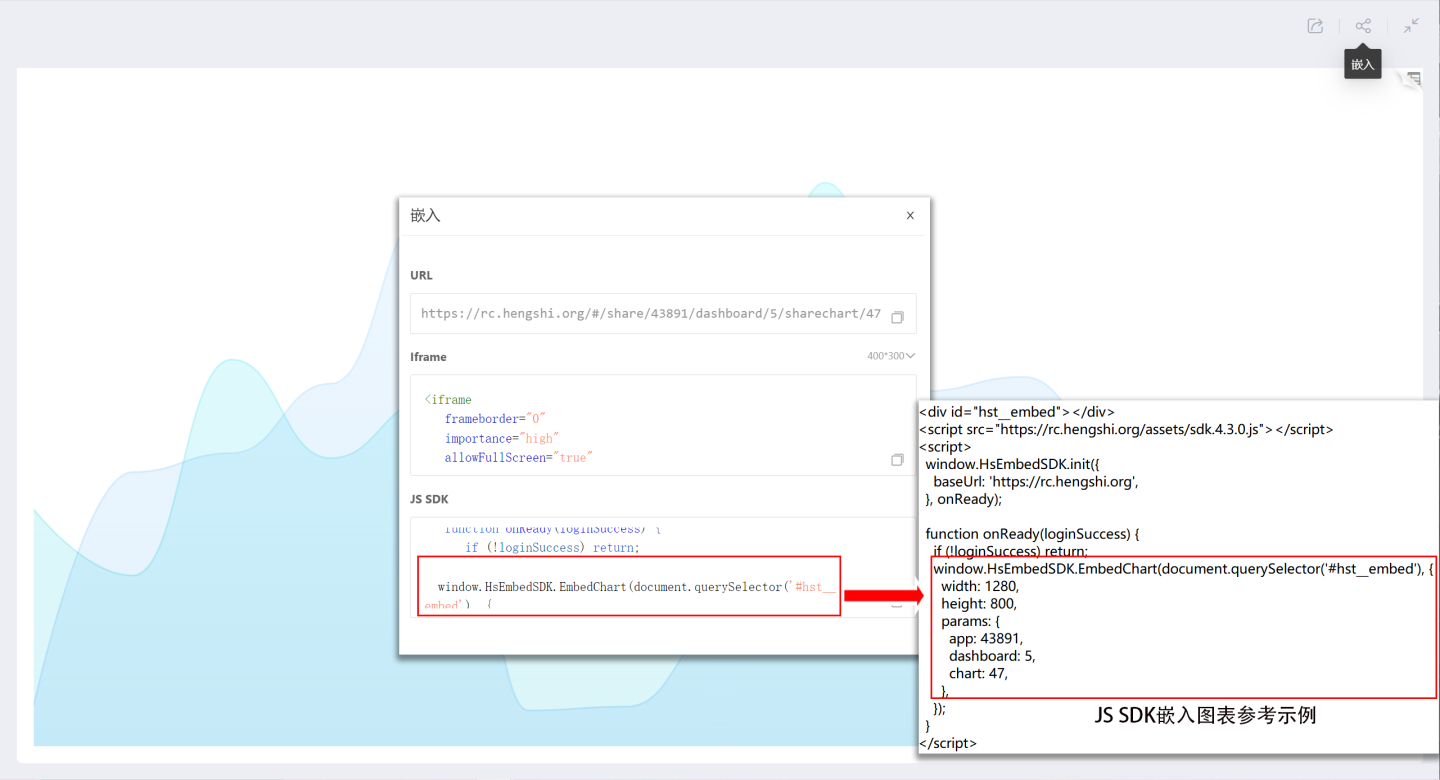
Use the HsEmbedSDK.EmbedChart(Element, ChartOptions) function to embed a chart, which requires passing two parameters: Element and ChartOptions. Open the chart, click the embed icon, and view the chart embedding reference example.
The Element is an embedded DOM element, which can be obtained from the embedded example. The Element passed in the example is
document.querySelector('#hst__embed').Chartoptions are chart-related parameters with the following structure:
- useshadowDom: Use shadow DOM for style isolation, boolean type, default is true, this item is optional.
- width: The width of the chart after embedding, numeric type, unit is px, this item is required.
- height: The height of the chart after embedding, numeric type, unit is px, this item is required.
- params: The application ID, dashboard ID, and chart ID where the chart is located, which can be obtained from the embedded reference example provided by the system, this item is required.
- location: When you need to add filter parameters to the URL, you can pass the parameters through location.query, this item is optional.
tsinterface Chartoptions{ useShadowDom?: boolean; width: number; heiqht:number; params:{ app: number | string; dashboard: number | string; chart: number | string; }; location?:{ query?:string | Record<string, any>; }, }1
2
3
4
5
6
7
8
9
10
11
12
13
Clear Link Filter
The JS SDK supports using the function HsEmbedSDK.clearFilters() to clear the linkage filters between charts. After calling this function, the linkage filters shown in the figure will be cleared, and no linkage will occur between the charts. 