Metric Management
Datasets use metrics. Fields are processed from detailed data, calculating new fields from the raw table's row-by-row data.
Fields are suitable for various segmentation scenarios, such as age groups, consumption level segments. We can achieve this by creating new fields.
Metrics are processed from grouped data. Metrics themselves do not have grouping significance; their storage form is not specific calculated values but aggregation calculation expressions. Metrics only take effect when creating charts, dynamically aggregating based on selected dimensions.
Metrics are flexible to use, applicable to different scenarios based on selected dimensions. We can use metrics when calculating per capita, daily average, year-over-year, and month-over-month comparisons.
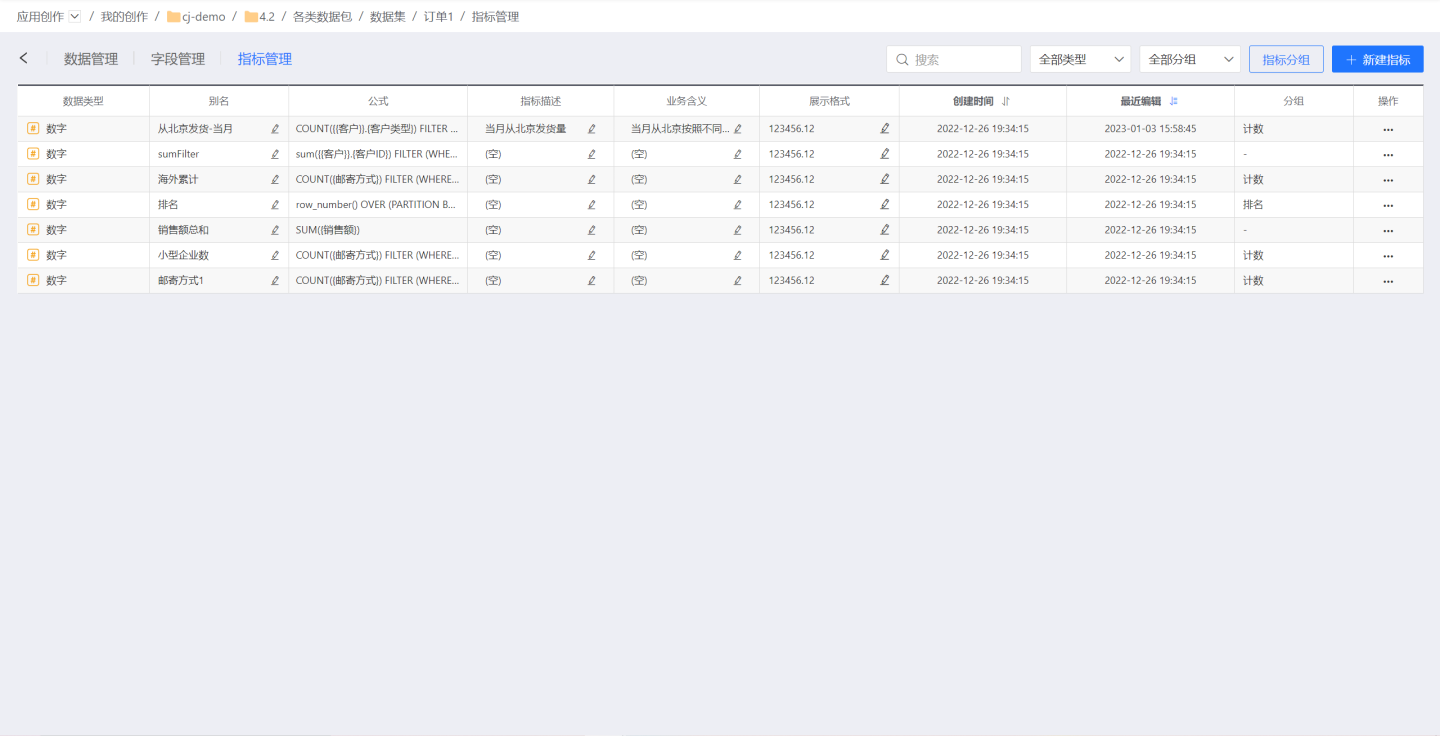
Create New Metric
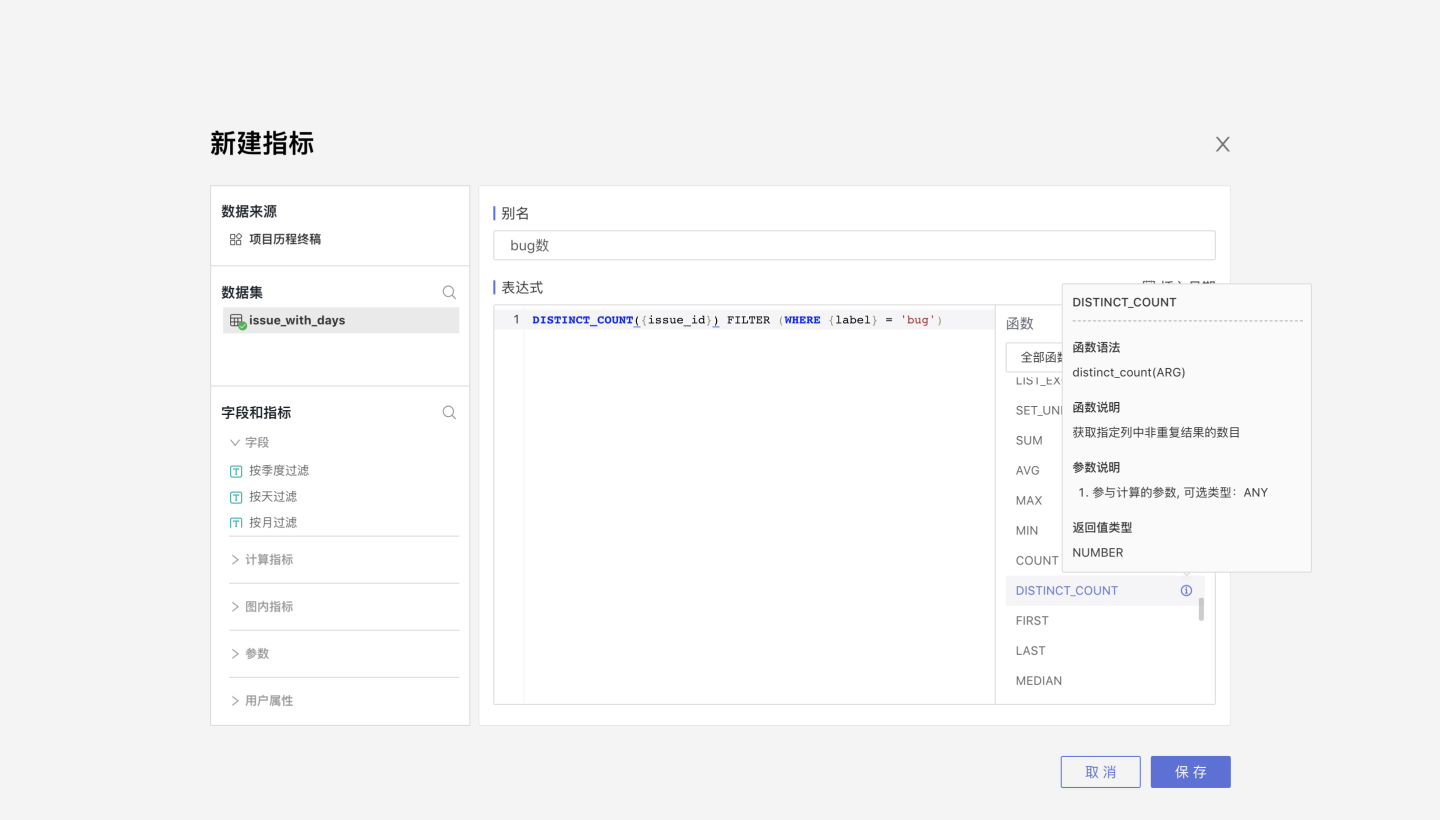
Click Create Metric in the upper right corner to open the new metric page.
Enter the metric alias, input the aggregation expression, and click Save to successfully create the metric.
Modify Basic Information
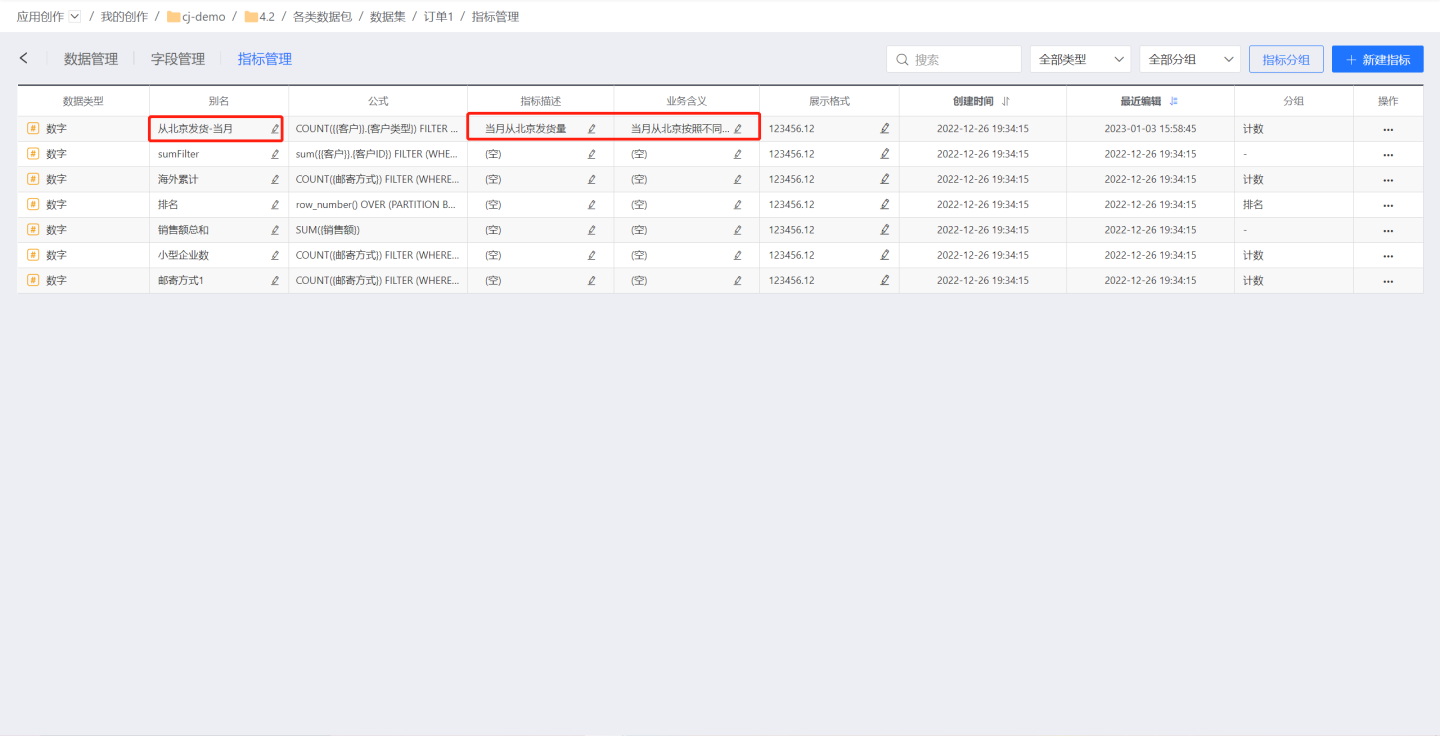
On the metric management page, you can modify the metric alias, metric description, business meaning, and other basic display information.
Alias: Metric name. Metric Description: Instructions for using the metric. Business Meaning: The business meaning of the metric.
Edit Metric
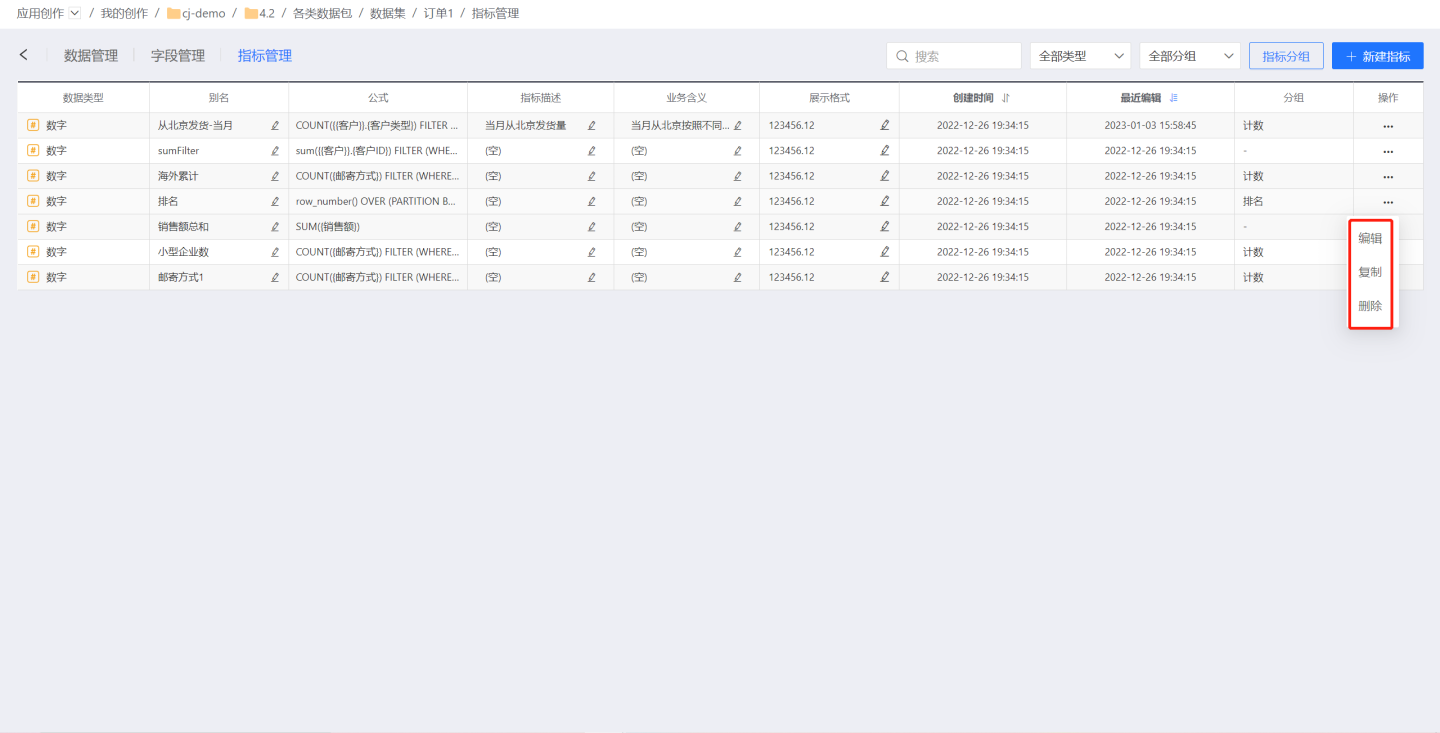
On the metric list page, click the edit icon of a metric to open the edit metric page. The edit metric page is identical to the new metric page.
Delete Metric
Select a metric, click the delete icon, and confirm to delete the metric.
If the metric has been referenced, a prompt will indicate that the metric has been referenced. You can choose to force delete or cancel the operation.
Copy Metric
Click the copy icon in the operations to duplicate the current metric into a new one.
Display Format
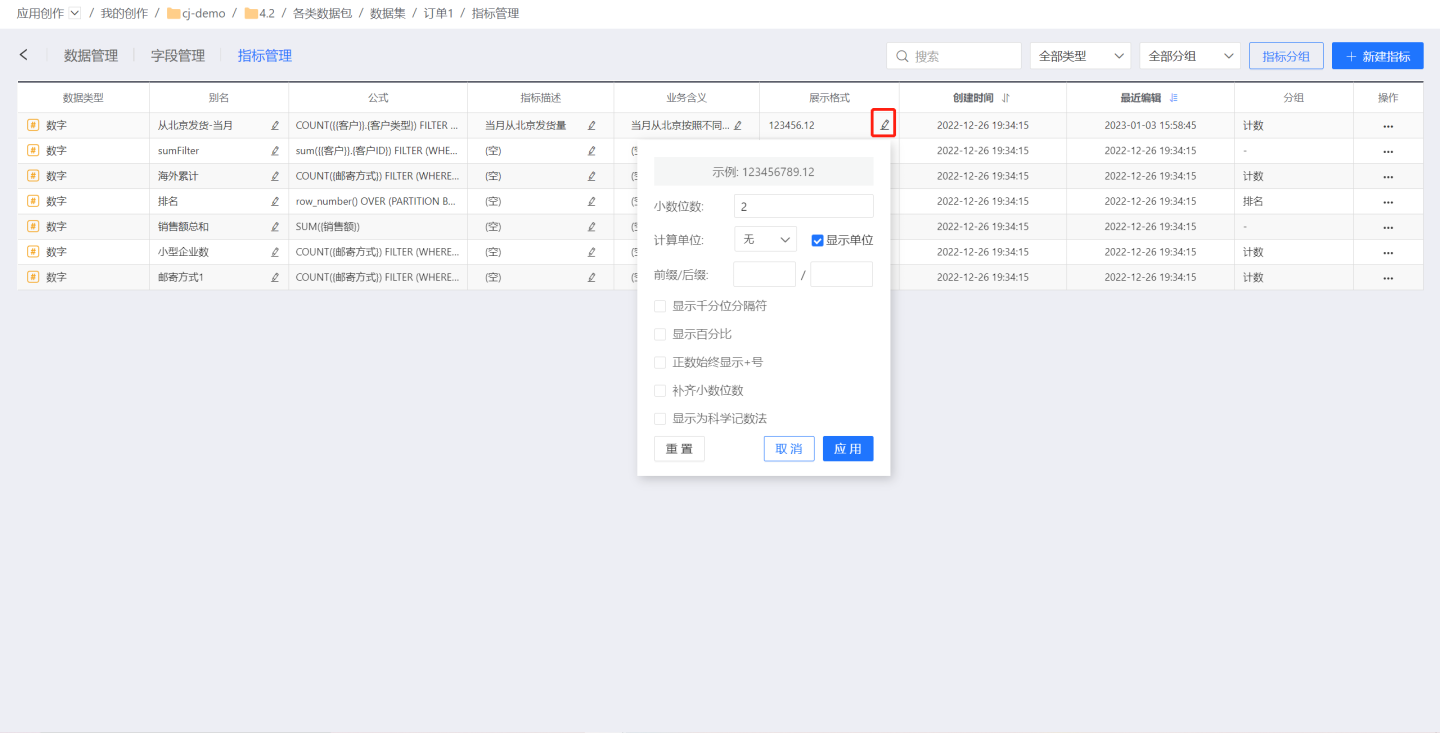
You can set the display format for numeric metrics, which will automatically apply this format when using the metric in charts.
Metric Grouping
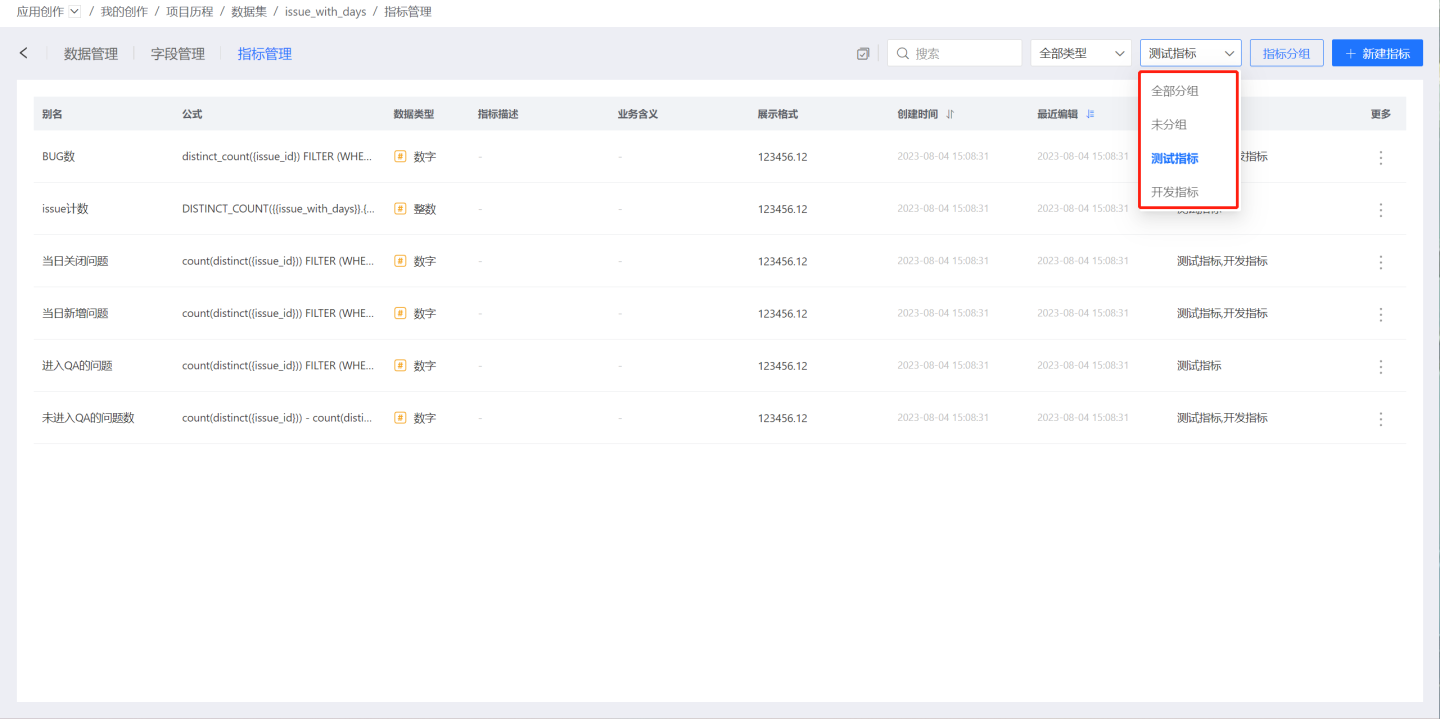
Similar to field grouping, metrics also support grouping. Grouping metrics in the current dataset allows for quick location of needed metrics when there are many metrics.
Click Metric Grouping, which will pop up the Metric Grouping window. 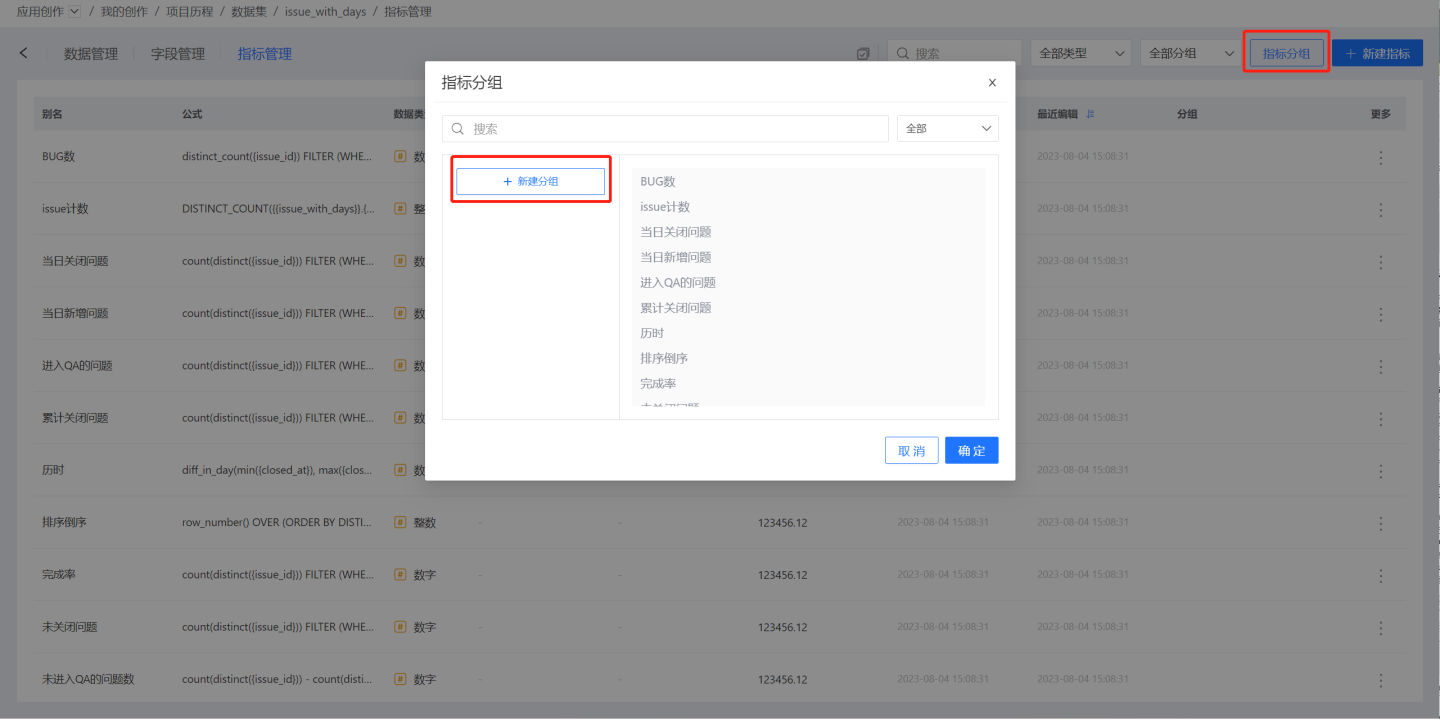
Click Create Group, input the group name and press Enter to create a new metric group. Select the metric group, add metrics to the group on the right, and click the OK button to successfully group the metrics. 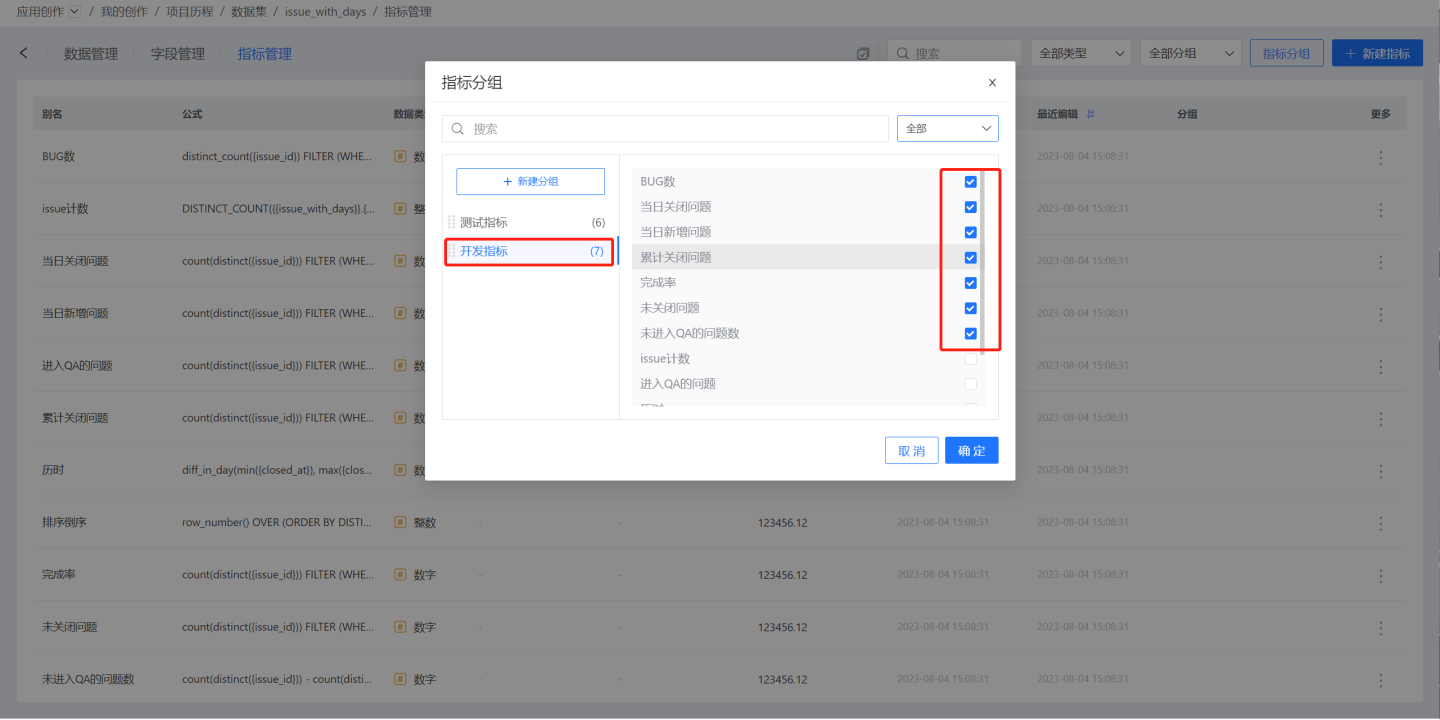
On the metric management page, you can see the grouping information for each metric. A metric may be assigned to multiple groups, marked with multiple group tags. 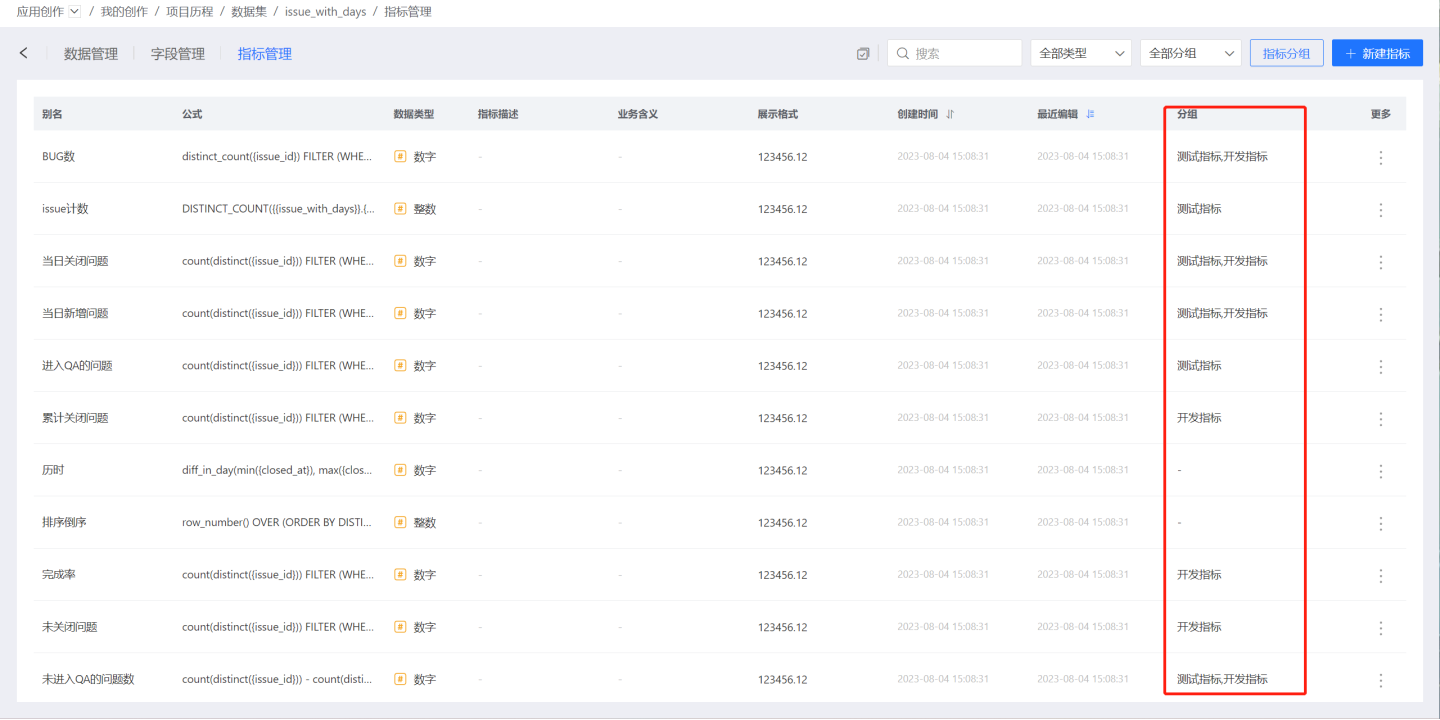
When using metrics, you can quickly find them through grouping.
Tip
- When copying a metric, the new metric defaults to the original metric's group.
- Deleting a dataset also requires deleting its metric grouping settings.
- When creating a dataset copy, the metric grouping settings must be retained.
- When replacing a dataset, the metric grouping settings must be retained.
Use Metrics
In charts, you can drag metrics into measures or filters but not into dimensions. When a metric is dragged into a measure, detailed information about the metric will be displayed in the chart measure details. 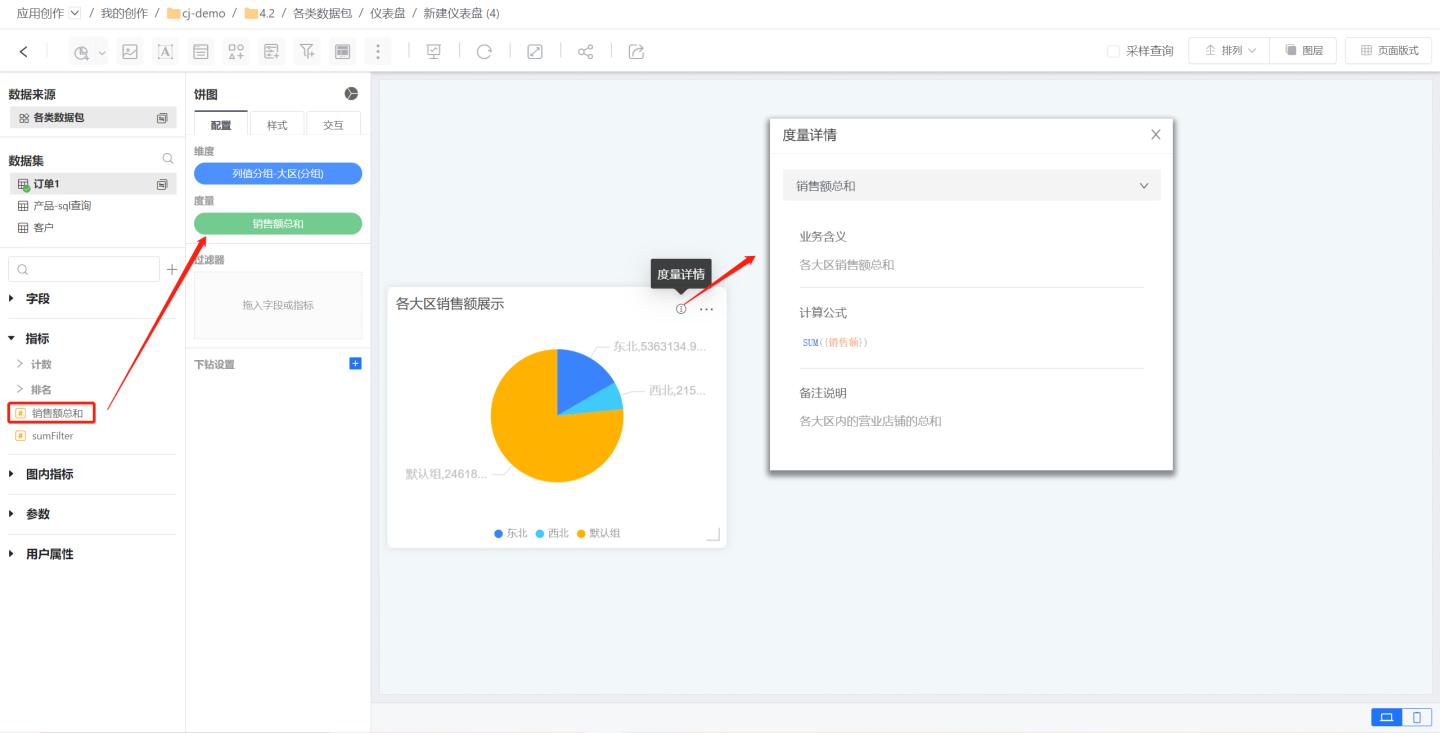
Batch Operations
Metric management supports batch operations, allowing for batch modification of metric display formats and deletion. For batch operation usage, please refer to the batch operation guide in field management.