Dashboard Overview
Dashboards are the ultimate form of data analysis presentation, representing the final stage of data analysis. A data analysis scenario (App) can be presented using one or multiple dashboards, which are interconnected in terms of business logic.
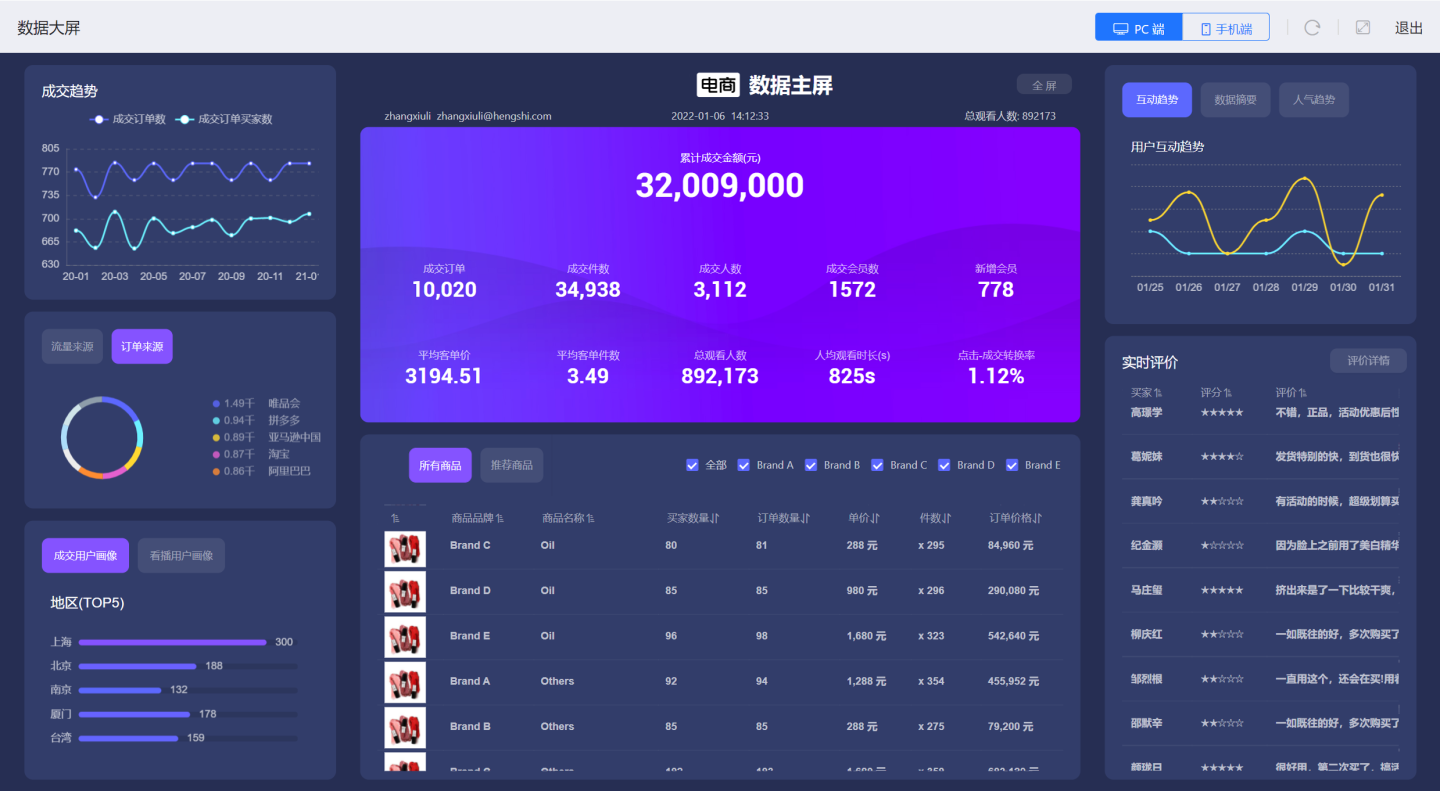
This article introduces the composition, display terminals, and common operations of dashboards, providing a basic understanding of dashboards through this article.
Dashboard Composition
A dashboard consists of a Canvas and Controls. As shown in the figure, the red area is the canvas, which is arranged with various controls to display data analysis information. 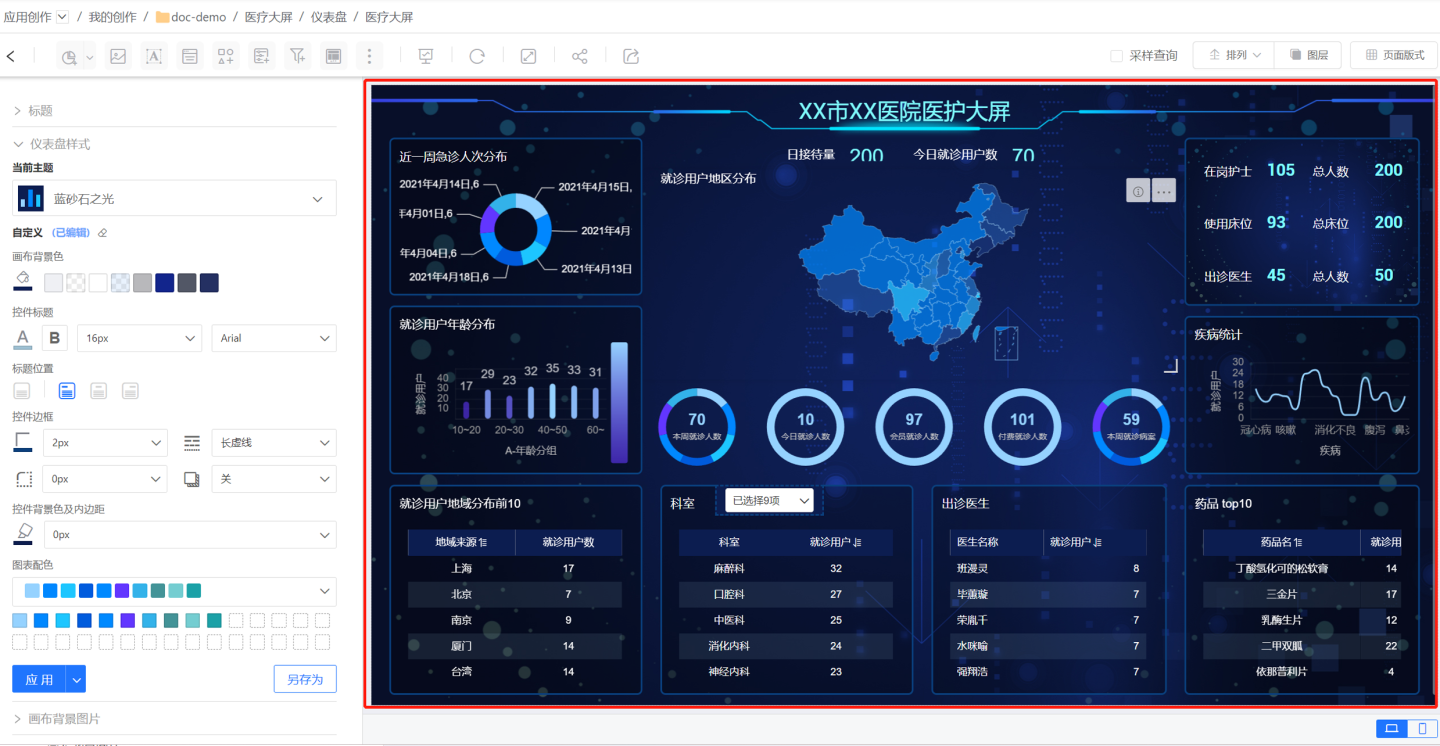
Dashboard Controls
There are many types of dashboard controls, each carrying different data information. Generally, they can be divided into the following three types.
- Chart controls used to display data, such as Histogram, Ring Chart, Pie Chart, Table, Map, Custom Charts.
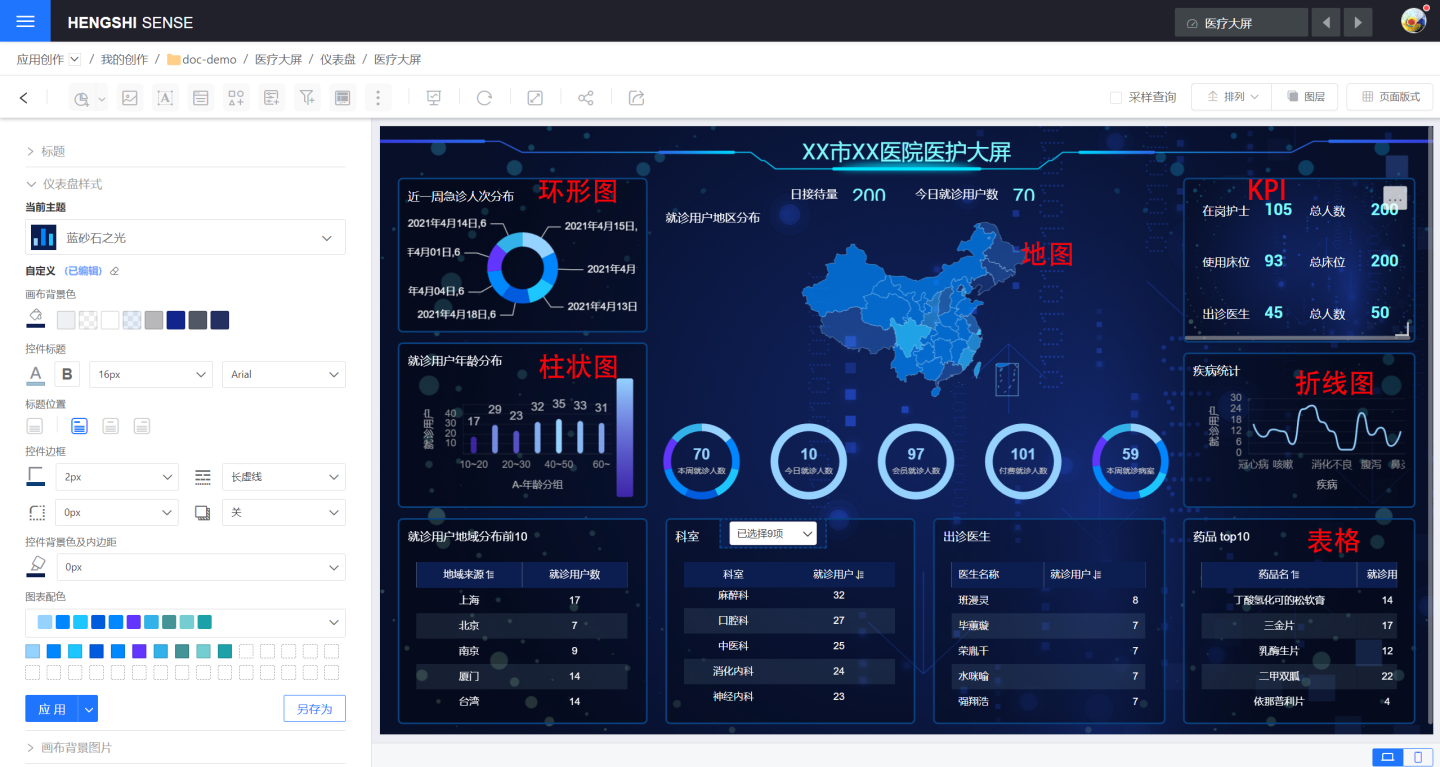
- Controls for display purposes, such as images, rich text, Shape Controls, web page controls, etc.
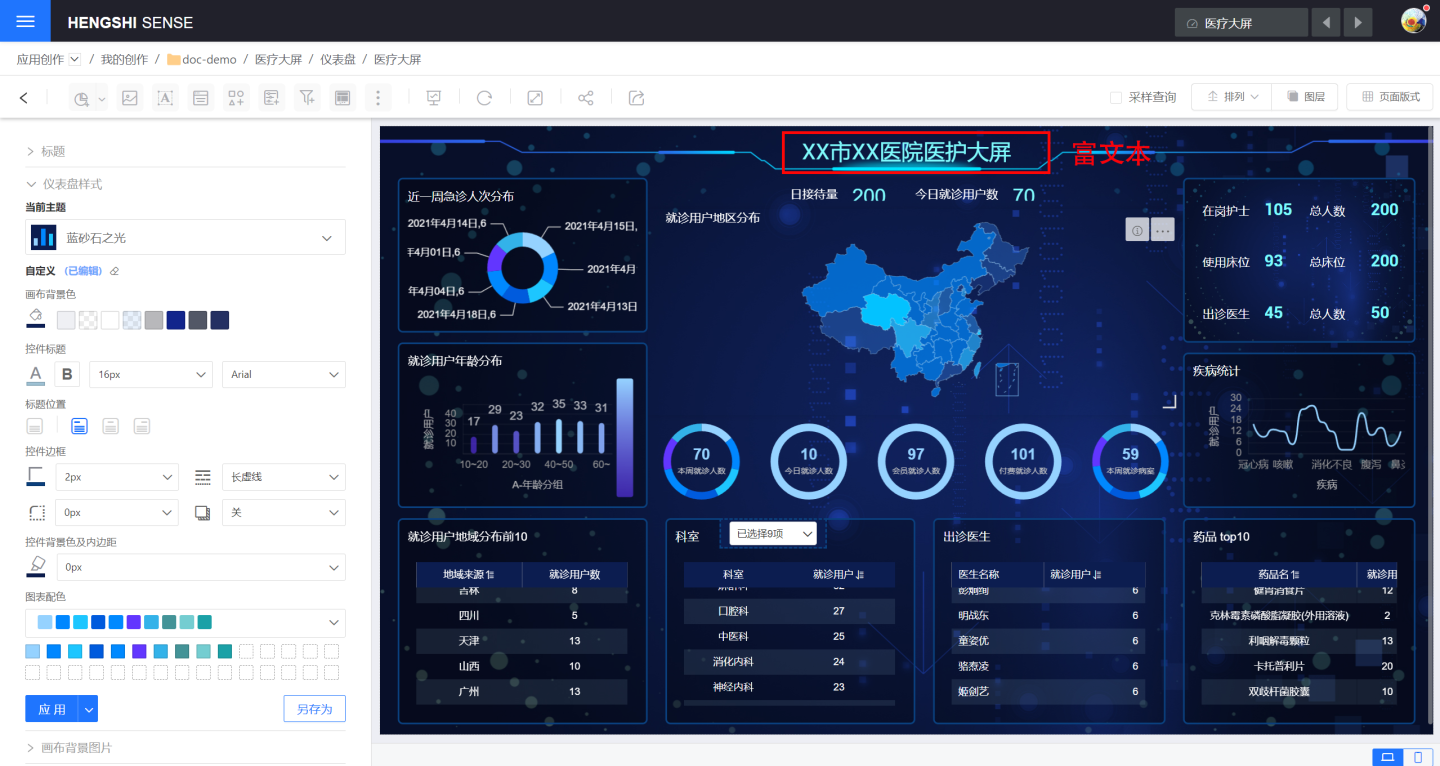
- Functional Controls: Container, Filter, Parameter Control, Button.
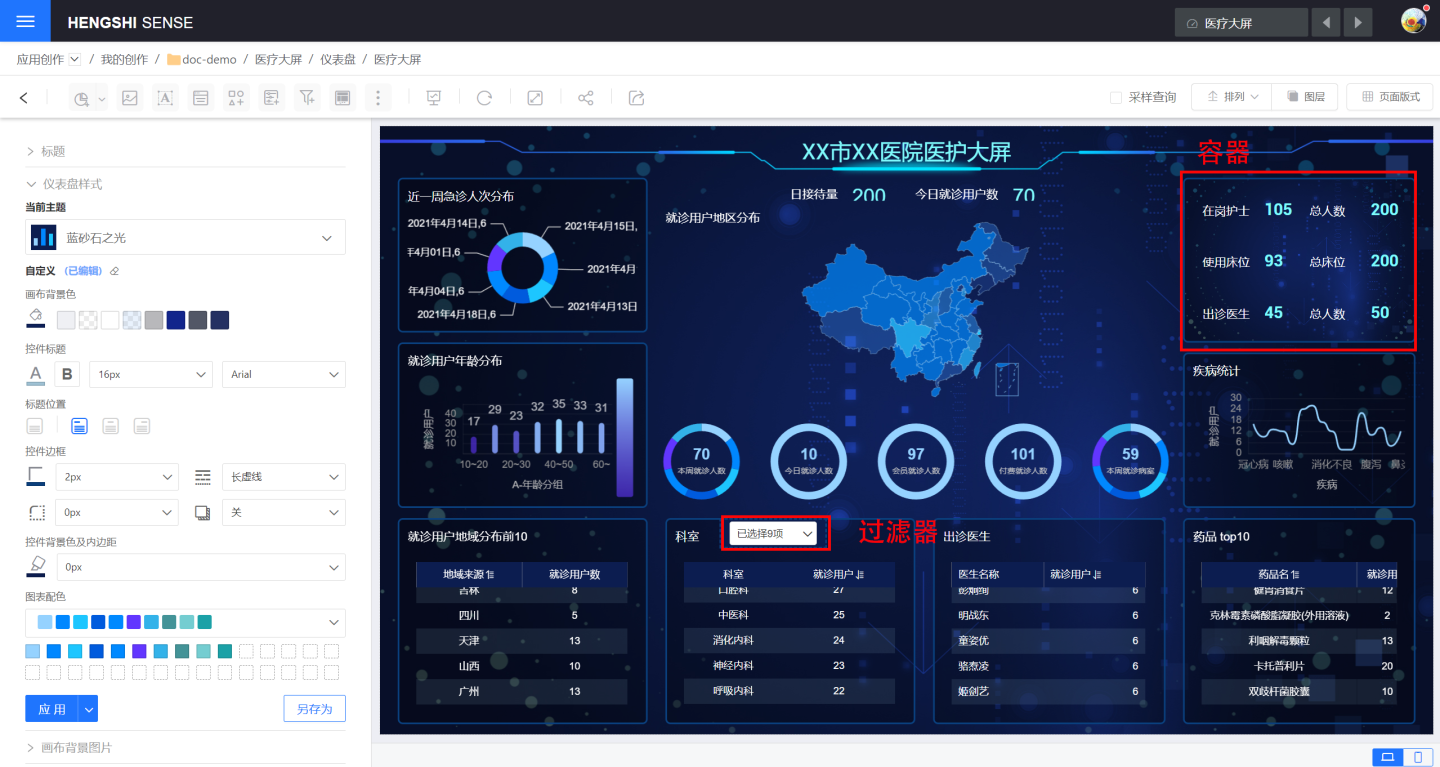
All controls follow Control Settings.
Dashboard Canvas
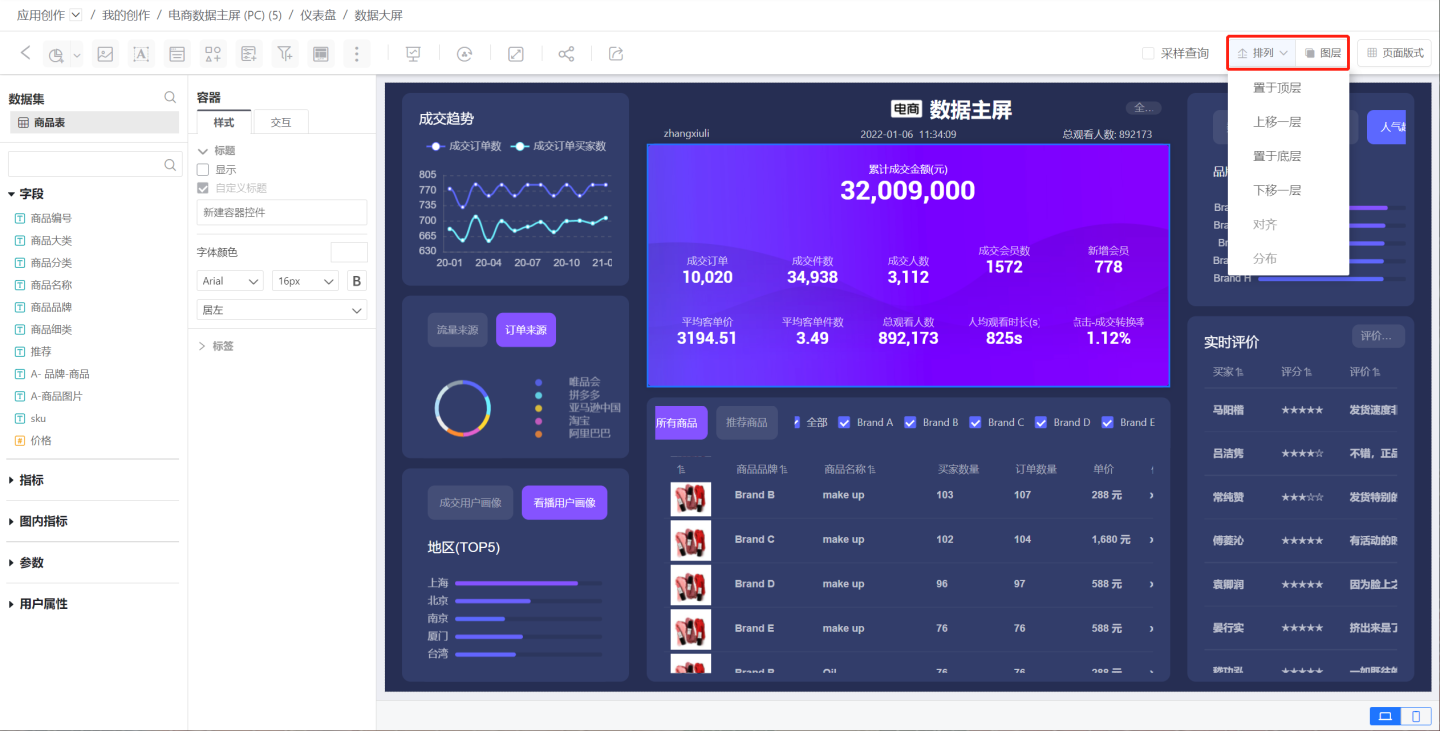
The main function of the dashboard canvas is to layout controls, set the canvas style, and better showcase the dashboard. In the canvas, you can adjust the arrangement of controls through layer arrangement.
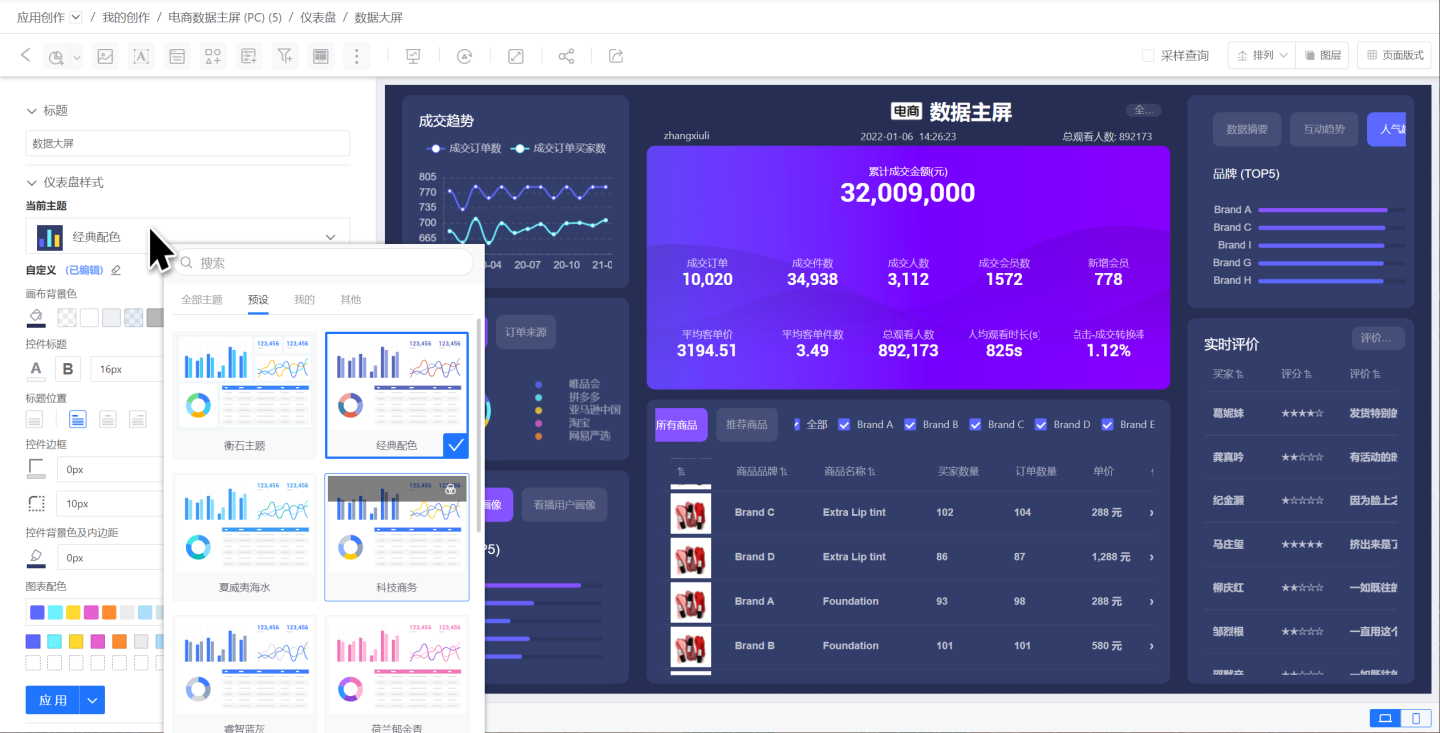
Canvas style, also known as dashboard style, allows users to set different Theme Styles to present the dashboard in various styles.
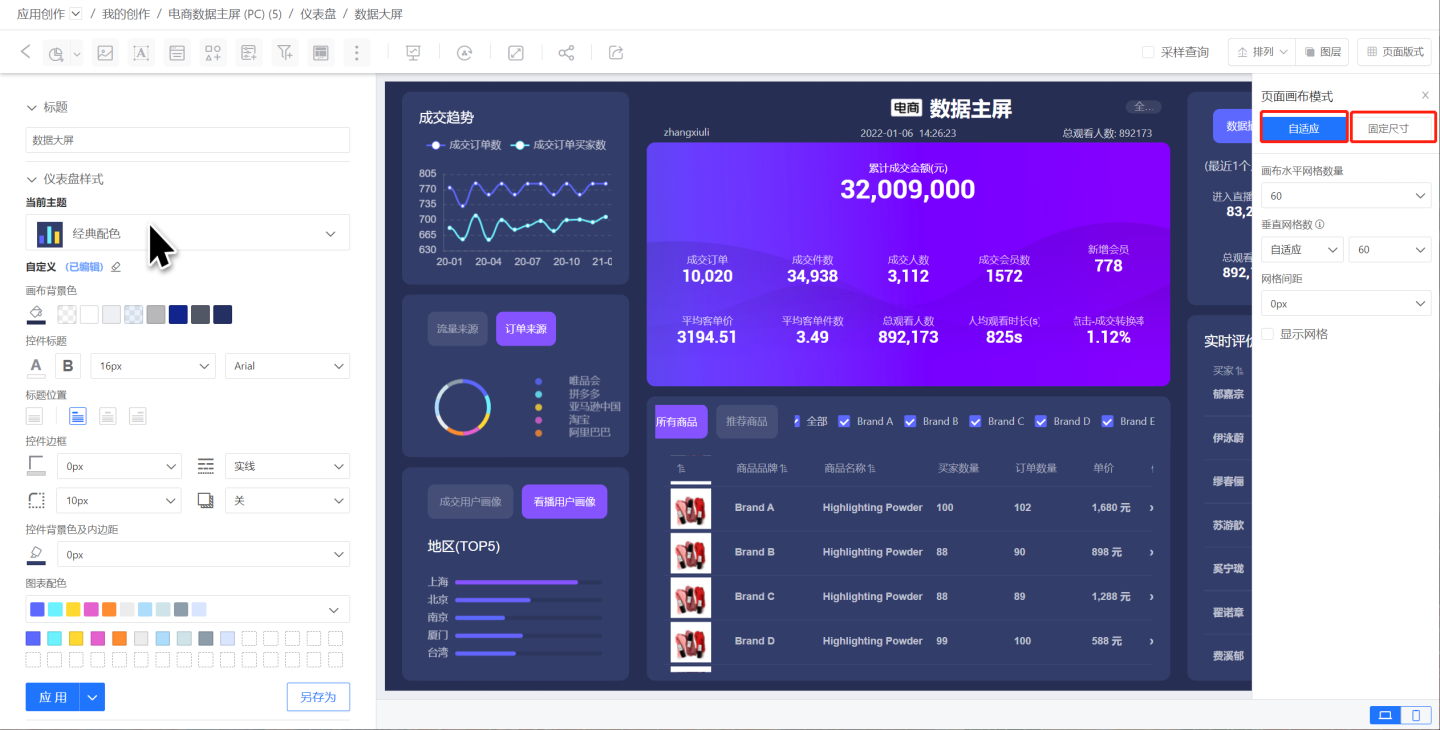
The canvas supports two types of page layouts: adaptive and fixed size, catering to different display needs of various pages.
Dashboard Display Terminal
Dashboards support multi-terminal display on PC, mobile, and large screens, and also support embedded scenarios. Individual charts within dashboards can be displayed in embedded scenarios.
Common Operations in Dashboards
Here is the main interface of the dashboard. The main interface lists all the dashboards in the app, including those created by yourself and those created by collaborative users after collaboration.
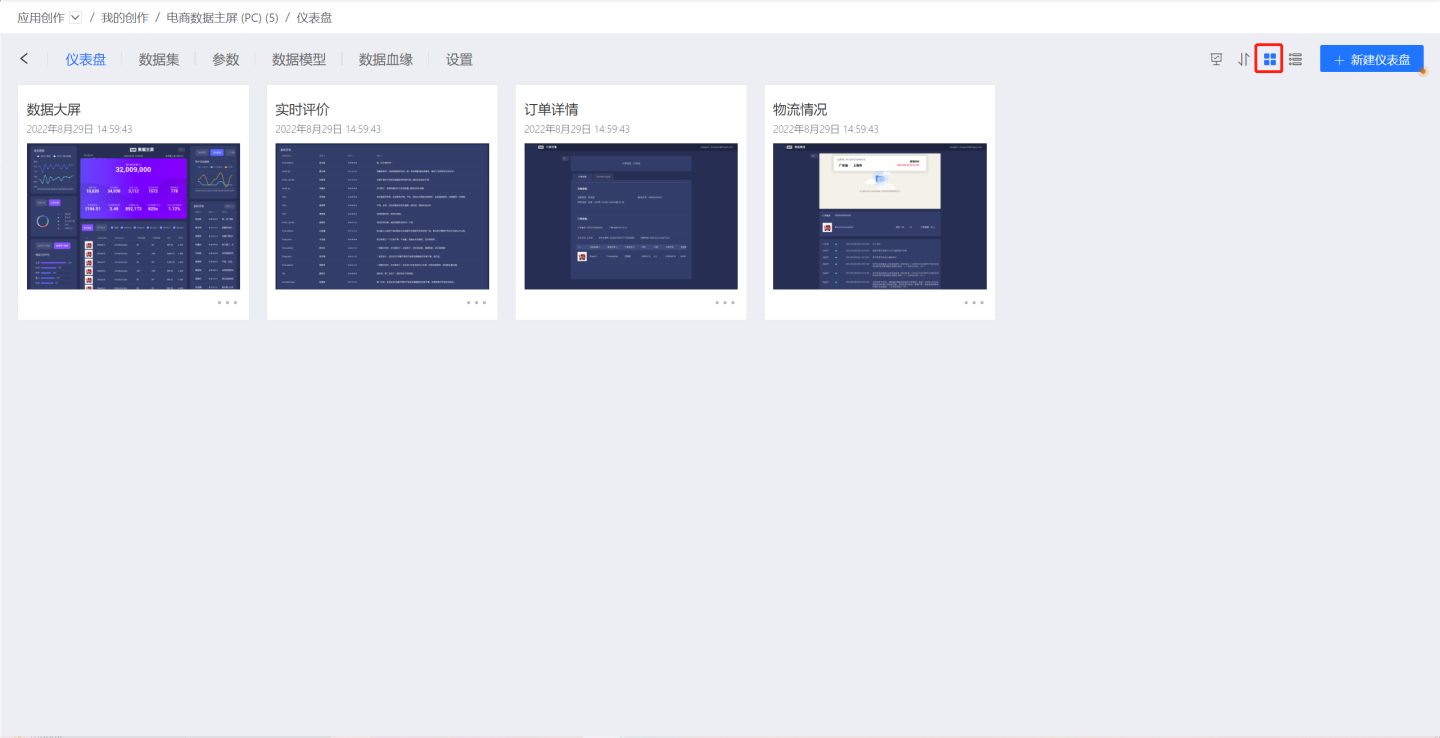
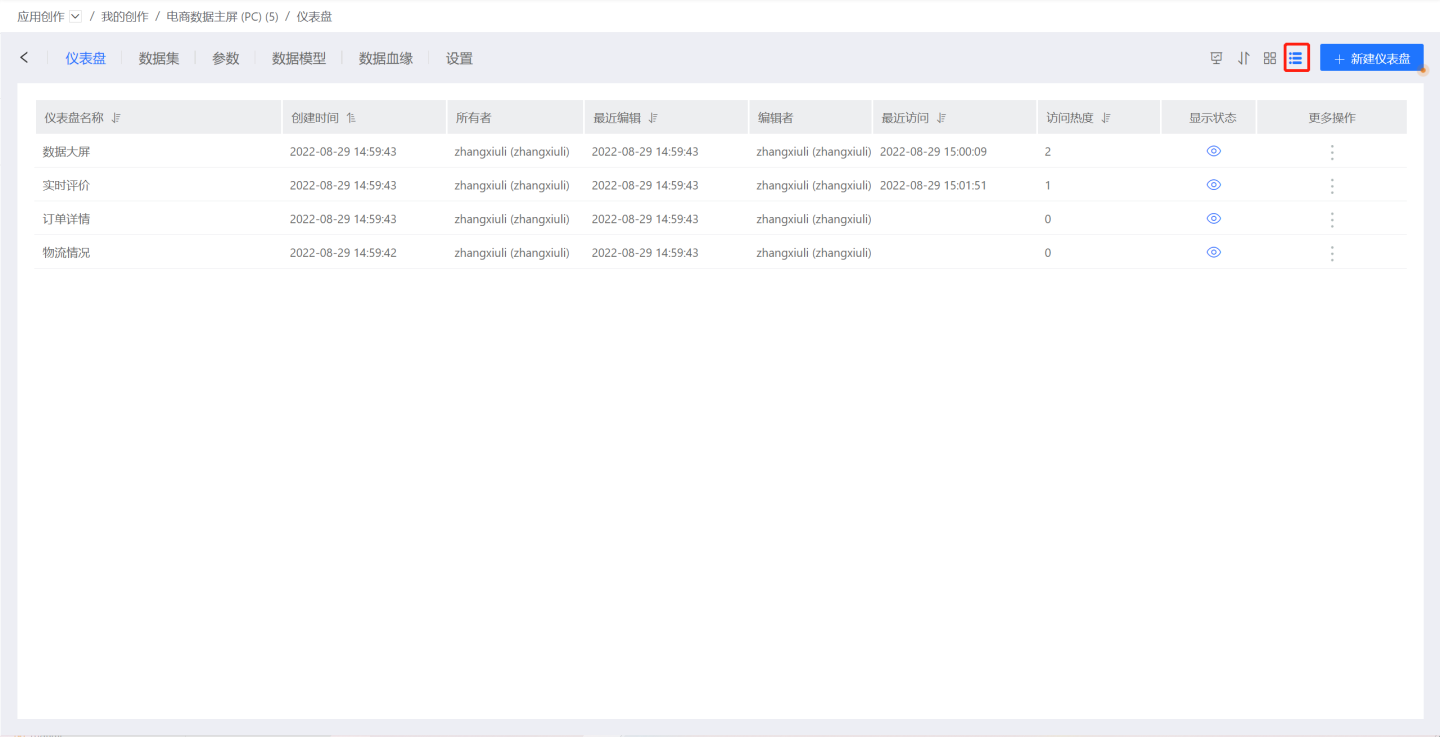
The default display is a card-style list. Clicking the list icon in the image will switch to the list view. You can click the sorting icon in the table header field to sort in ascending/descending order.
Click the three-dot menu in the lower right corner of the dashboard to pop up the operation menu. The dashboard supports the following operations.
- Rename
- Delete
- Create a Copy
- Copy to
- Manual Sort
- Hide
Rename Dashboard
Click the Rename button to pop up a window, enter the dashboard name, and click OK to complete the renaming of the dashboard.
Delete Dashboard
You can delete the dashboard. When deleting the dashboard, the charts within it will also be deleted.
Create a Copy
Click the Create Copy button to complete the duplication of the dashboard, including the charts within it. The duplicated dashboard is displayed at the end of the current app.
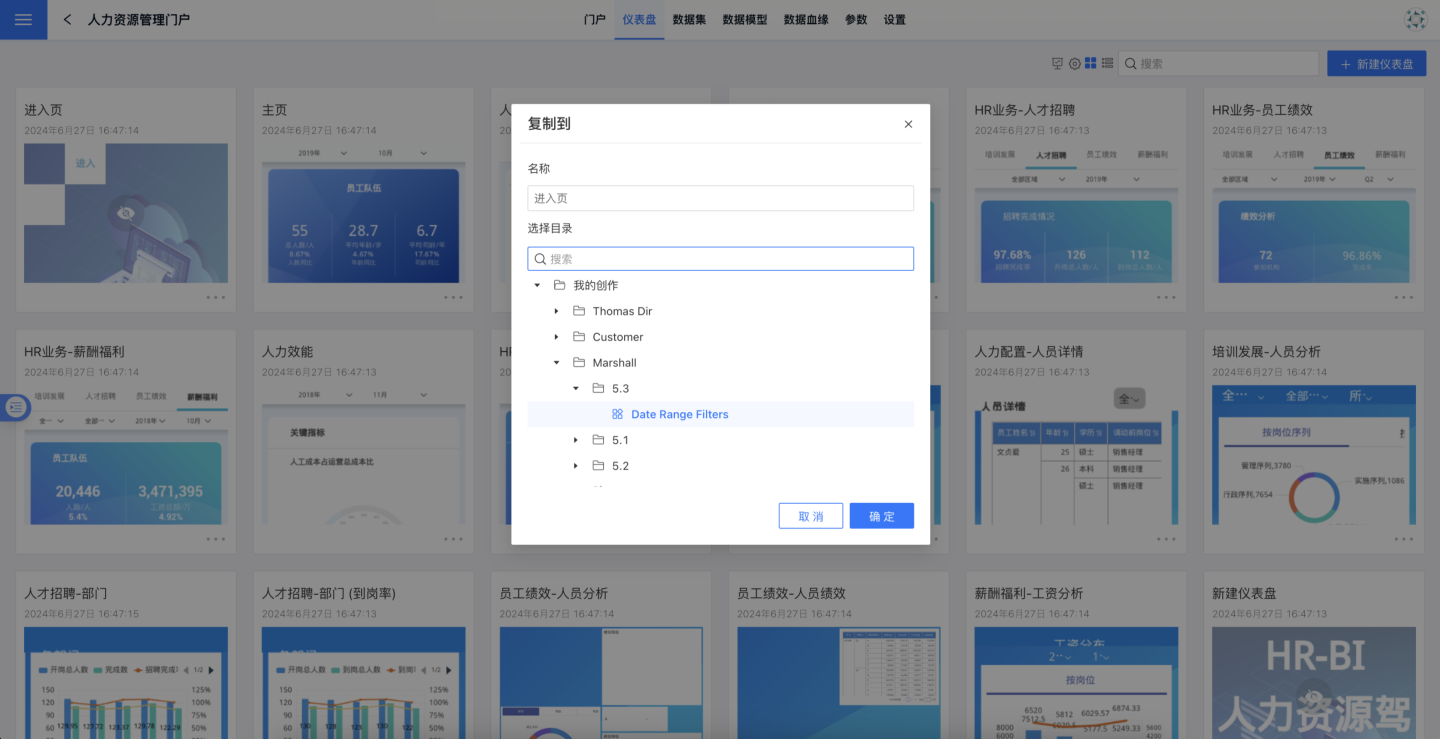
Copy to
An app serves as an independent analysis scenario, encompassing numerous datasets and dashboards. Dashboards rely on datasets, so copying dashboards between different apps requires considering the following two scenarios:
- The data for the dashboard comes from the dataset, so simply copy the required dashboard to the target app.
- If the data for the dashboard is sourced from within the app, then after copying, you need to perform data replacement operations on the relevant charts.
Manually Sort Dashboard
The system defaults to sorting by the creation order of dashboards, with the most recently created dashboards placed at the end. The sorting button in the upper right corner of the dashboard allows for custom sorting of dashboards, as shown in the figure.
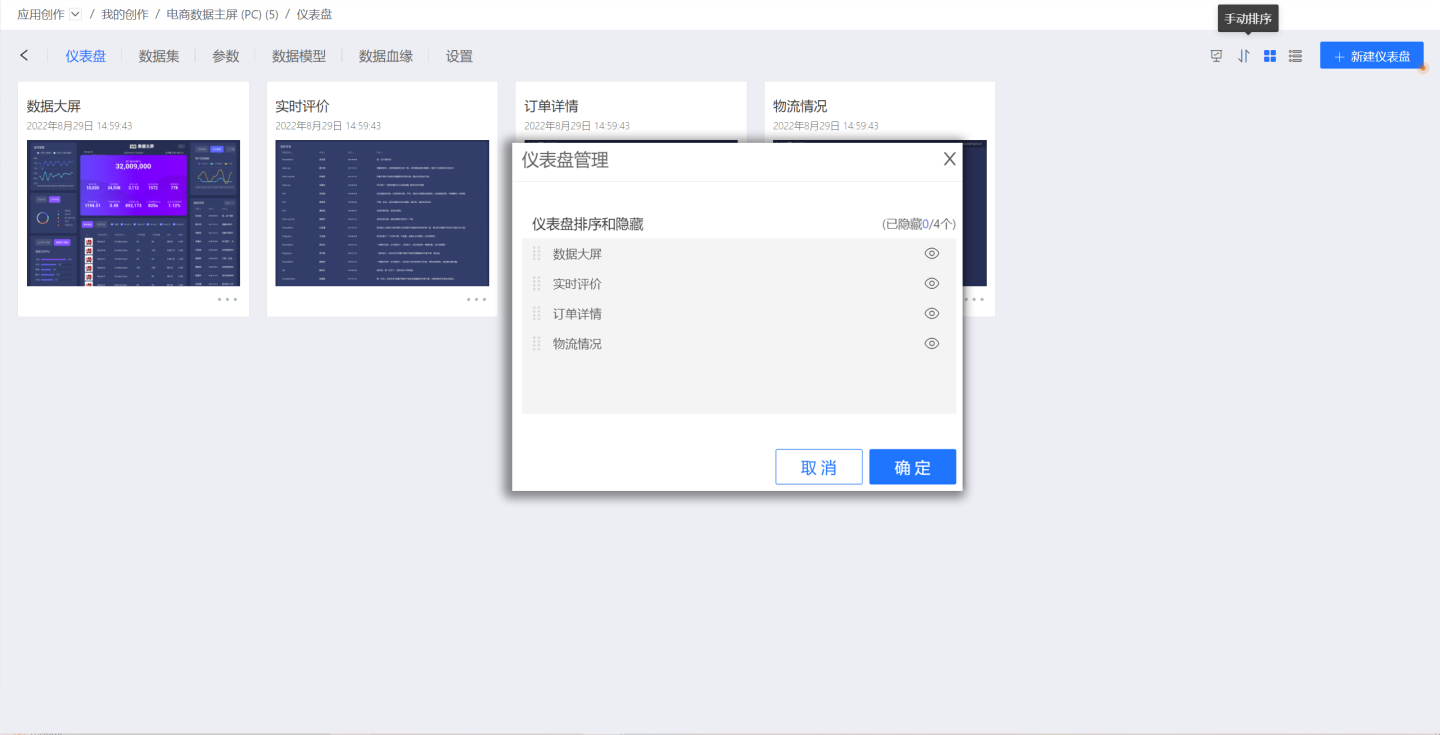
Drag to complete custom sorting.
Hide Dashboard
When the dashboard does not need to be displayed, it can be hidden. The hidden dashboard is shown as follows.
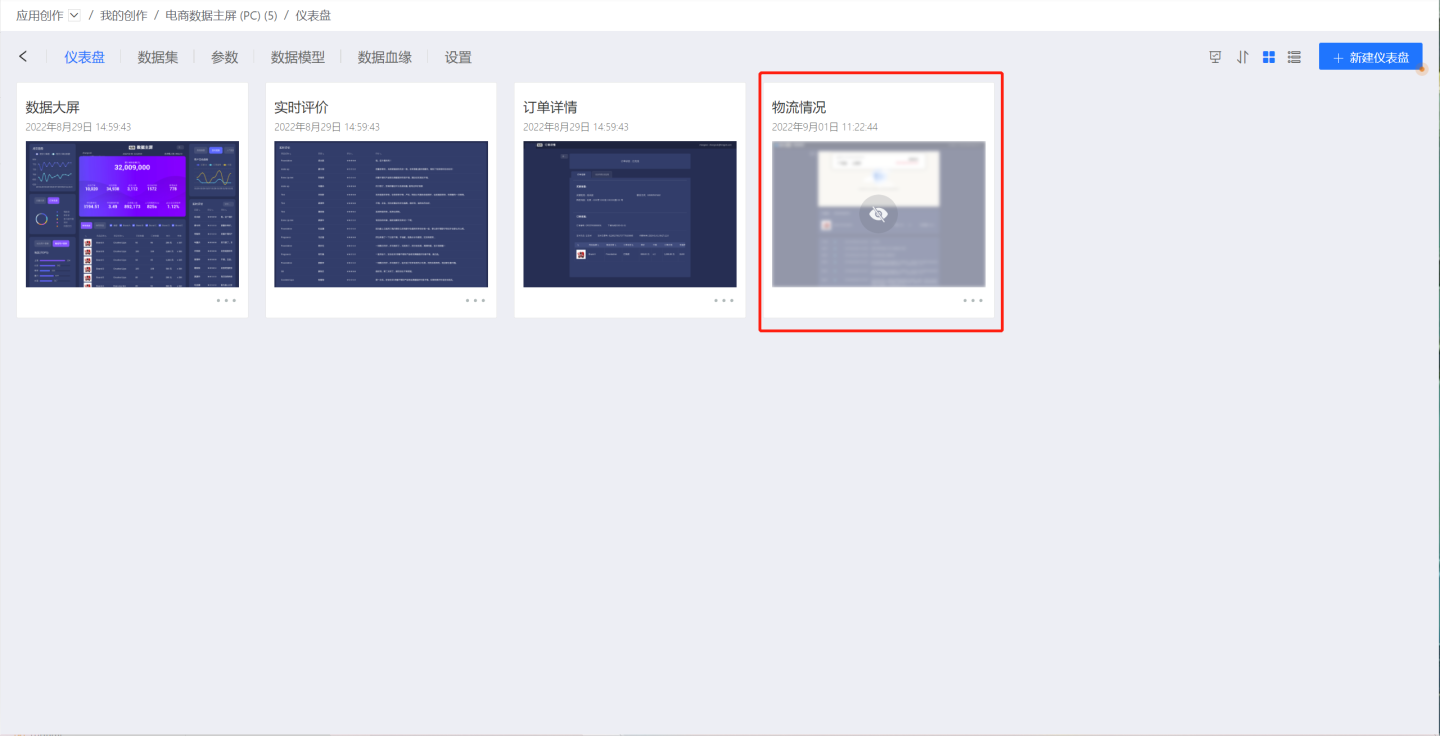
When the dashboard is hidden, the Hide option in the three-dot menu changes to Show. Clicking Show will restore the dashboard's visibility.
Dashboard Permissions Management
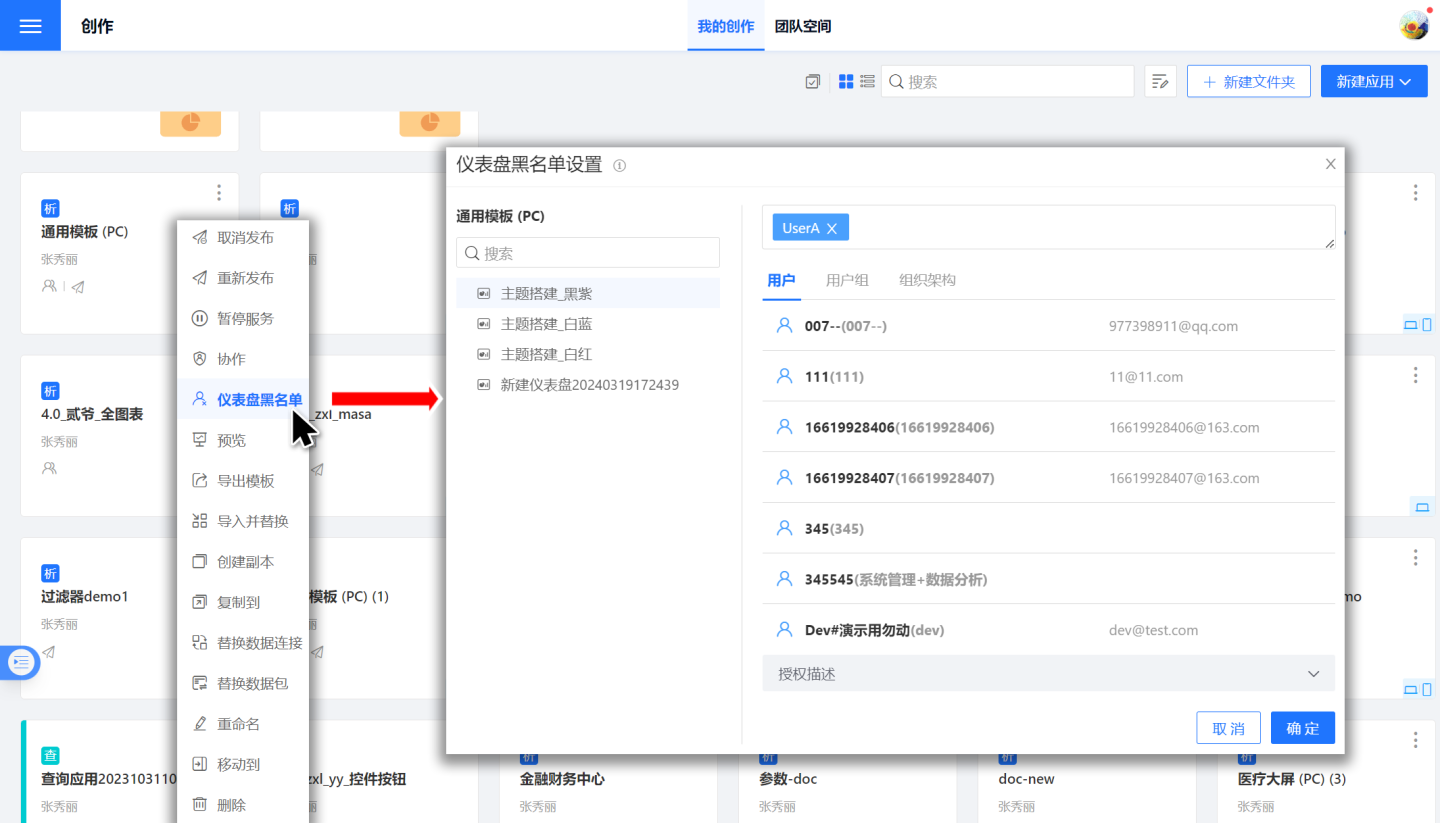
Each app can consist of one or more dashboards. When an app is authorized for a user to view, dashboard blacklists can be used to manage permissions for the dashboards, specifying which dashboards in the app should be hidden from the user. After a dashboard is set on the blacklist, the user will not see that dashboard when they open the app.
