Filter Overview
Application Scenarios
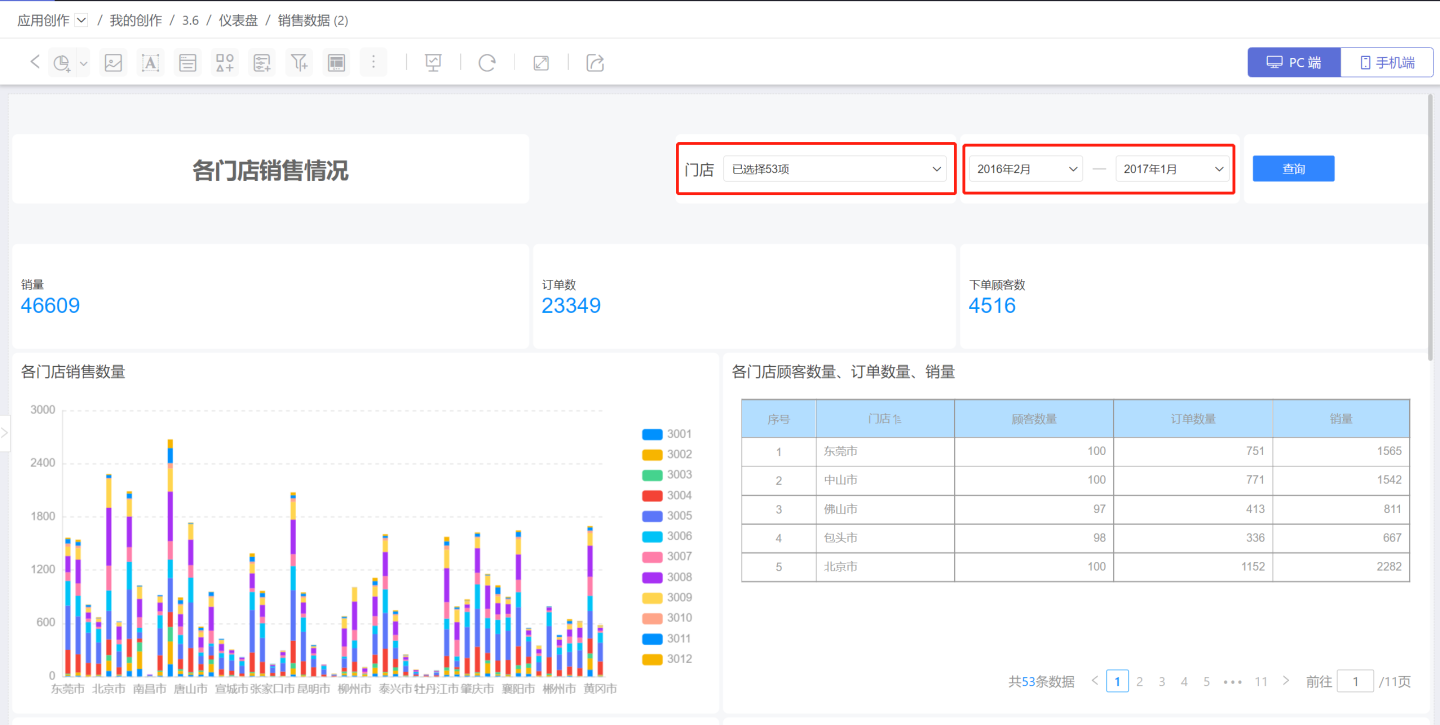
In data analysis, the same dashboard needs to display different results based on different conditions. For example, in a scenario of store sales, users might want to display the sales of all stores in January 2017, or they might want to view the sales for the entire year of 2016 and analyze which stores had poor sales performance. In such cases, filters for stores and time can be added to the dashboard to select conditions and filter out the relevant data. 
Filters can:
- Filter data under one or multiple conditions.
- Fuzzy search for the required data.
- Set charts to be filtered by filter conditions.
- Apply to charts in a single dashboard or to charts across the entire application.
Filter Overview
HENGSHI SENSE supports various types of filters, primarily:
- General Filters: Filter data based on the content of the filter field. Includes Text Filters, Time Filters, and Numeric Filters.
- Text Search Box: Search based on the content of the text search box to match and retrieve data that meets the conditions.
- Tree Filter: Filter data across multiple fields with hierarchical relationships to retrieve data that meets the conditions.
- Filter Button: Associate all filters related to the query, and after all query conditions are filtered, perform the query.
Filters are also categorized by their scope of application into Local Filters and Application Filters.
Additionally, filters support the following settings:
- When canvas space is limited, filters can be moved to the sidebar.
- The hierarchy relationship between filters can be adjusted to link them together.
- Internal Filters can be added within filters to adjust the range of filter fields.
- The scope of charts affected by filters can be set.