Query Application
In the process of business analysis, querying detailed data sometimes needs to meet the following scenarios:
- Users can independently select query fields and corresponding filter conditions for querying in a self-service operation interface.
- Users can quickly obtain the required data through simple mouse clicks and provide advanced functions such as aggregation calculations.
These scenarios can be achieved through the Query Application.
Overview
The Query Application differs from the Analysis Application in that its display format is fixed. Below is an example of a Query Application, from which it can be seen that the Query Application is divided into two areas. The upper area displays query fields and corresponding filter conditions, while the lower area displays the corresponding data. 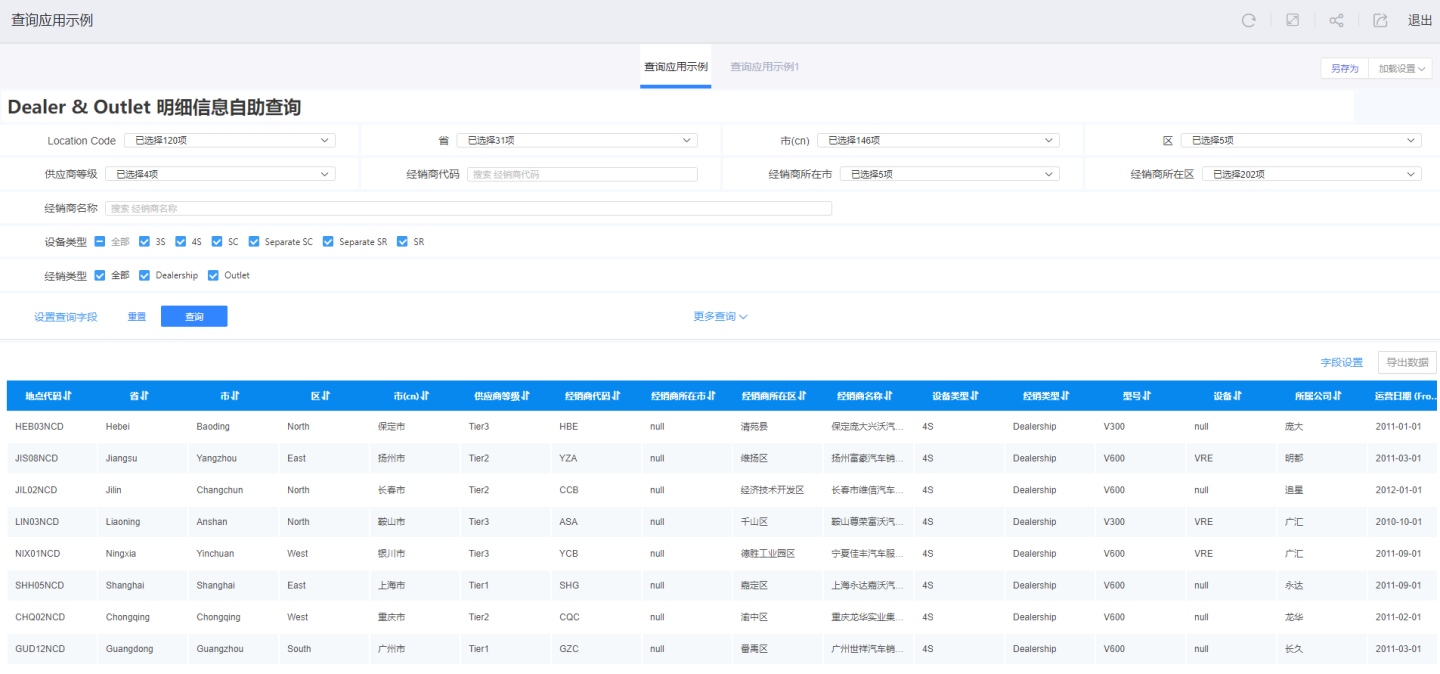
A Query Application consists of pages, and a single Query Application can contain one or more pages. The example shown is a single page of a Query Application.
To distinguish it from the Analysis Application, each Query Application is prefixed with a "查" character. This identifier is present both during application creation and in the application marketplace display.
Introduction to Query Application Pages
The editing interface of a Query Application page is divided into four areas. 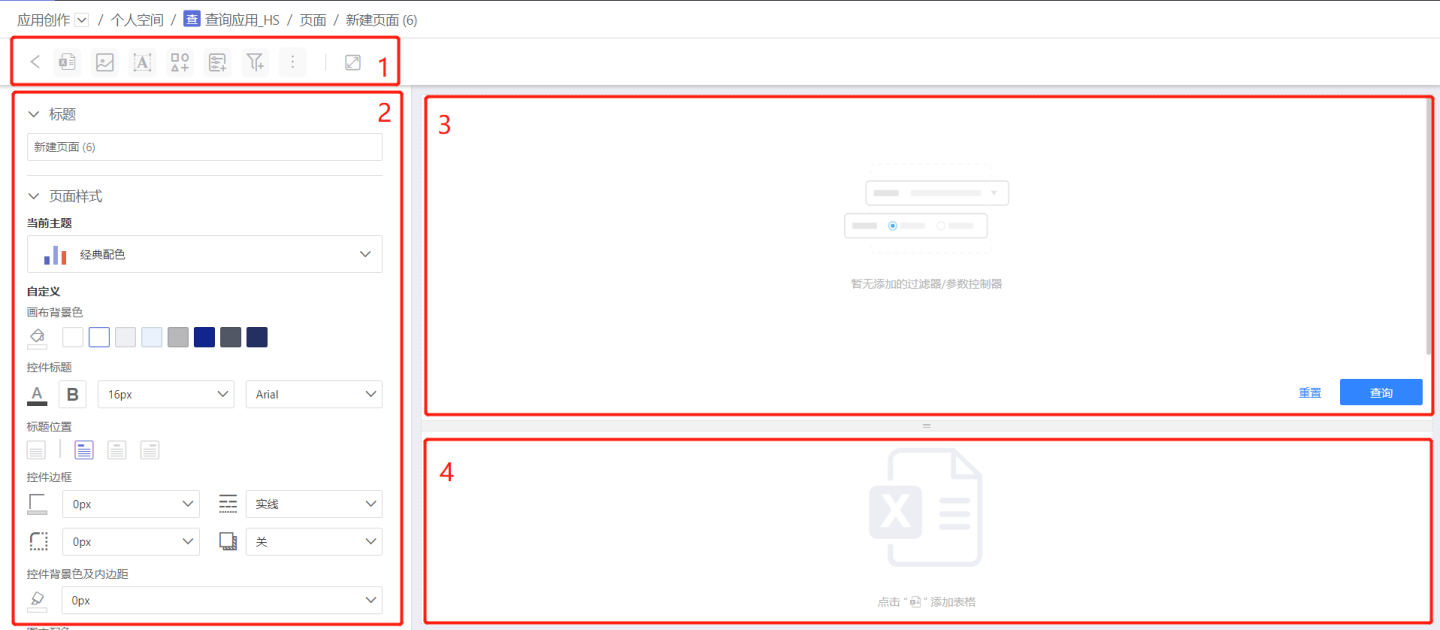
- Area 1: Displays the types of controls supported by the application page, including Table Controls, Image Controls, Rich Text Controls, Graph Controls, Parameter Controls, Filter Controls, and Button Controls.
- Area 2: Page Settings area. You can set the page title, page style, background canvas, and page layout.
- Area 3: Filter area, used to display filter conditions and parameter filters.
- Area 4: Data display area. Supports tables and dataset tables.
Note
- Image Controls, Rich Text Controls, and Graph Controls will be displayed in the data area when created and can be moved to the upper filter area.
- The usage of Table Controls, Image Controls, Rich Text Controls, Graph Controls, Parameter Controls, Filter Controls, and Button Controls in the Query Application is the same as in the Analysis Application. Click the corresponding links to view specific usage methods; they will not be described here.
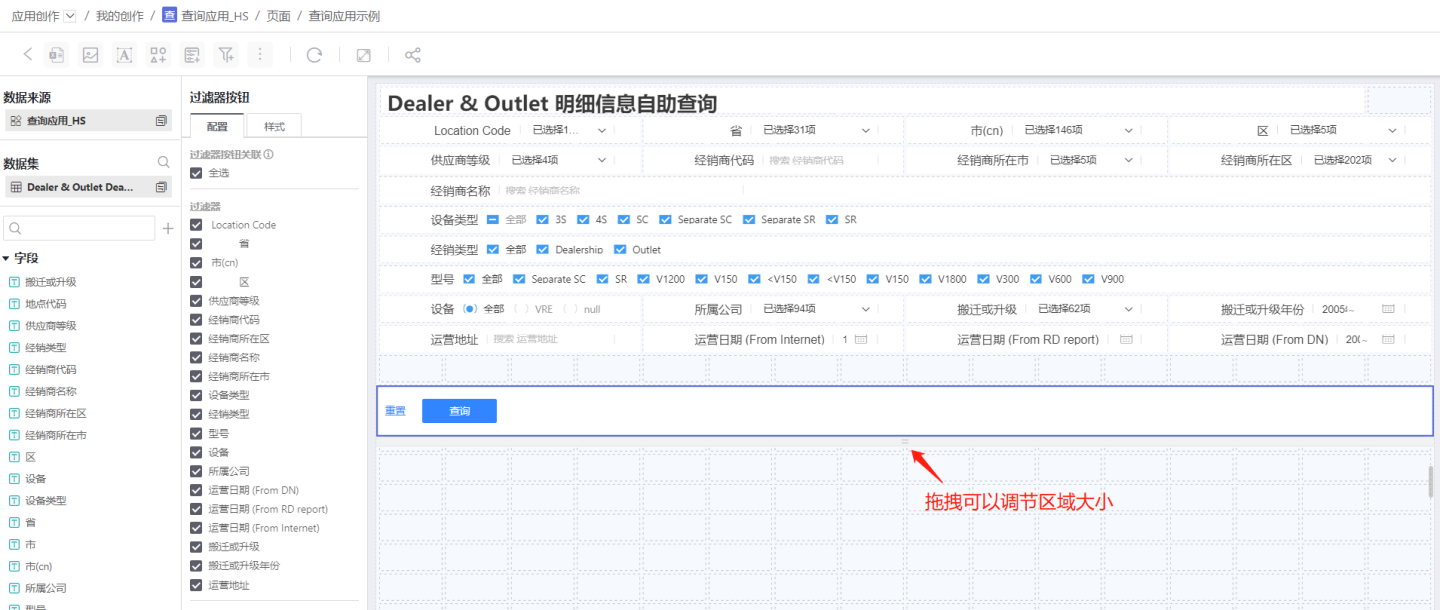
- The filter area and display area can freely adjust the display area size, facilitating editing and application layout.
Creating a Query Application
Below is an introduction to the creation process of a Query Application.
Create a new Query Application. In Application Creation, click New Application -> Query Application and name the application.
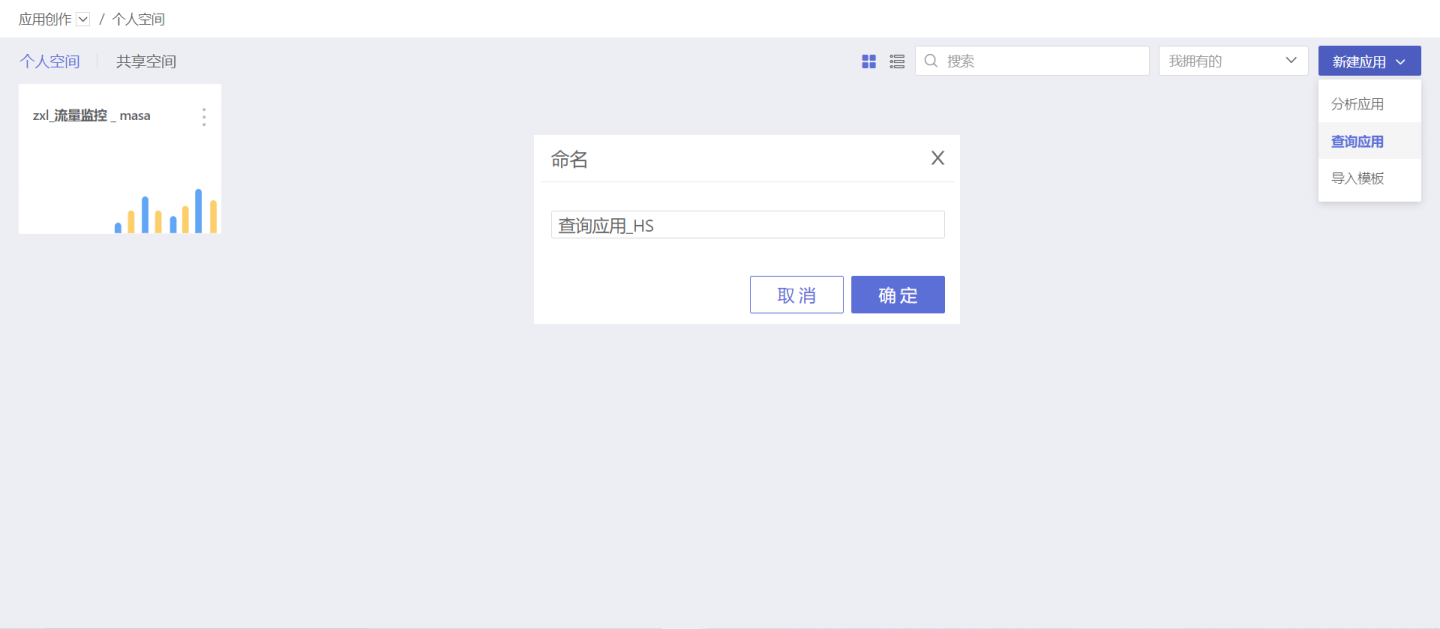
In the blank Query Application, click + New Page in the upper right corner to add a page.
Build the header information of the Query Application in the new page. In the example, Image Controls and Rich Text Controls are used to display the header information. Note that these controls are added in the data display area and moved via the Move Up option in the three-dot menu.
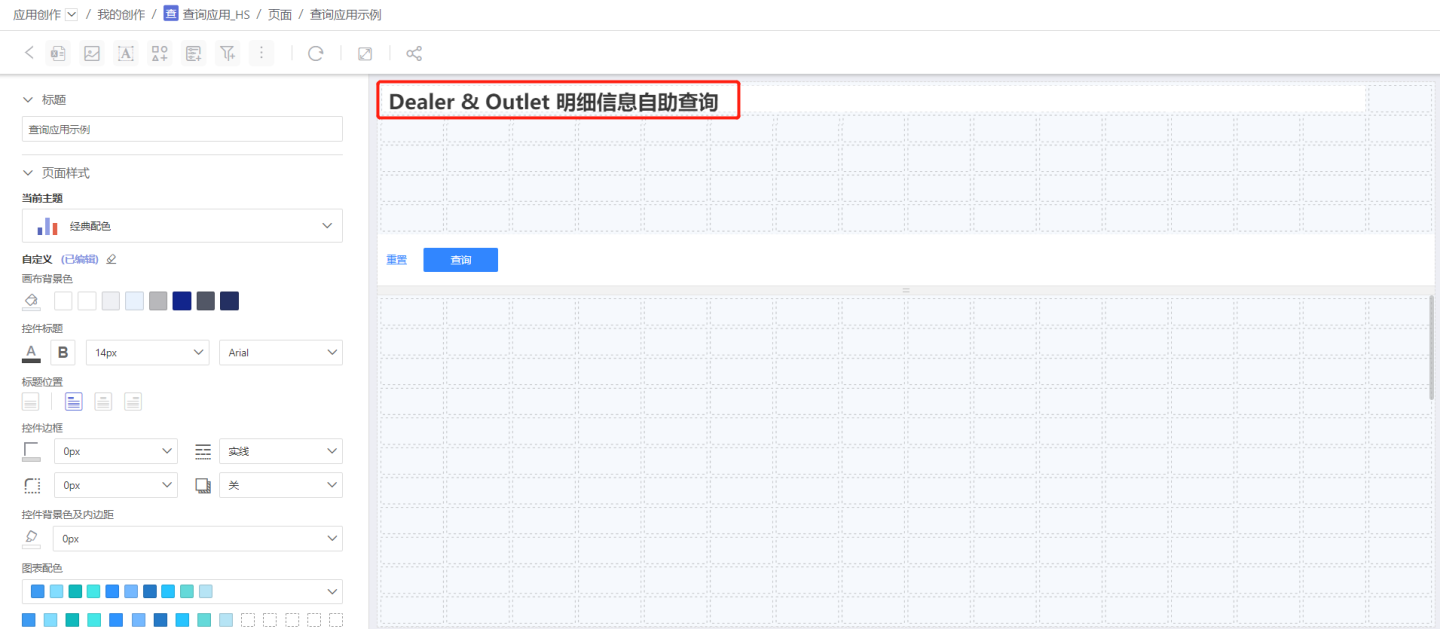
Add filters and parameter filters in the filter area, and adjust the display size during editing.
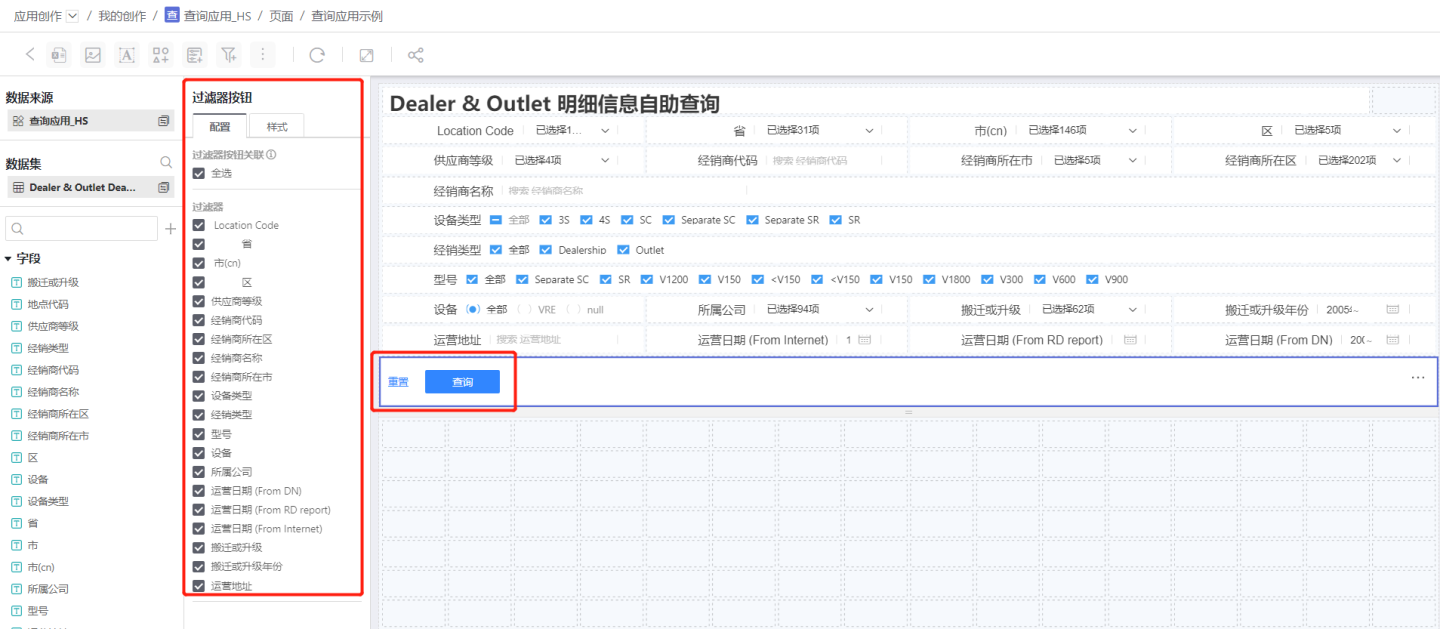
Associate filters in the filter button; by default, all filters in the filter area are associated and can be modified.
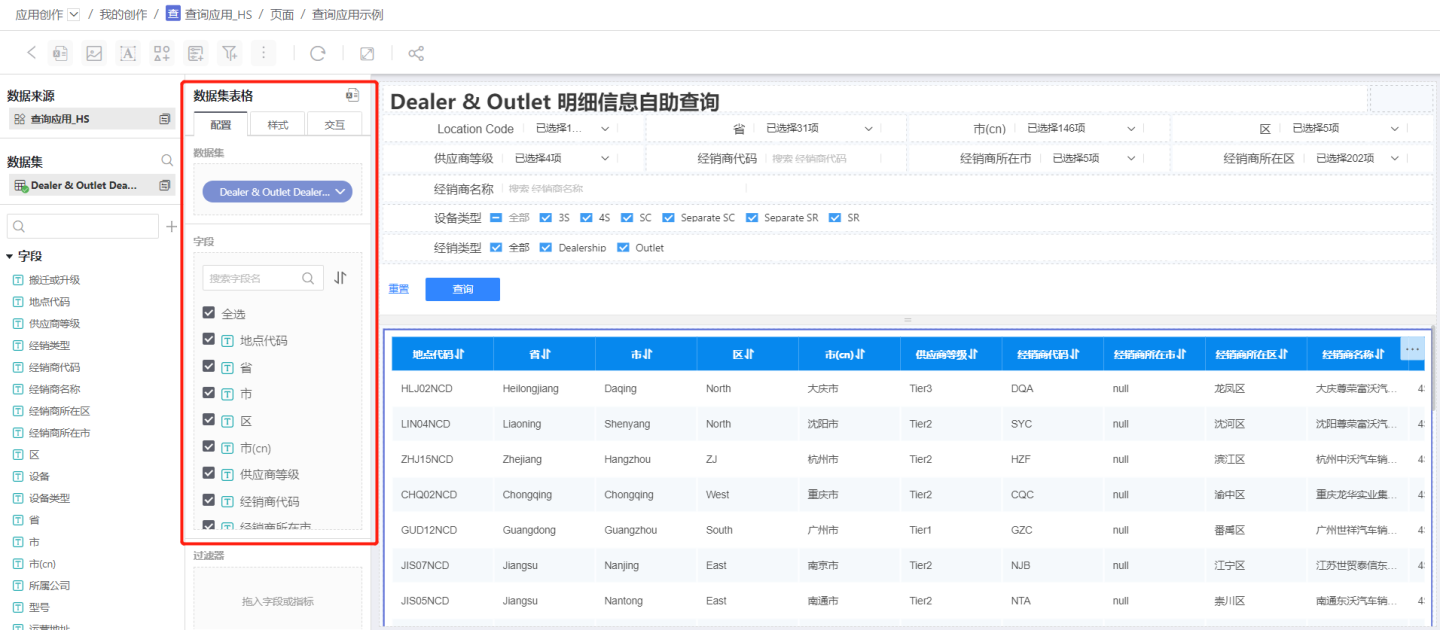
Add the data to be displayed in the data area. Click New Chart to create Tables, Canvas Tables, Dataset Tables, and Cross-Tabulations. The data area can display multiple tables. The example only shows one table.
Adjust the display size of the filter area and data area to layout the application as a whole. When there are many filters, they will be collapsed for display upon publication.
Complete the creation of the Query Application and publish it. Fill in the publication information. The publication process is the same as that of the Analysis Application.
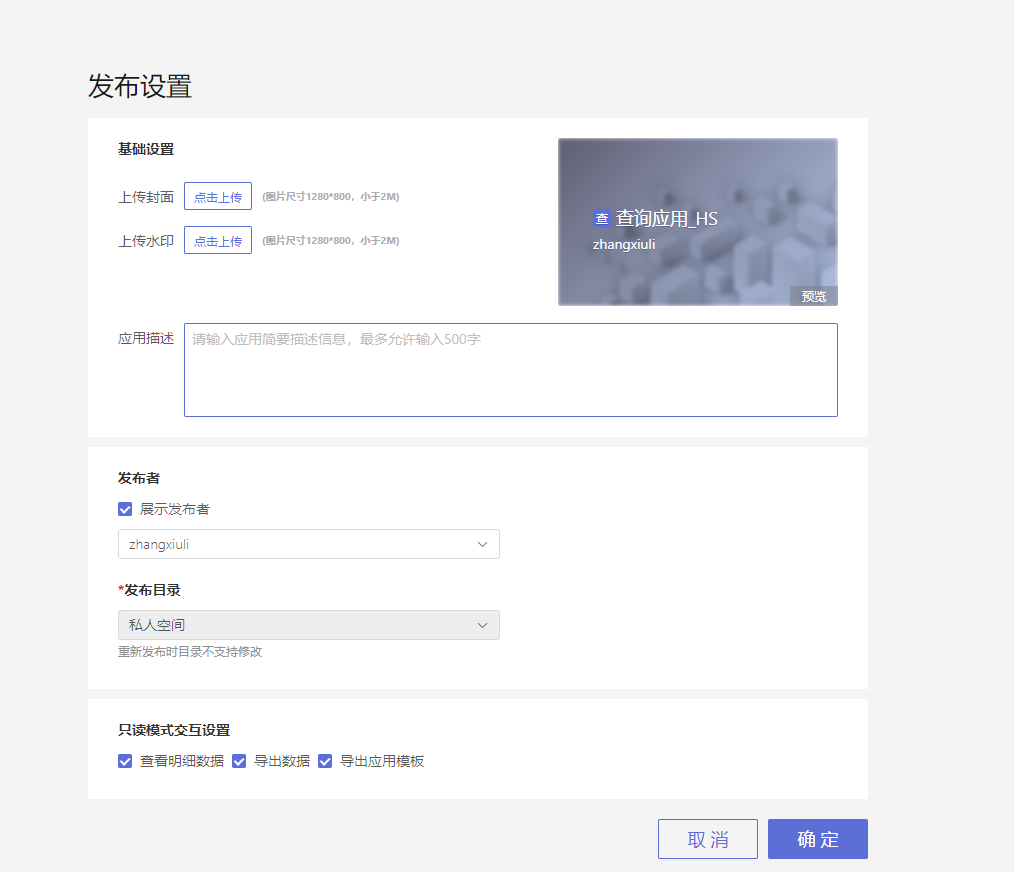
Published Query Application
Below is the state of the Query Application after it has been published. Compared to the editing state in the creation area, it includes several additional parts, which enable the Query Application to dynamically display filter conditions and data fields, save user query configurations, and set default query configurations, allowing the same application to present different query interfaces to different users.
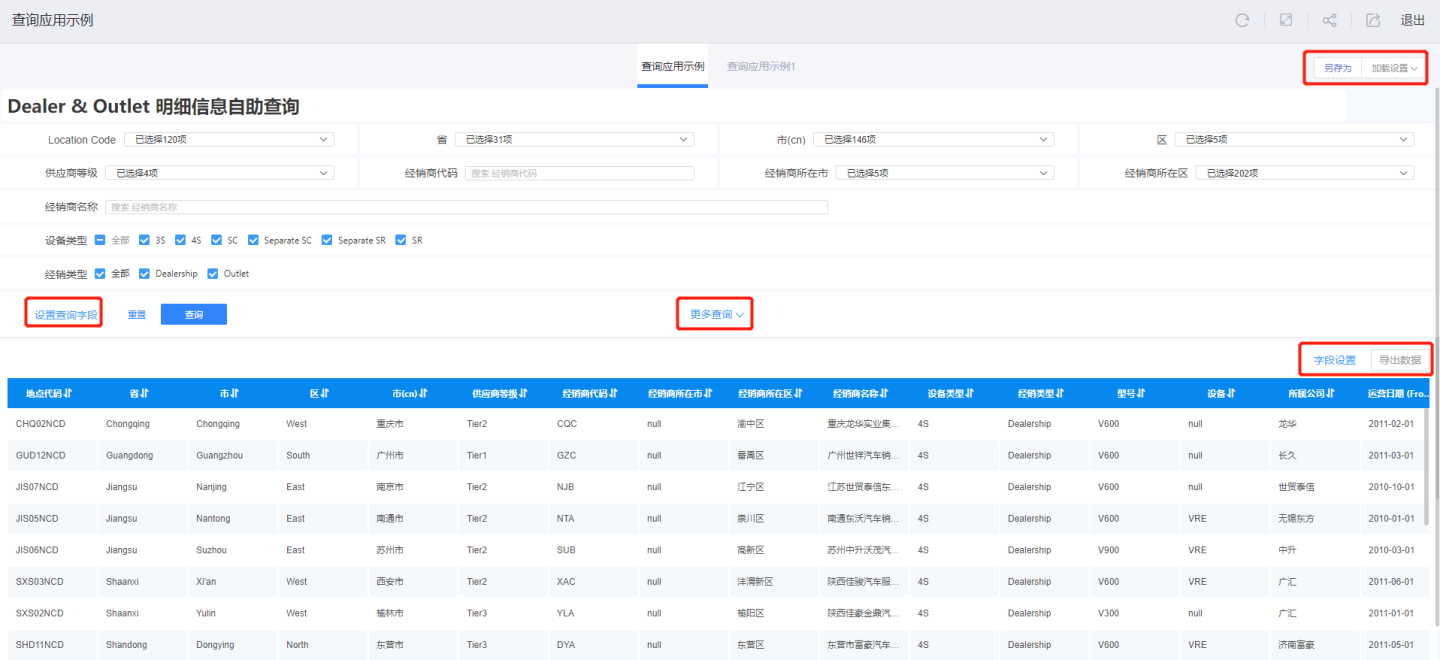
The published Query Application supports:
- Setting query fields: Controls the display status of filters in the filter area and adjusts the display order of filters.
- Field settings: Controls the display status of data fields and adjusts the display order of fields.
- More queries: When there are too many filter controls in the filter area, they will be collapsed to avoid occupying more screen space, and all filter controls can be displayed through more queries.
- Save As: Saves the configurations of all filters in the filter area and all field displays in the data display area.
- Load Settings: Loads previously saved configurations and supports setting default configurations.
- Export Data: Exports table data. This button will be displayed here if data export is enabled upon publication.
Example display effect. 