Data Model
The data model, also known as the relational model, allows for the establishment of join or union relationships between datasets, which are then incorporated into chart creation.
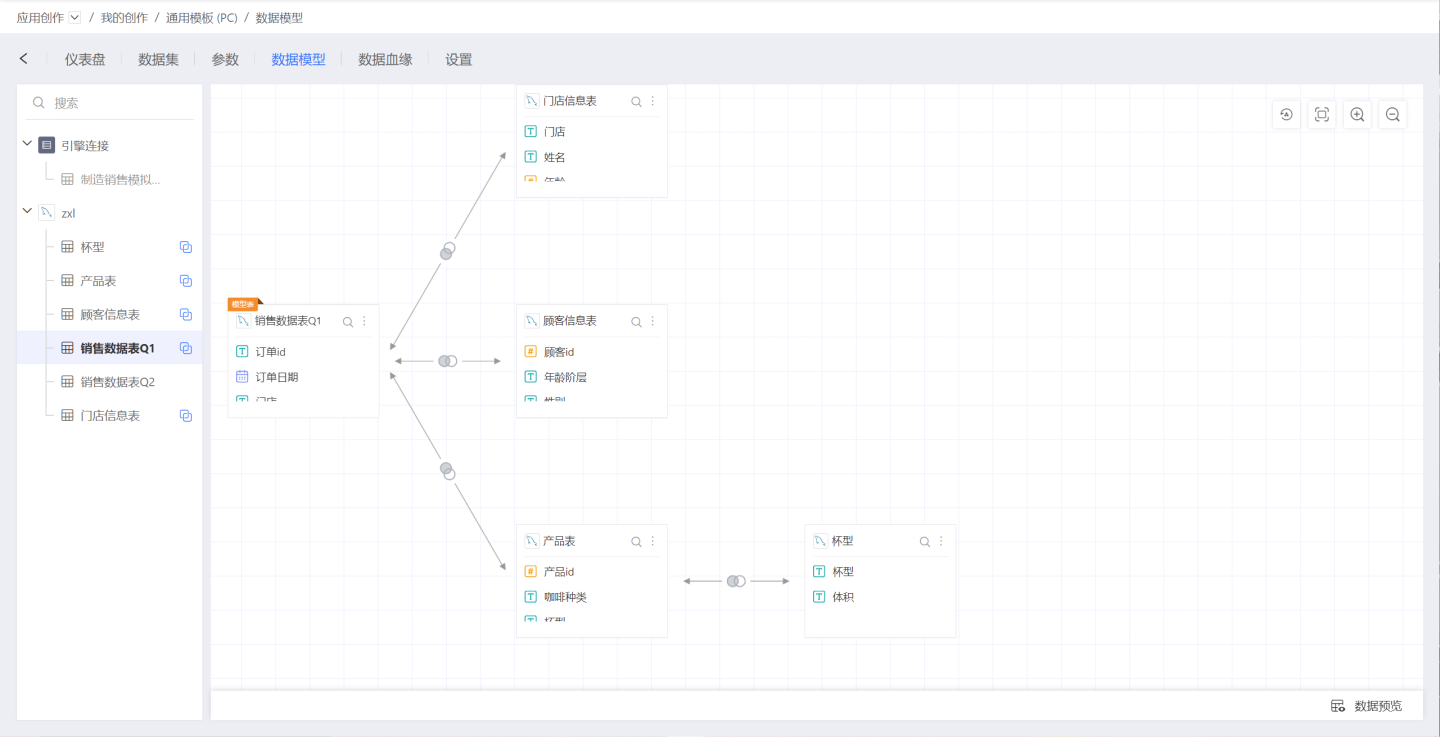
The data model offers the following features:
- Supports dataset appending, such as appending new sales data monthly.
- Supports dataset reuse: Within a data model, a dataset can be dragged in multiple times to establish different relationships, enabling self-association of datasets and expanding a single dictionary table into a hierarchical dictionary table.
- Supports cross-dataset metric creation: Metrics can be created using associated datasets in the model table.
- Association conditions support expressions: Allows users to freely write association conditions, such as fuzzy matching.
Additionally, new concepts are introduced:
- Model Table: Selecting a dataset and establishing various relationships around it, this dataset is referred to as the model table.
- Associated Table: A dataset that establishes an association relationship with the model table within the data model.
A dataset serves as an "Associated Table" when participating in association relationships with other model tables, and as a "Model Table" within its own data model. When selecting a dataset for chart creation, the entire data model with that dataset as the model table is incorporated.
Tip
Only supports the establishment of data models for datasets from the same connection. A chart can only use one data model and cannot span multiple data models for chart creation.
Create Relationship
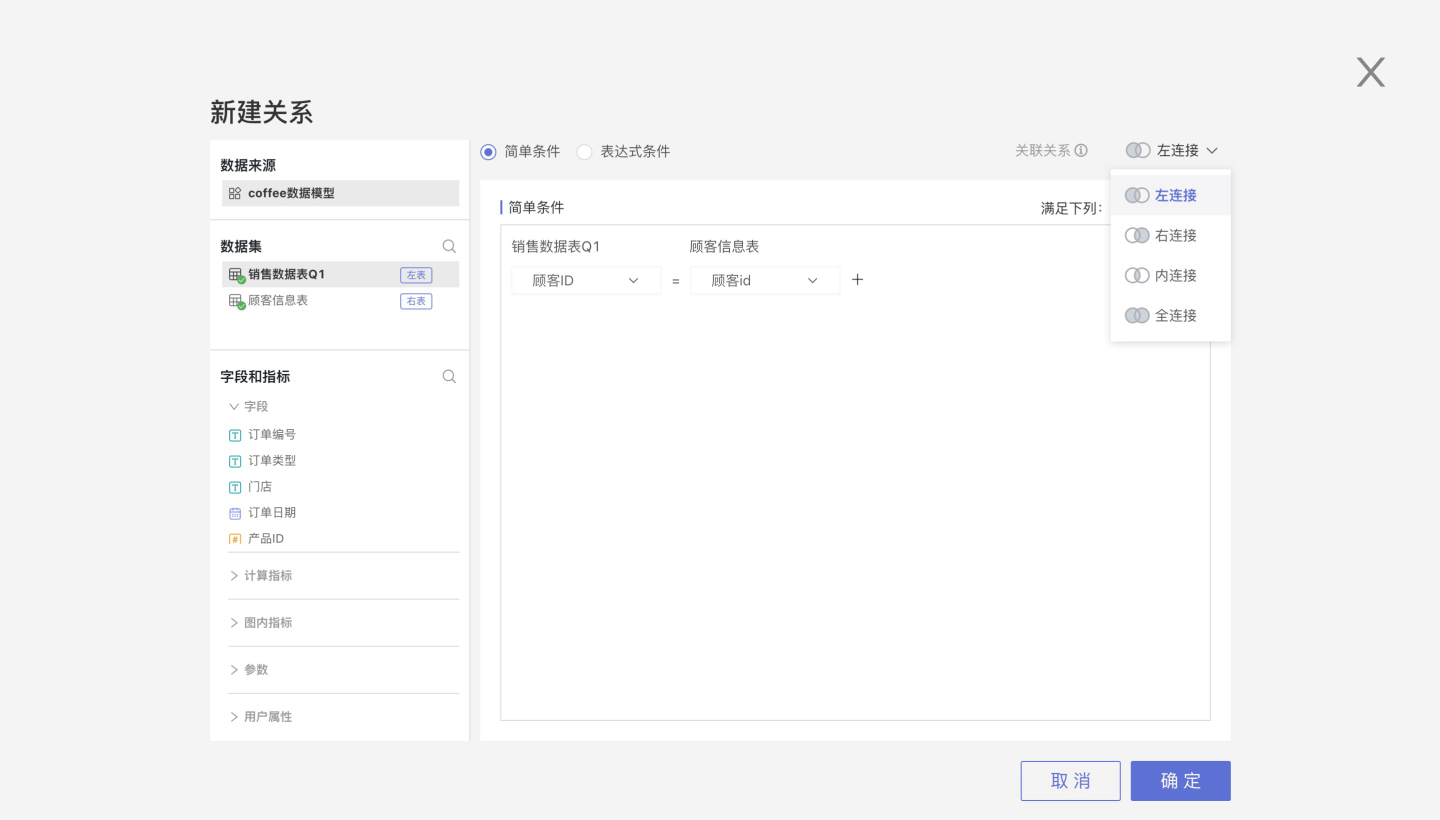
In the data model area, click on a dataset, then drag a dataset from the left list onto it, and the Create Relationship window will pop up. In this window, you can set:
- Association Relationship: Inner Join, Left Join, Right Join, Full Join
- Association Condition: Simple Condition, Expression Condition
- Association Cardinality: One-to-One, One-to-Many, Many-to-One, Many-to-Many
Association Relationships
Association relationships refer to the join methods between datasets, including the following four types:
- Inner Join: Returns only the rows that match perfectly in both tables.
- Left Join: Returns all rows from the left table, regardless of whether they match the right table.
- Right Join: Returns all rows from the right table, regardless of whether they match the left table.
- Full Join: Returns the union of the results from both the left join and the right join.
Tip
Some databases, due to their own limitations, do not support full join, such as MySQL 5, TiDB, etc. Corresponding prompts will appear when creating models.
Association Conditions
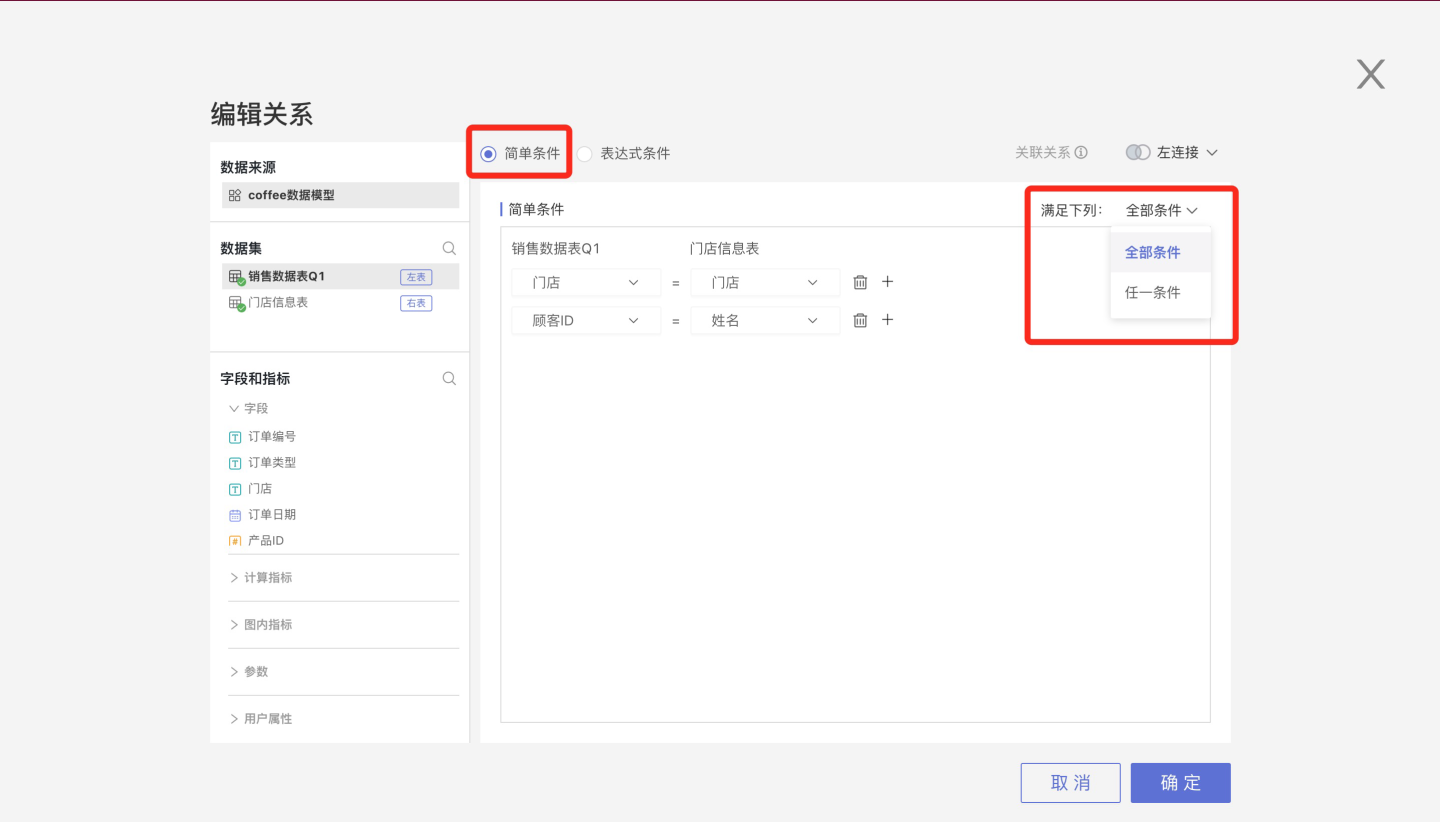
Association conditions can be set in two ways: Simple Condition and Expression Condition.
Multiple conditions in simple conditions have two relationships: Any Condition (OR) and All Conditions (AND).
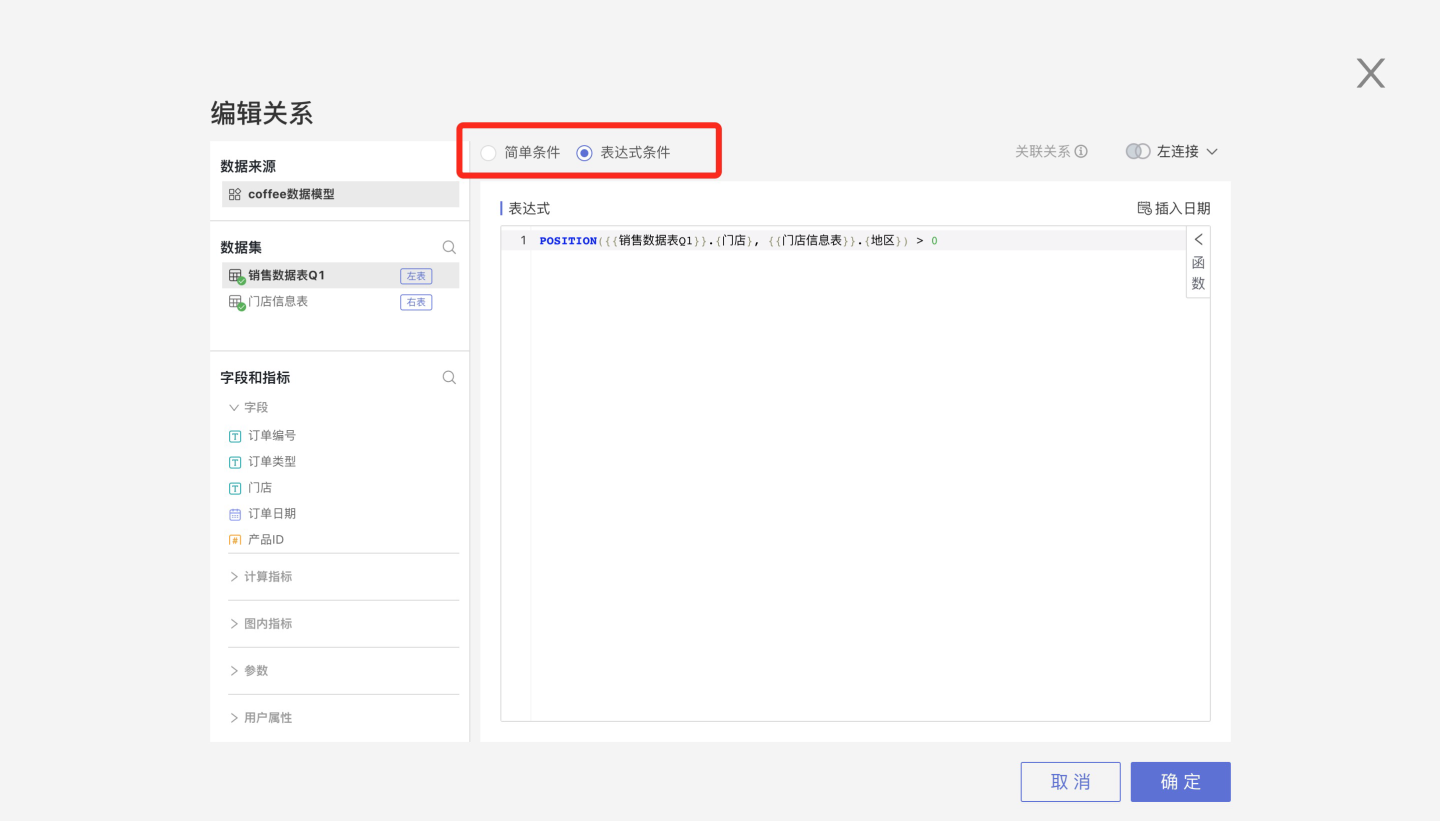
Expression conditions allow users to freely write association conditions, which can be field a > field b, or like(field a, field b), as shown below:
Association Cardinality
In the data model, the role of association cardinality types is to prevent analysis distortion caused by data inflation. The example demonstrates the situation of data inflation when modeling with a one-to-one cardinality, where inflated data can lead to severe analysis distortion. 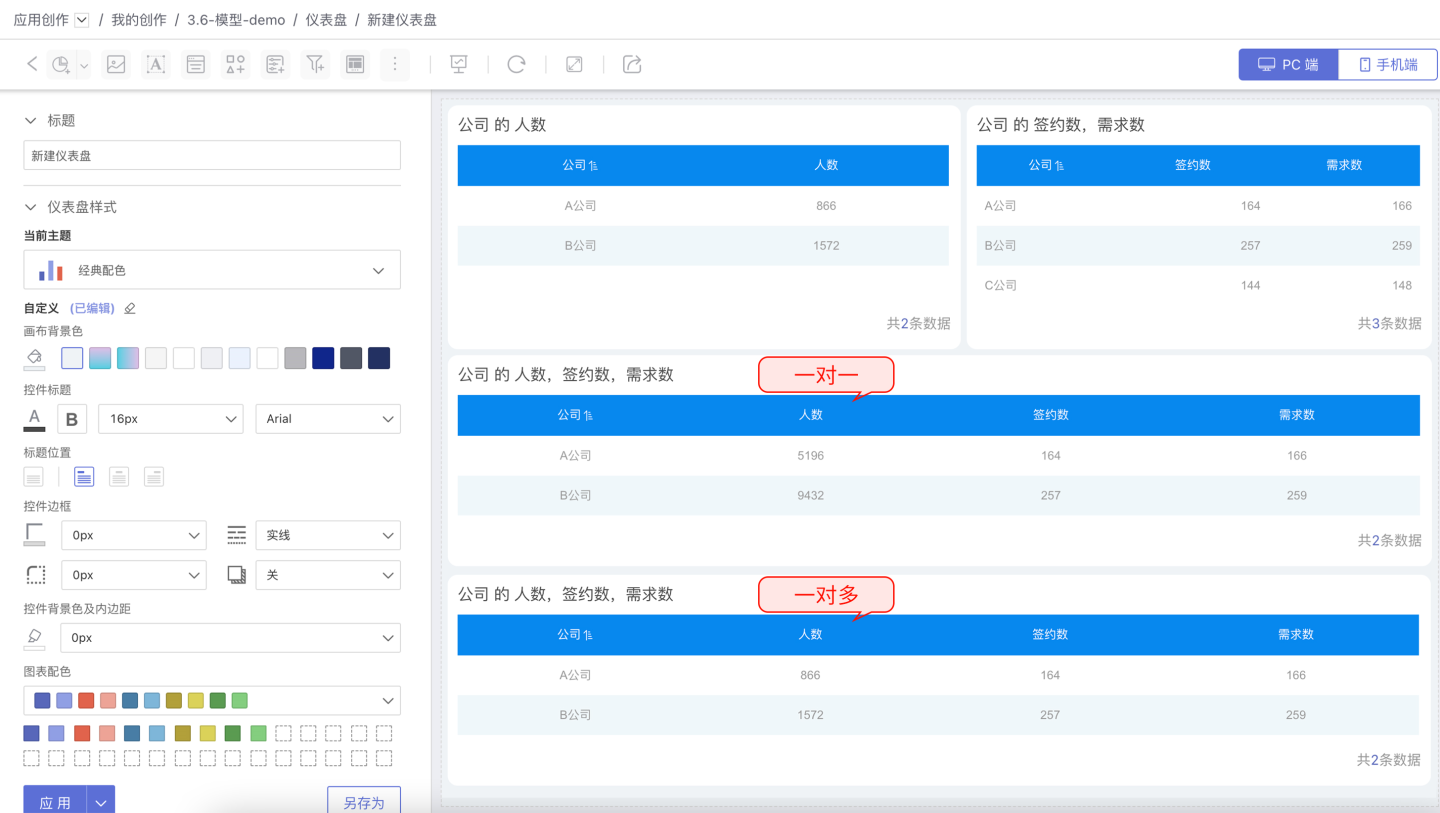
Therefore, when modeling data, users should select the table association cardinality based on actual business scenarios. The cardinality types include one-to-one, one-to-many, many-to-one, and many-to-many, with the default setting being one-to-one. 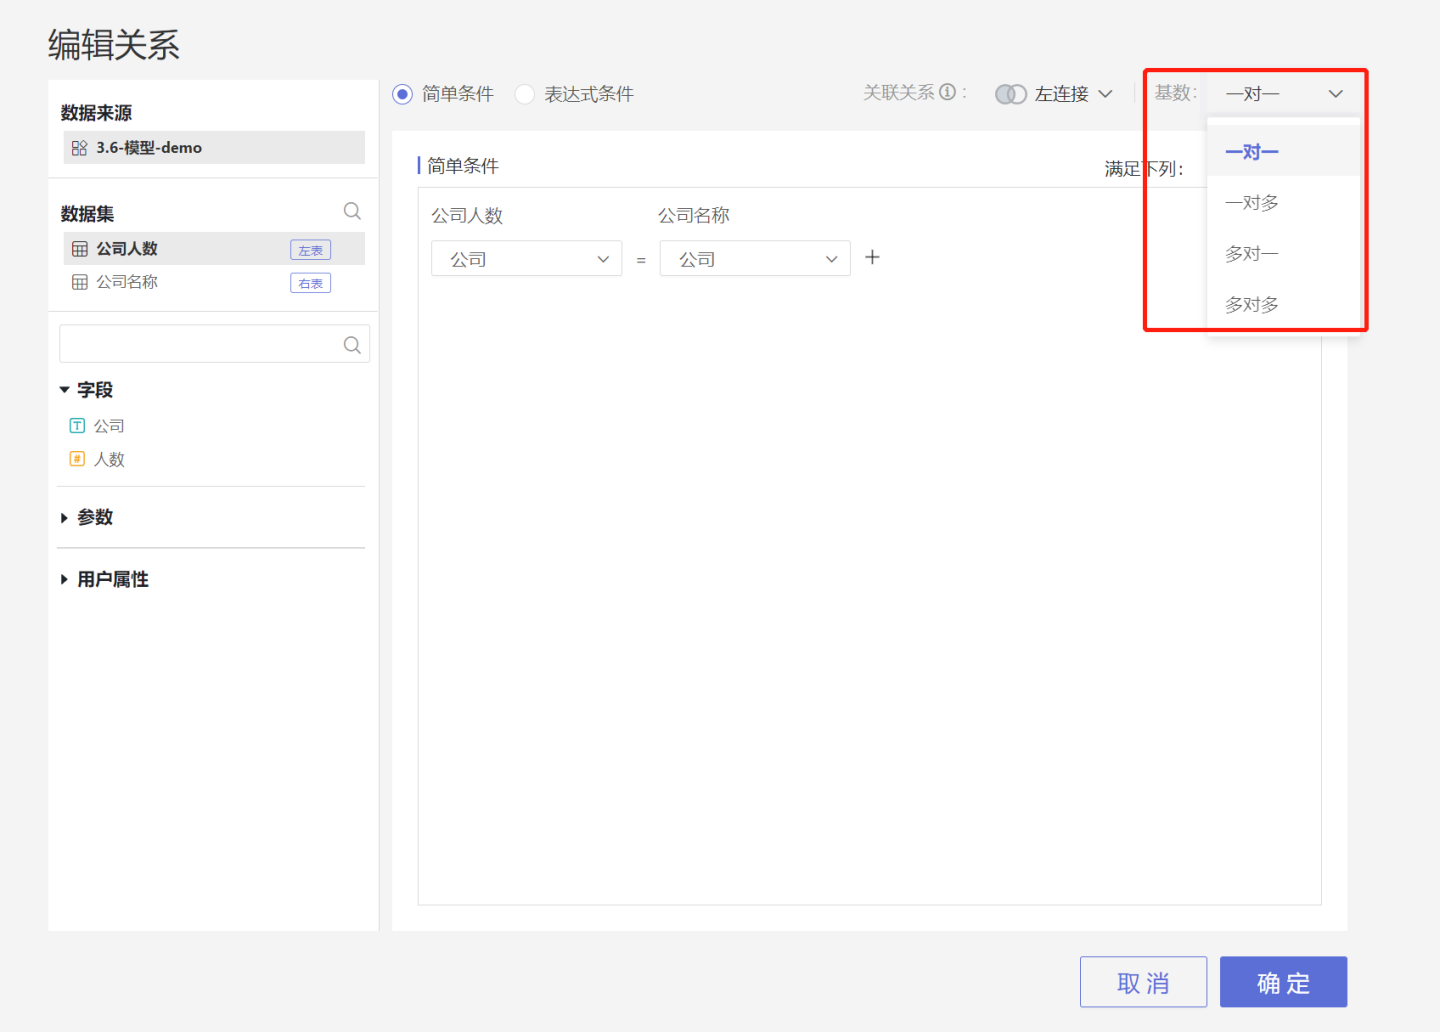
Mechanism of Action
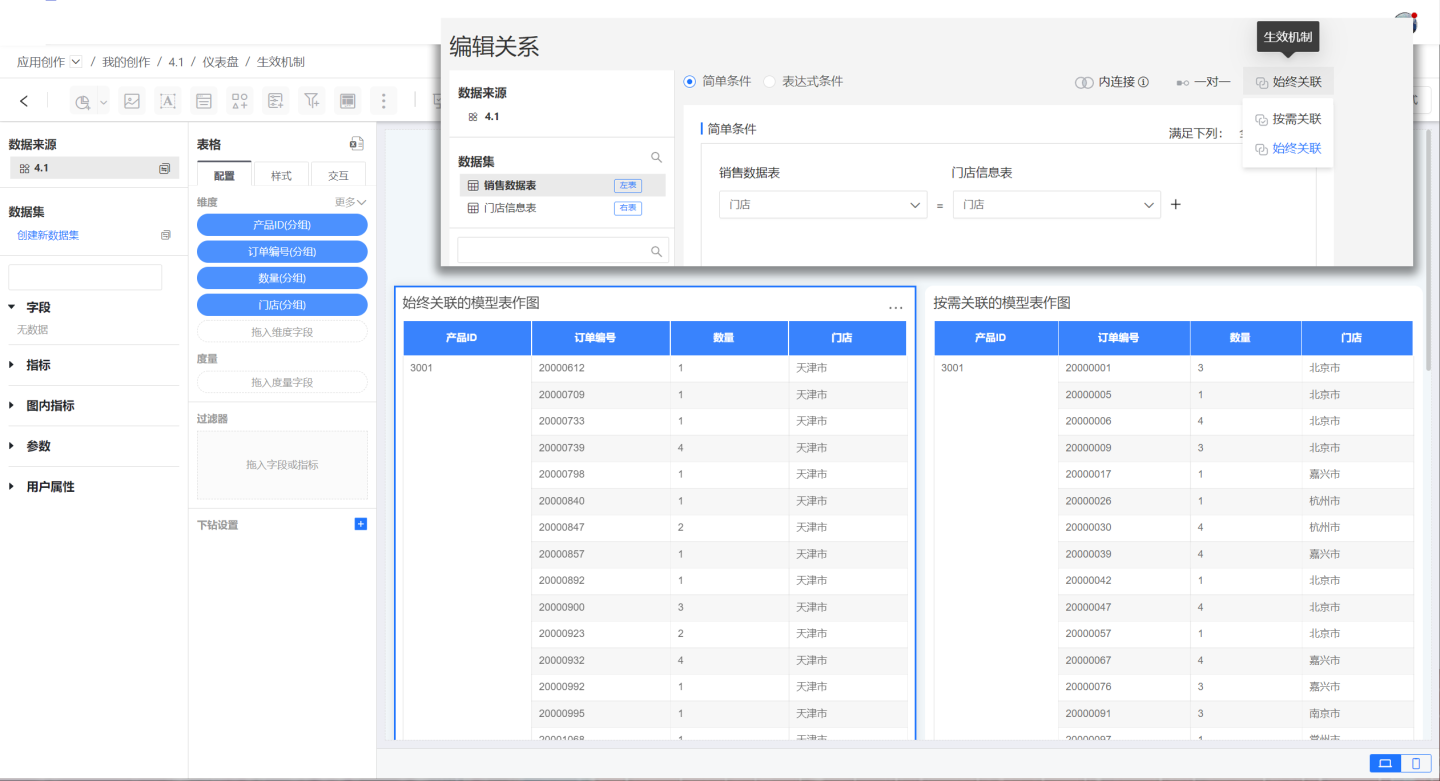
The mechanism of action of the model includes on-demand association and always association.
- On-demand association means that the association relationship does not take effect when only the model table is used, and the association relationship will only take effect when the extended table is used.
- Always association means that the association relationship will take effect regardless of whether the extended table is used or not.
In the example, the sales dataset is used as the model table, and the store information table is used as the extended table. The effects of plotting with both the on-demand model and the always association model are shown. When plotting, fields from the model table are used, and it can be seen that the association relationship takes effect under always association, with the store using the store information from the extended table. Under on-demand association, the store field still uses the information from the model table.
Edit Relationship
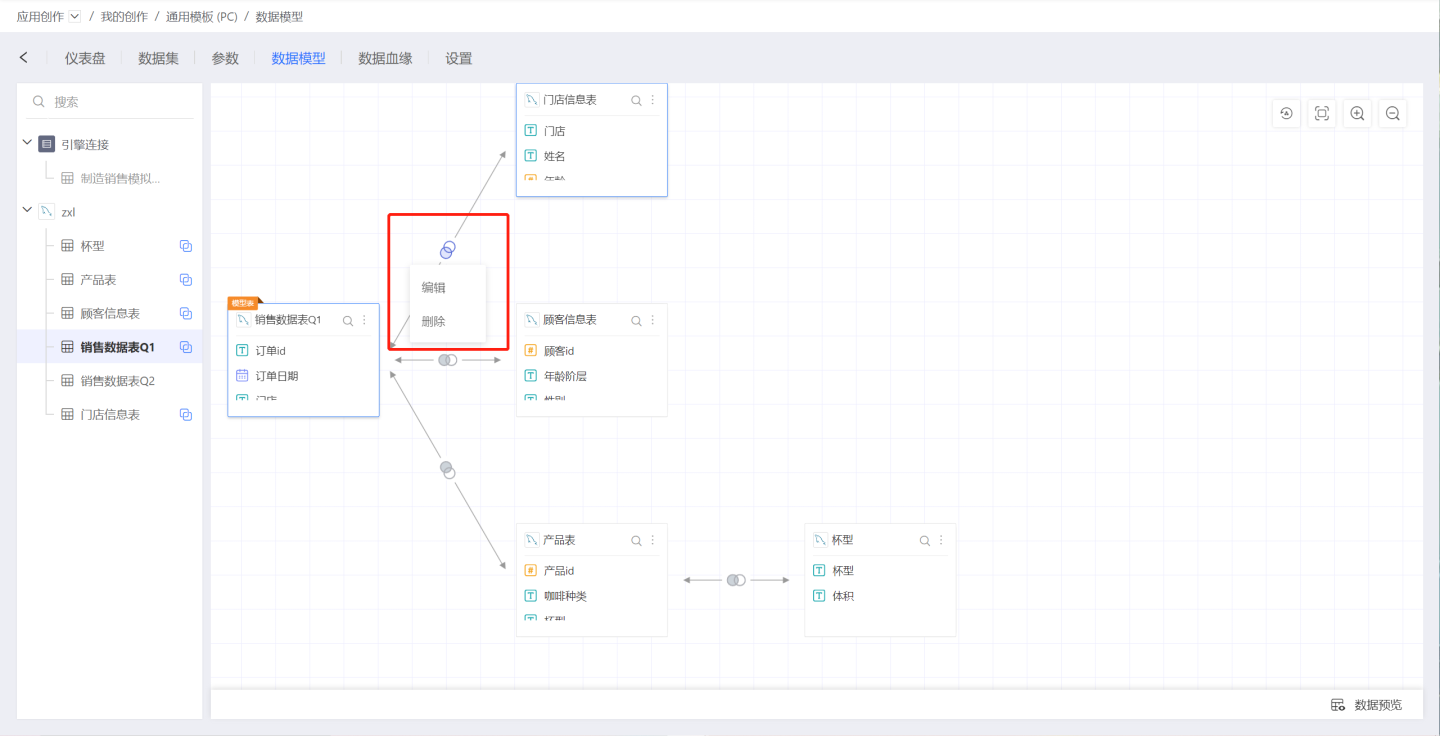
Click on a join relationship icon, and select Edit from the pop-up menu, which will open the Edit Relationship page. The Edit Relationship page is identical to the New Relationship page.
Vertical Merge of Datasets
Each dataset in the data model supports appending data. Click on the three-dot menu of each node in the model to perform a vertical merge. At this point, the dataset list on the left is displayed in a checked state, and the field information of the current dataset is shown on the right. Select the dataset to be appended from the left dataset list, click OK, and the data append is successful, appending the data of the checked dataset to the node's dataset. The merge result can be viewed through data preview. 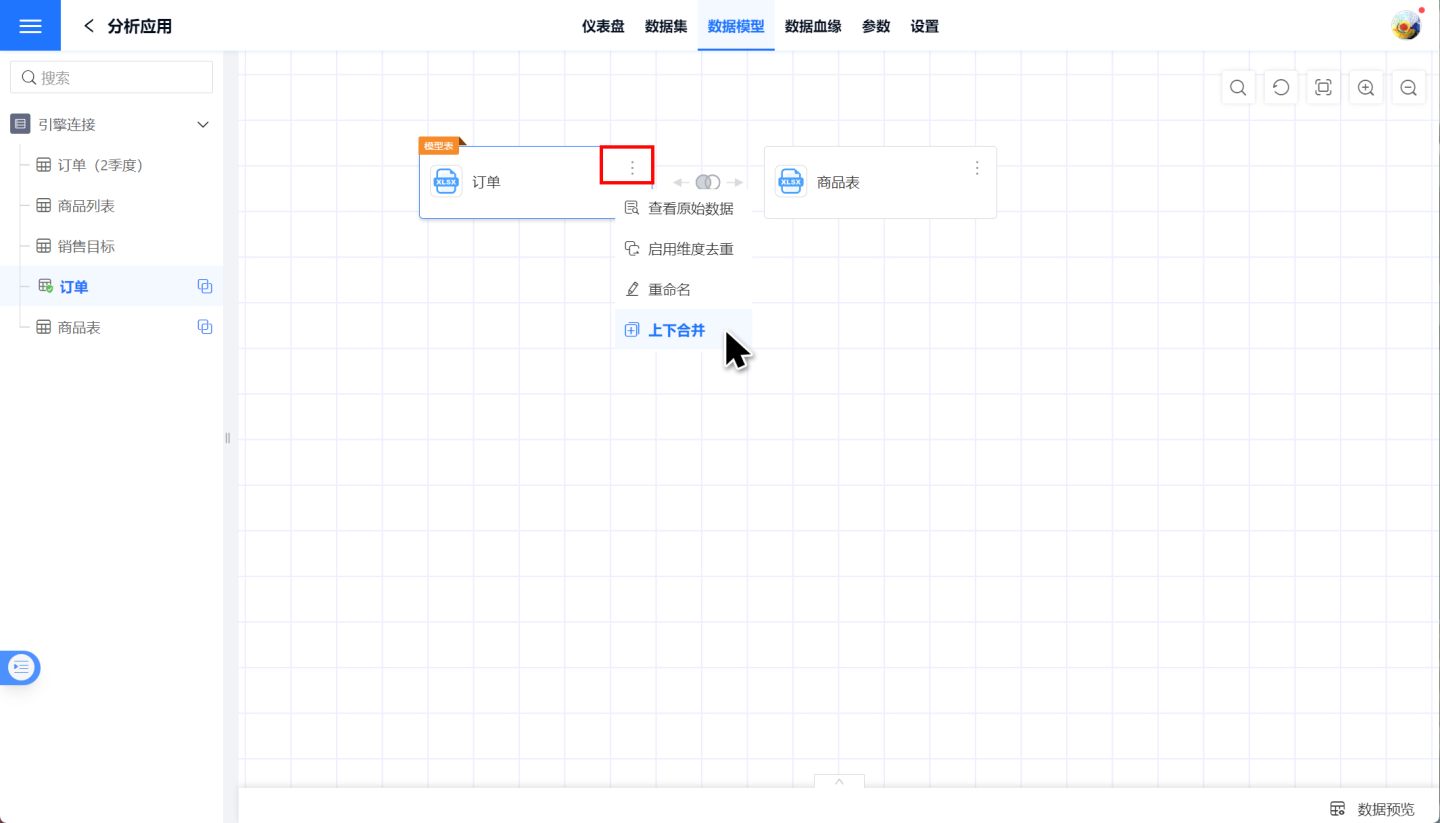
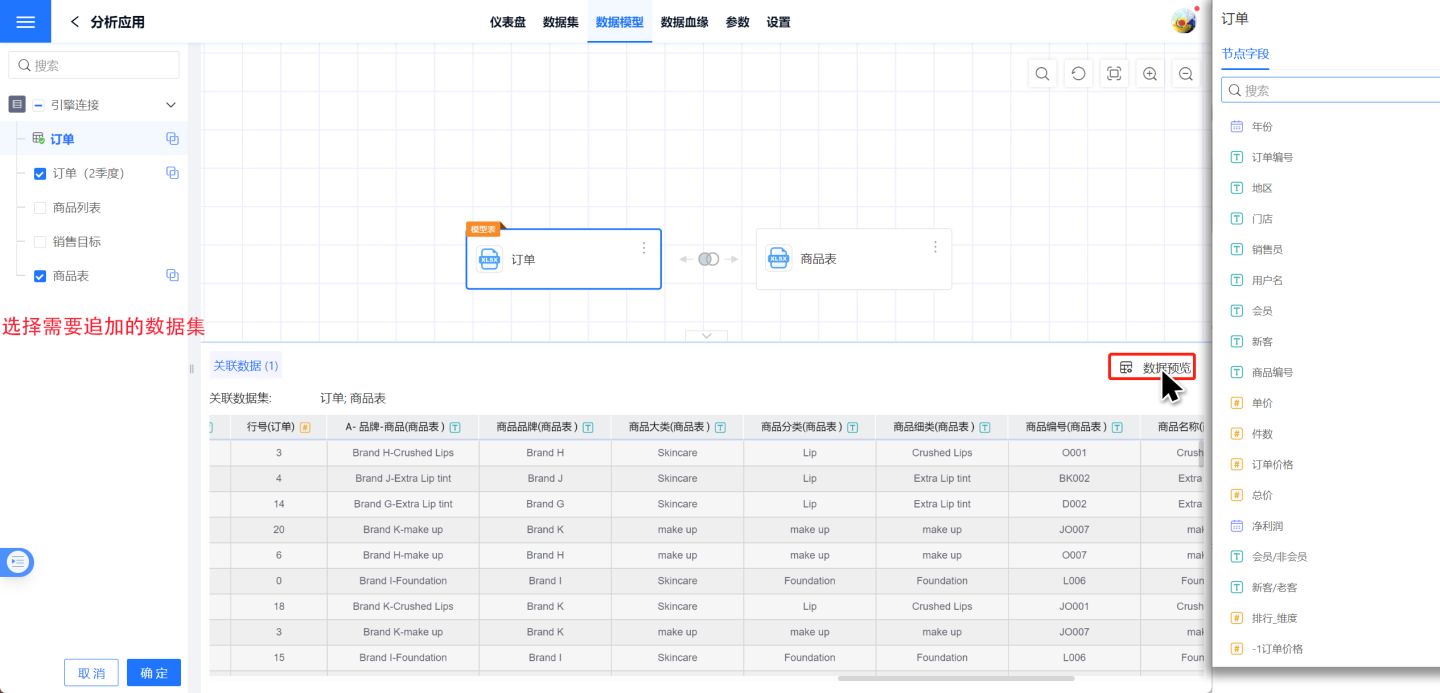
Tip
The appending principles are as follows:
- Automatically align by node field names, with the first one being the base node dataset. When field names are the same, data is appended together; when field names are different, a new column is added.
- User-added fields in the base node dataset remain as added fields after appending. If the appended field names are the same, the field is ignored if it is an entity column.
- Hidden columns can participate in the appending process.
Public Dictionary
Datasets from different sources cannot be modeled together. As shown in the figure, the datasets Company Name and Company Size cannot be associated. 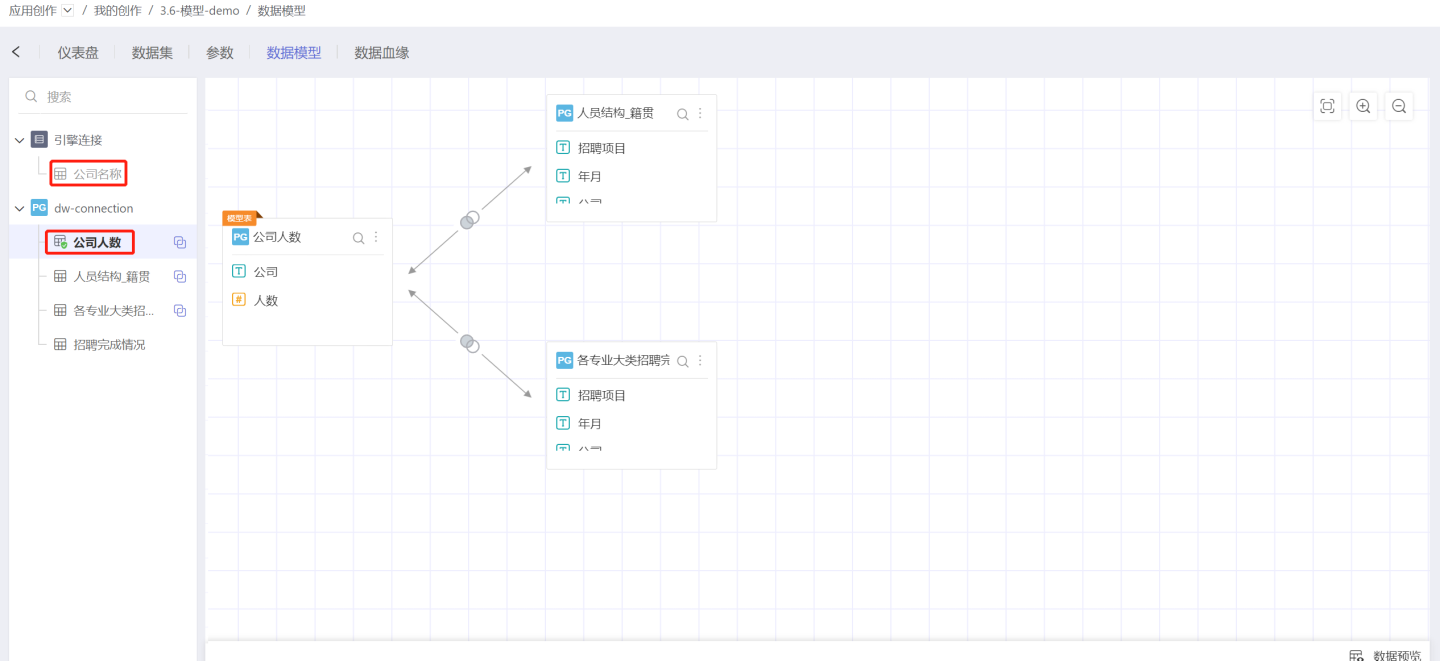
A public dictionary can resolve the above situation. First, set the dataset Company Name as a public dictionary table. 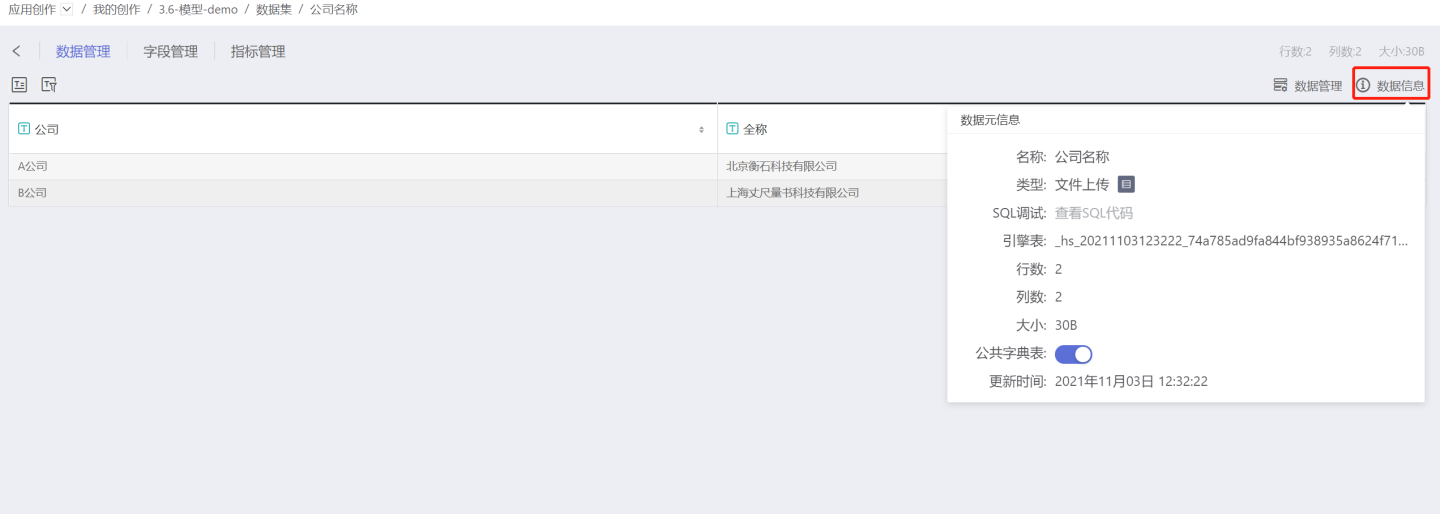 Then, drag
 Company Name and Company Size to associate them in the data model. 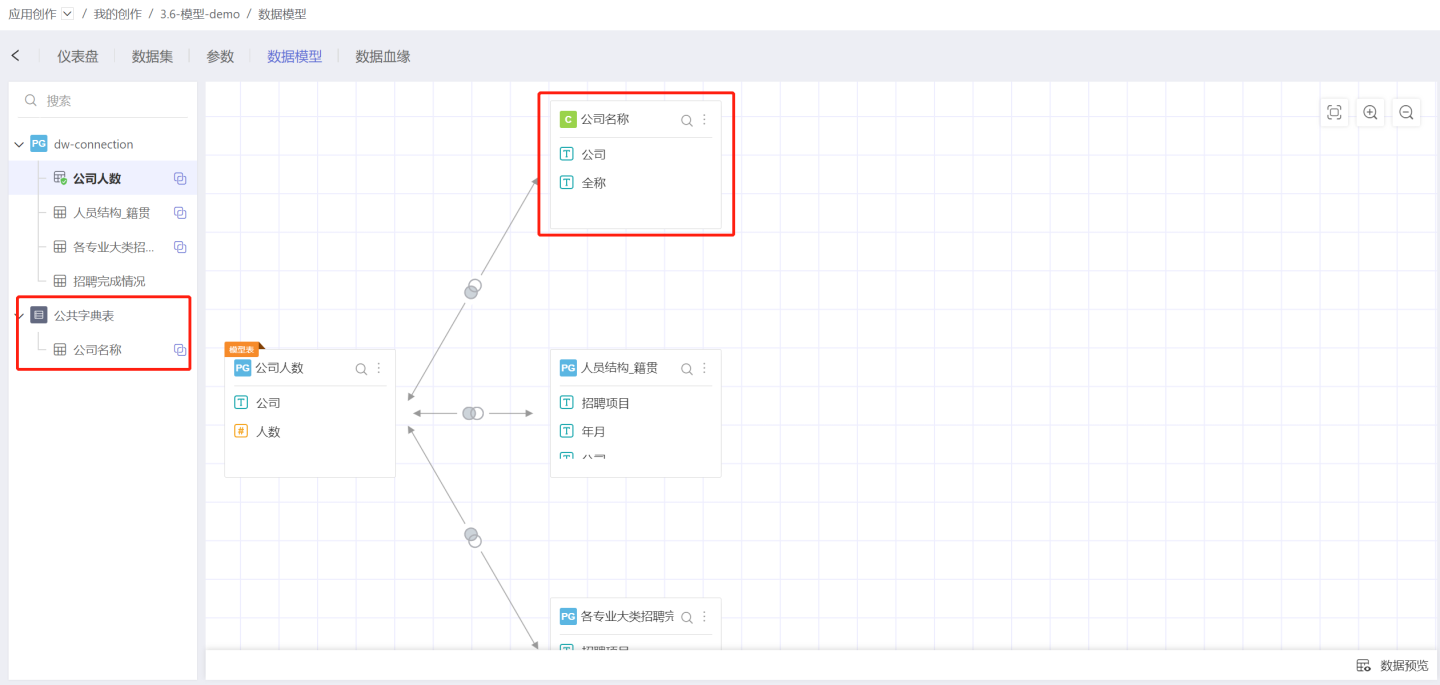
Tip
The dataset converted to a public dictionary cannot exceed 500 rows. Any type of dataset supports conversion to a public dictionary.
Dimension Deduplication
In the absence of a common dimension table, if the data between multiple tables is in a many-to-many relationship, directly associating and establishing a model may lead to data inflation, generating duplicate data that can affect subsequent data mining and analysis. In such cases, the dimension deduplication feature can be used to remove duplicate data and eliminate data inflation.
Below is an example using an order table and an advertising spend table to demonstrate how to use the dimension deduplication feature to eliminate data inflation.
The original data for the order table and advertising spend table is as follows.
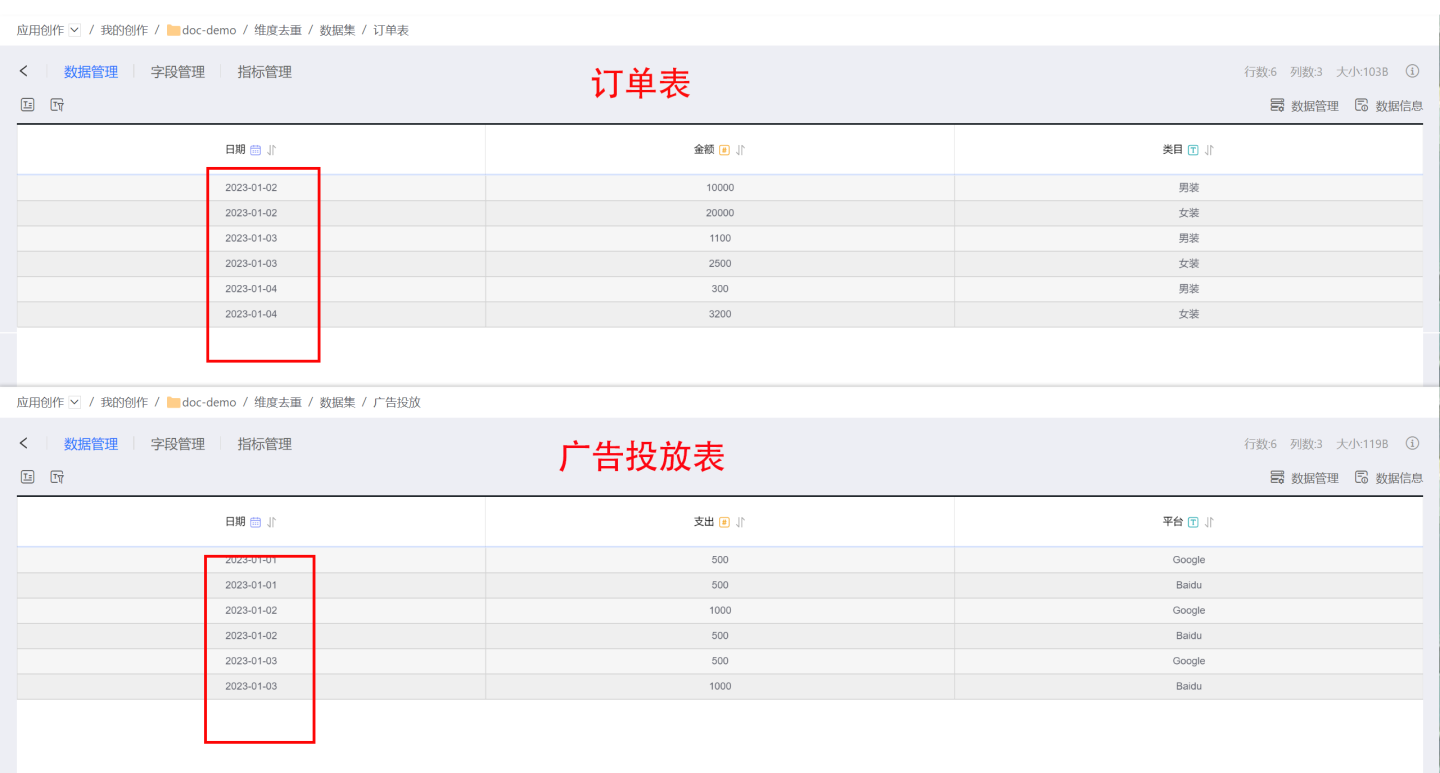
Directly using the date field for many-to-many association and chart analysis, the resulting association and chart data will inflate, with the total advertising spend being only 4000, but the aggregation result being 6000. 
When dimension deduplication is enabled, the model can then calculate that the actual advertising spend for the order dates is only 3000. 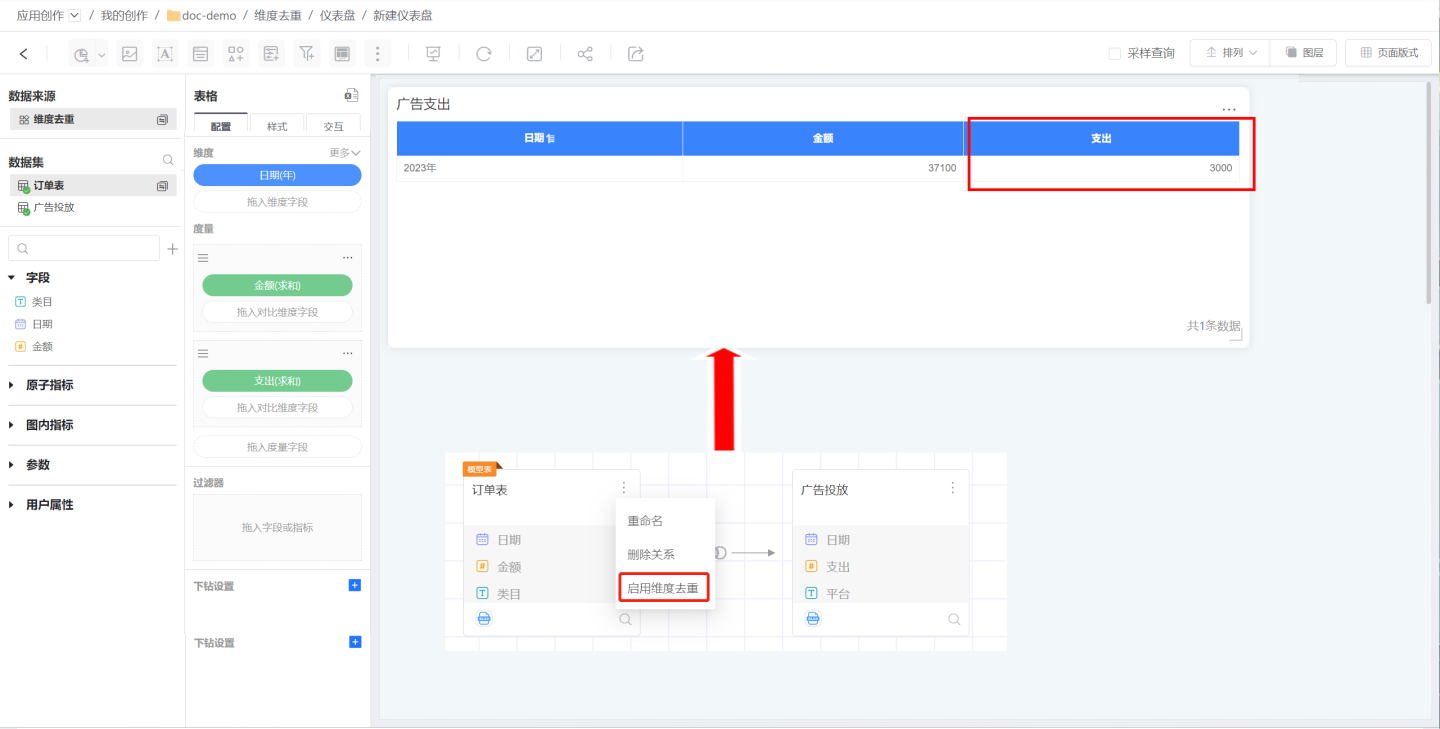
Tip
The dimension deduplication feature supports enabling and disabling based on the needs of data analysis. When using the dimension deduplication feature, it is important to understand which data has inflated and which inflated data is being eliminated.
Preview Data
Click Preview Data at the bottom right of the data model area to instantly preview the data after the associated model takes effect:
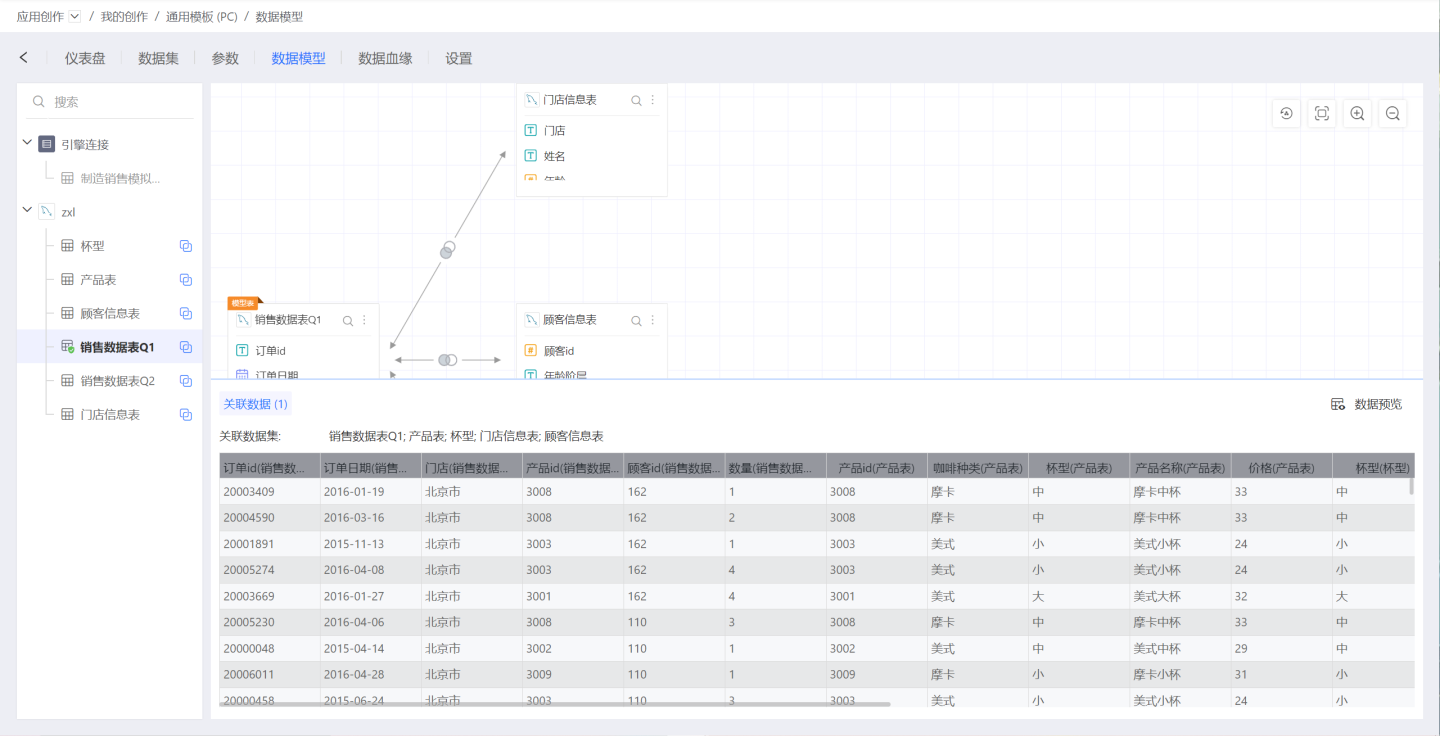
Delete Relationship
There are two ways to delete a relationship:
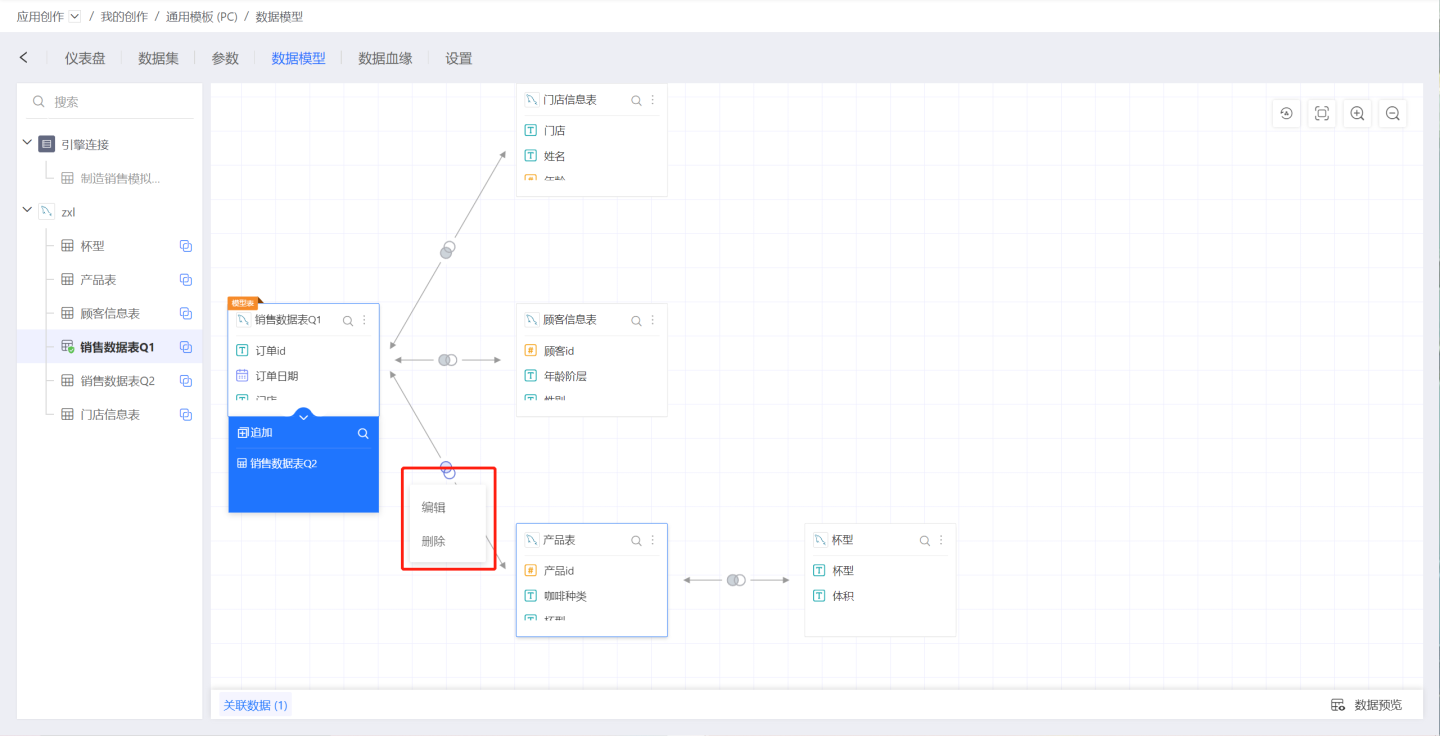
- Click on the association icon, and select
Deletefrom the pop-up menu to delete a single relationship. When deleting a single relationship, other relationships associated with the deleted linked table will also be deleted. This means that there will be no relationships in the data model that are independent of the model table; any dataset will be linked to the model table through one or more chains.
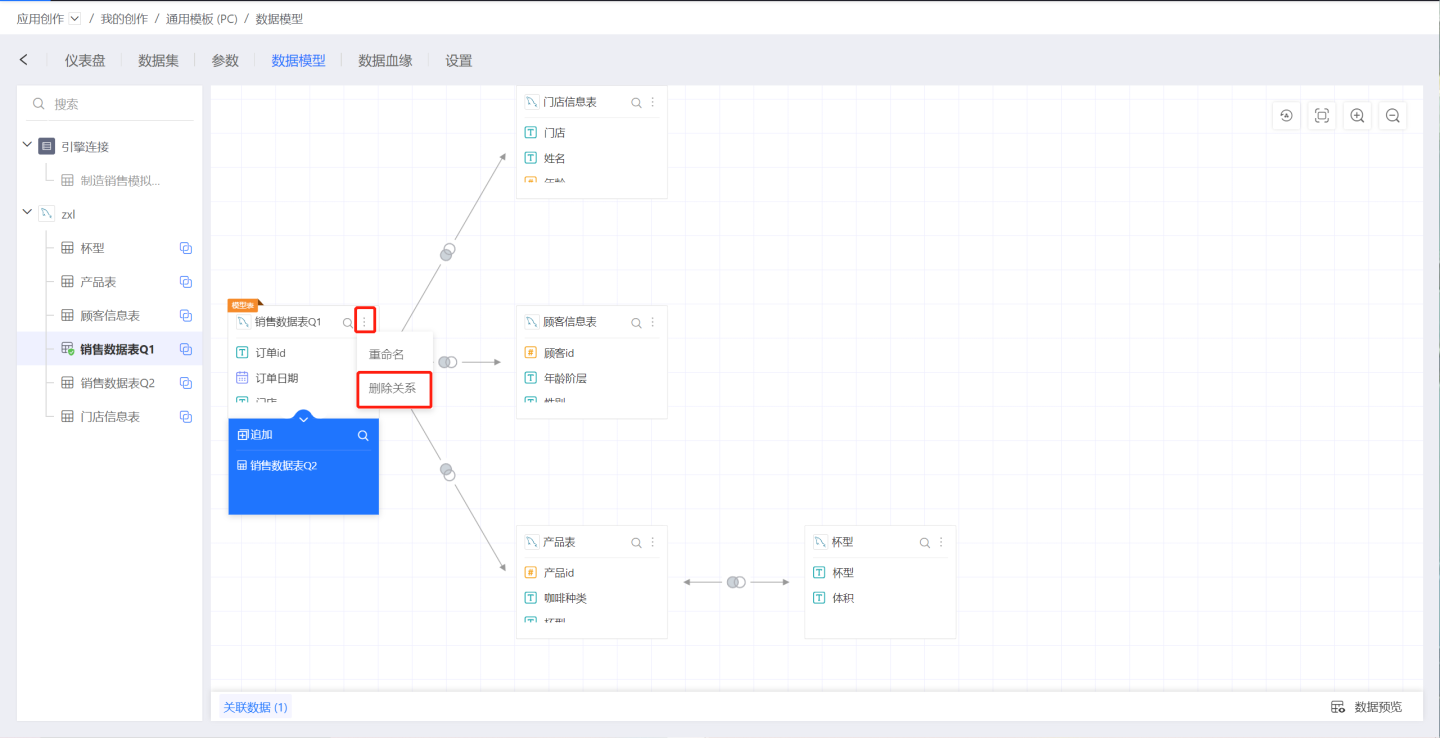
- Click the three-dot menu in the upper right corner of the dataset, and click
Deletein the pop-up menu, which will delete all relationships associated with that dataset.
Cross-Dataset Metric Creation
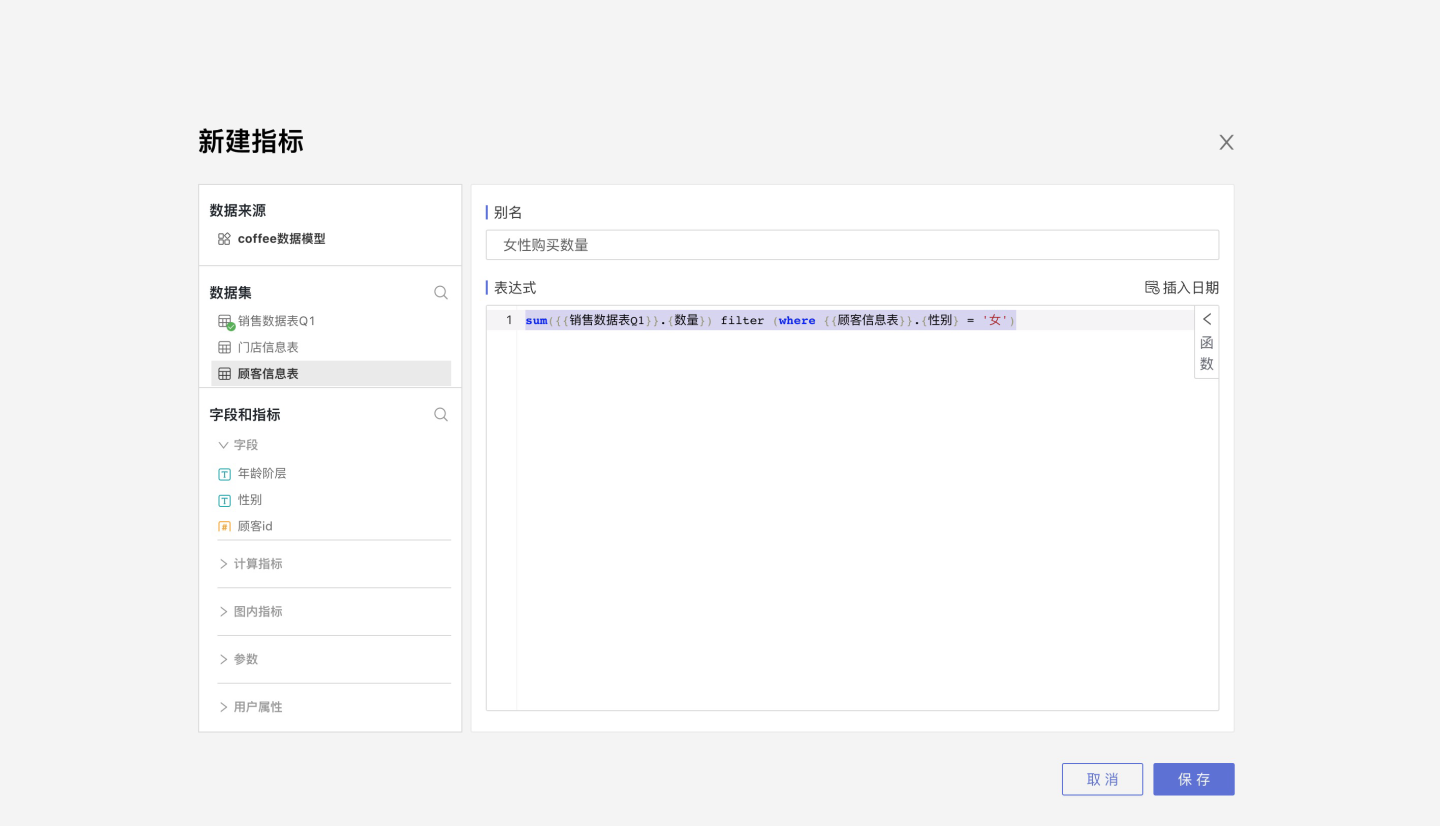
Open the model table dataset, select New Metric, and you can use fields from related tables in the metric expression.
Within a model, you can only create metrics for the model table, not for related tables.
The metric in the image below uses fields from two datasets:
Dataset Reuse
Reuse of the Same Dataset
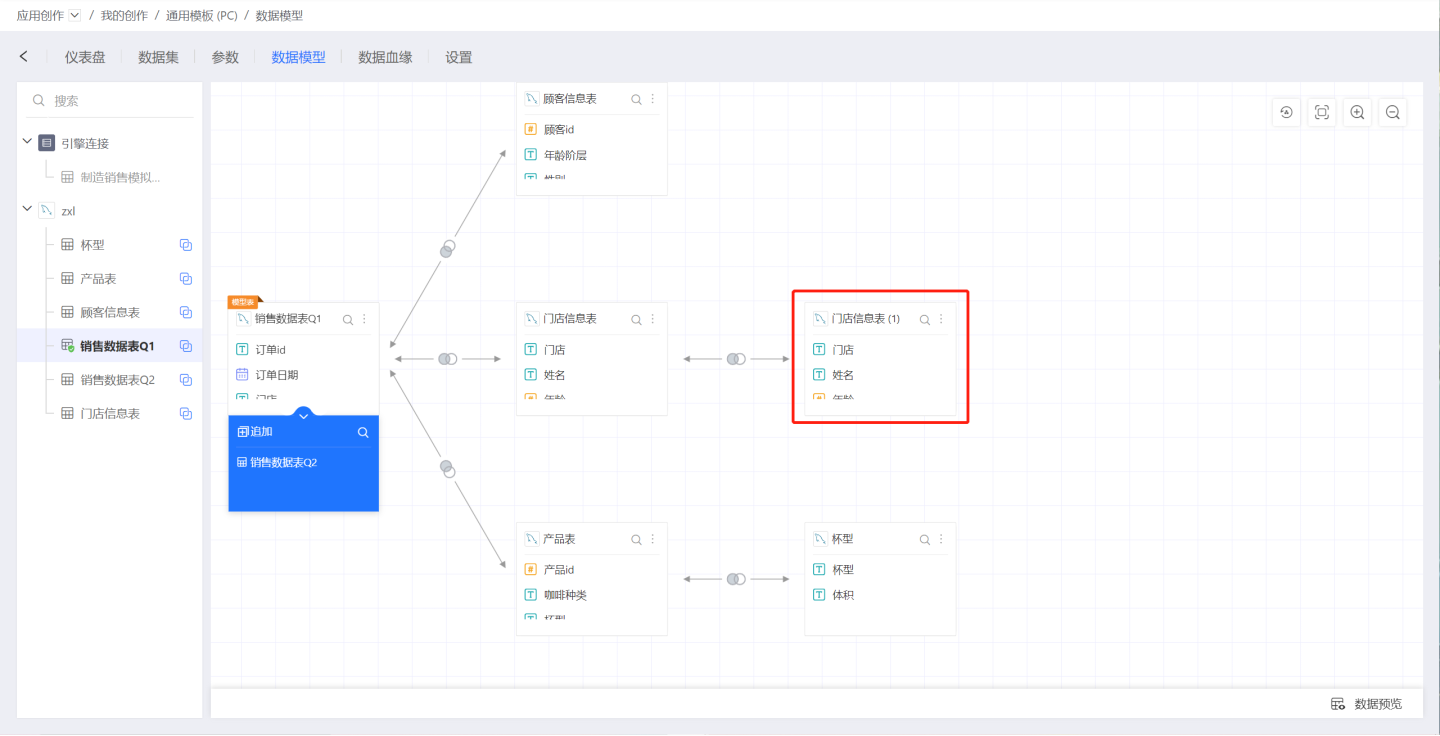
In a data model, the same dataset can be dragged in multiple times. When dragged in subsequently, the data name will automatically be appended with (1), (2), etc. As shown in the image below, when the Store Information Table is dragged in for the second time, it automatically gets appended with (1), becoming Store Information Table(1).
The reuse of datasets is mainly applicable for scenarios where dimension tables/dictionary tables are self-associated to achieve multi-level hierarchies. For example, in an employee table, the employee manager ID is self-associated with the employee ID to query who the manager of a certain employee is.
In the image below, the datasets for Level 1, Level 2, and Level 3 are all reuses of the Dictionary Table dataset. They are associated with each other using parentid and id, querying level by level up to the highest parent level. They are associated with the order table, allowing for the statistics of sales at various levels.
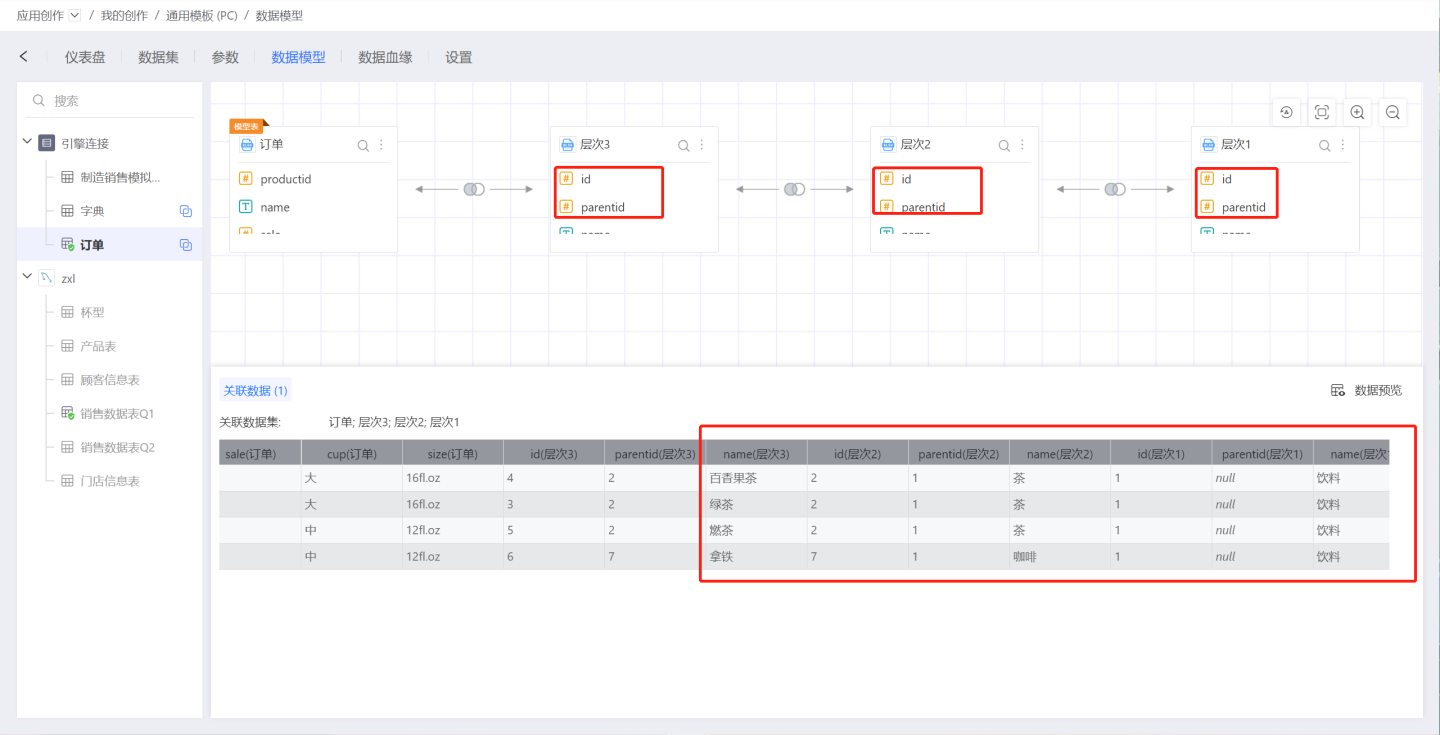
Aggregated Dataset Associated with the Main Table
When an aggregated dataset only uses fields from the main table, it can be associated with the main table's data model, allowing for detailed filtering and viewing of the main table. After dragging the aggregated dataset of the main table into the main table's data model, situations such as circular references may occur, prompting the user with a warning message. Below are some scenarios where errors will occur when dragging the aggregated dataset of the main table into the main table's model.
In the main table's data model:
- If the aggregated dataset of the main table uses fields from datasets other than the main table, this aggregated dataset is not allowed to be added to the main table's model.
- If the aggregated dataset of the main table is dragged into the model and the activation mechanism is set to always associate, this aggregated dataset is not allowed to be added.
- If there is an aggregated dataset of the main table in the upstream datasets of the model, the activation mechanism of the downstream datasets is not allowed to be set to always associate; if set to always associate, it is not allowed to be added.
When appending data to datasets in the model:
- The aggregated datasets of the main table in the model are not allowed to perform vertical merge operations or append data.
- When performing vertical merge operations on other datasets in the model, fields from the aggregated datasets of the main table cannot be appended.
When the aggregated dataset of the main table is dragged into the model:
- If non-main table fields from the model are added when editing the aggregated dataset of the main table, an error will be reported.
- An error will be reported when replacing the aggregated dataset of the main table with a secondary table from the model.
Dataset Renaming
In the data model, you can click Rename in the upper right corner of the dataset to rename the dataset. The renamed dataset is essentially a new referenced dataset, and it will not affect the charts made using the original dataset during linked filtering.
Linked Filtering
Tip
Linked filtering will occur as long as the dataset names are the same.
This rule applies to both linked filtering and dashboard filters.
Data Model Performance Optimization Guide
- When using direct connection: Use narrow tables instead of wide tables, remove unnecessary fields, reduce scanning, and decrease memory usage.
- For fusion and other processed tables, store them as engine tables, also removing unnecessary fields to speed up the import process.
- When using direct connection, materialize calculated fields in the original table to avoid computation during chart creation.
- When joining, prefer using numbers for joining, such as using department ID instead of department name. Databases optimize performance for numbers.
- Generate aggregated tables and import them into the engine: For example, aggregate order tables by customer, day, and product, and even by month.
- Create indexed views and add indexes to the views.
- In the source database, create a new date dimension table, pre-calculate year, quarter, month, week, and day, ensure the date covers the dates in the fact table, and join the date dimension table with the fact table. Use the date dimension table for filtering.
- Reduce type conversions; set the correct types when creating the table.
- Do not use calculated fields for joining. One reason is that calculated fields are time-consuming, and another reason is that calculated fields do not have indexes.
- Aggregate first, then join, to reduce the join cardinality.
- When joining: Use one-to-one or one-to-many relationships, and avoid many-to-many relationships as they can cause duplicate calculations and potentially incorrect aggregation results.
Differences Between Data Models and Fusion Datasets
- Fusion can materialize entity tables, focusing on analytical performance.
- Data models display datasets when creating charts, facilitating field identification, focusing on analytical convenience.
- During queries, Fusion uses all base tables, while models only query the used datasets.
You can use data models for exploratory analysis, and after determining the analysis model and data, use Fusion to materialize only the necessary fields into entity tables.