Reference Line
Reference Line Significance
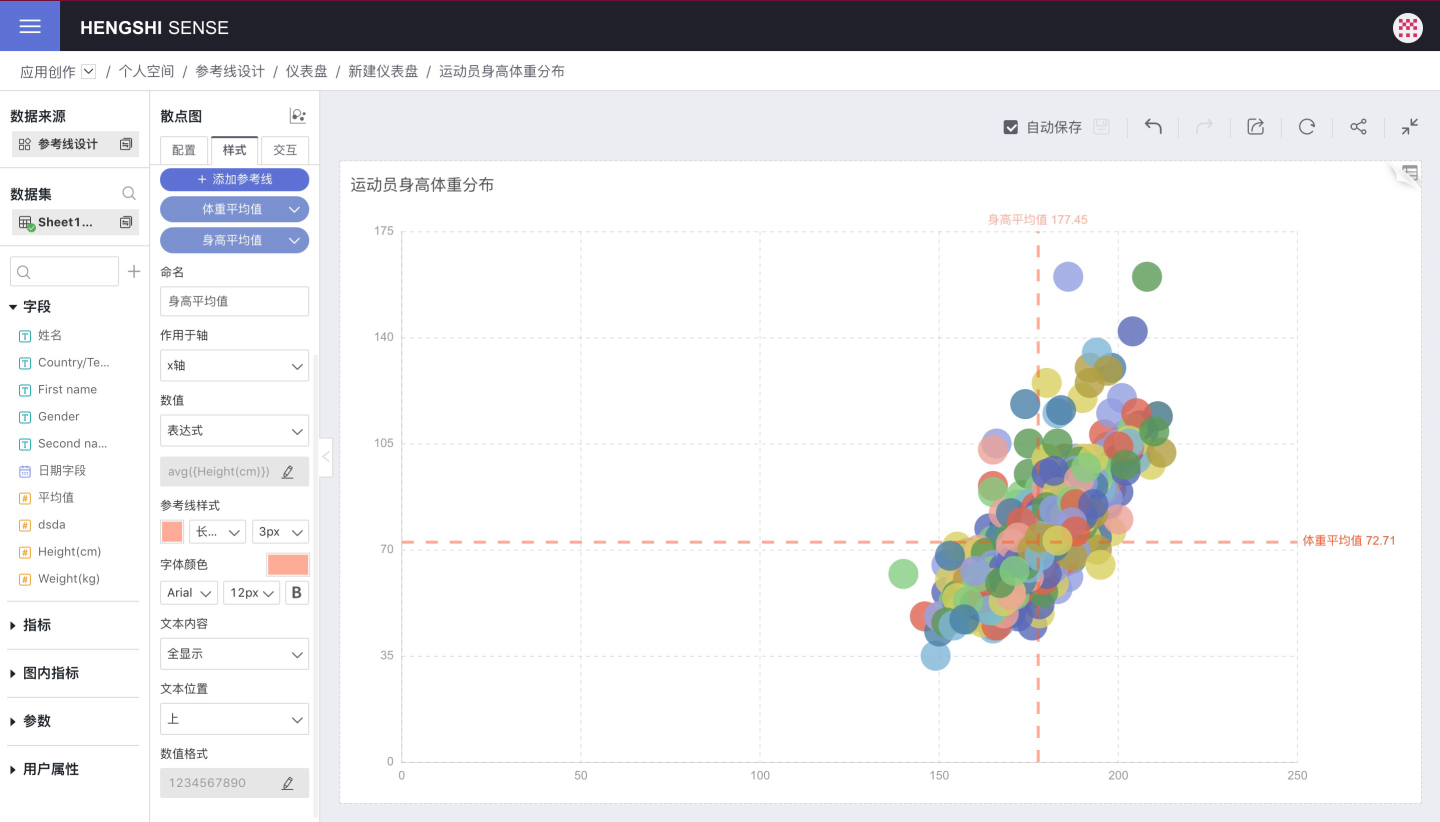
- Sample distribution within a certain range
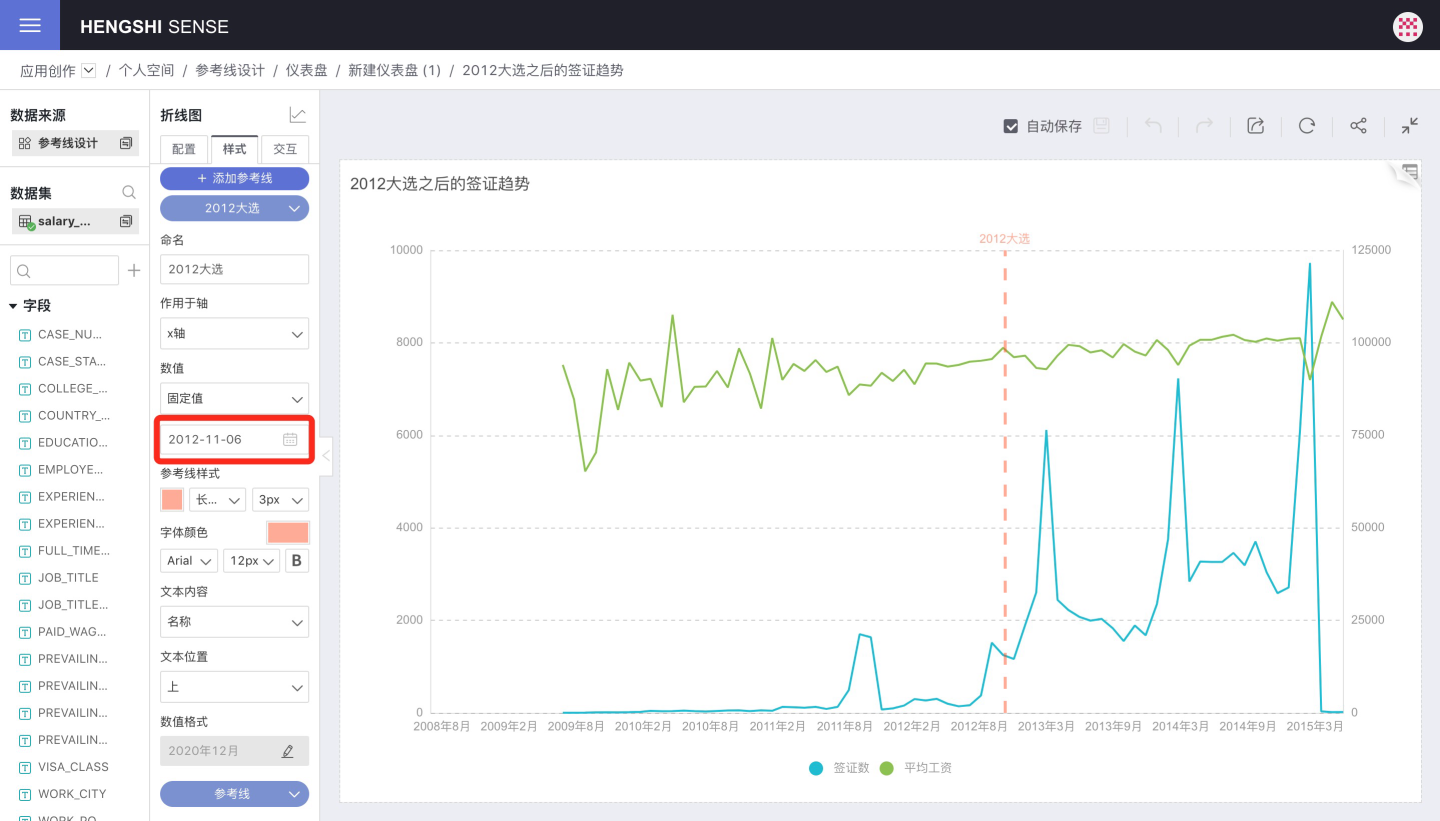
- Changes in indicators after a marketing campaign or special date
Applicable Charts for Reference Lines
Reference lines are applicable to two-dimensional coordinate charts, including:
- Various bar charts: X-axis, Y-axis
- Clustered bar charts: X-axis, left Y-axis, right Y-axis
- Various horizontal bar charts: X-axis, Y-axis
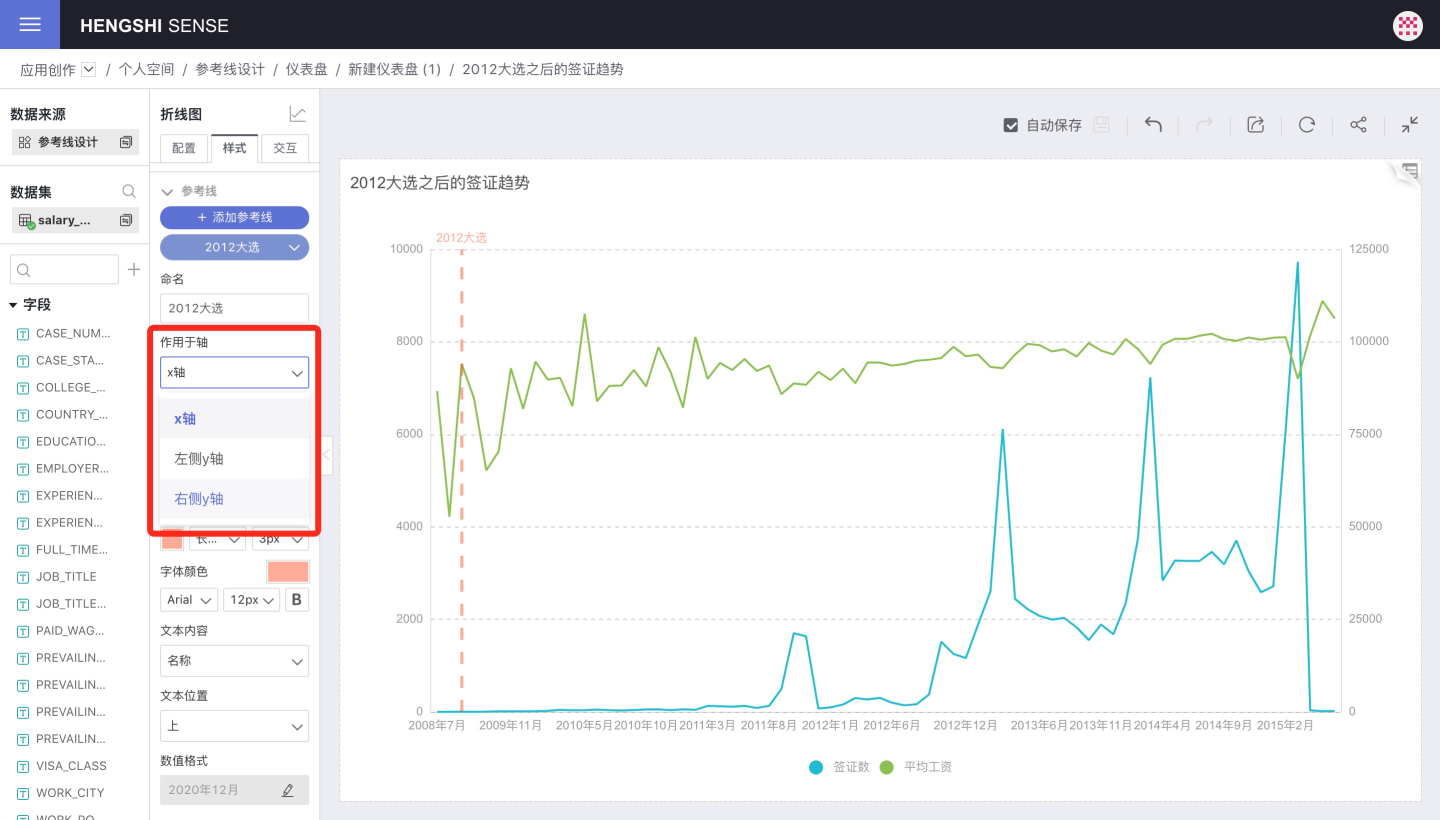
- Line charts: X-axis, left Y-axis, right Y-axis
- Line and bar charts: X-axis, left Y-axis, right Y-axis
- Scatter plots: X-axis, Y-axis
- Area charts: X-axis, Y-axis
- Waterfall charts: X-axis, Y-axis
- Combination charts: all X-axes, Y-axes (not yet supported)
Only when the reference line value falls within the axis range will it be drawn.
Reference Line Values
Dimension Axis Reference Line
- Fixed value: can input constants
- Expression: can input constants or aggregate expressions that return constants, fields, metrics, parameters, and user attributes can be used in the expression, but not chart-specific metrics
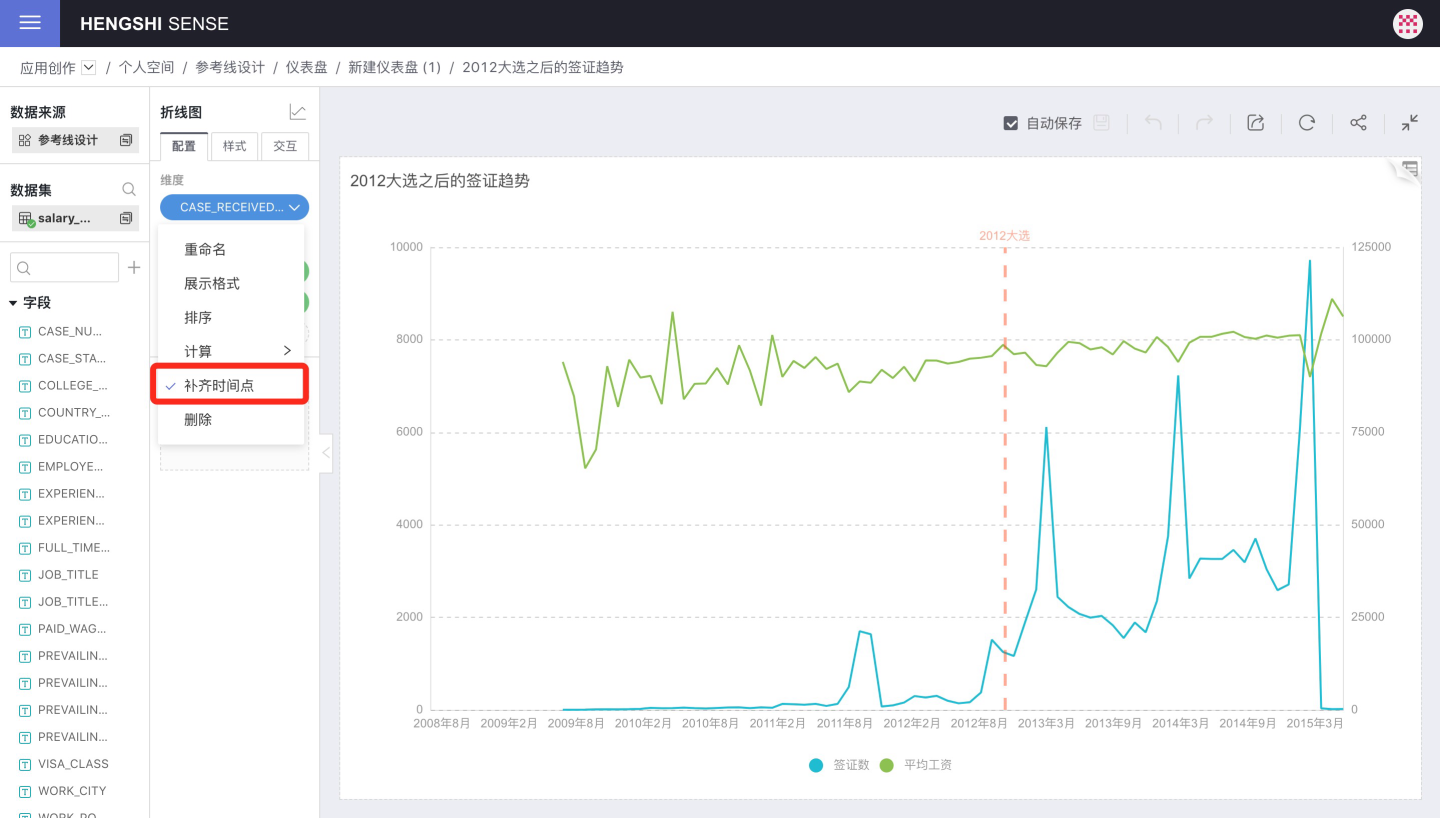
When the dimension is a date, if "Fill Time Points" is selected, the date axis becomes a continuous axis. If within the date axis range, it will be displayed on the axis. For example, if the dimension calculation method is month, but the reference line value is set to a date with a daily unit, such as "2012-11-06", that date will be displayed proportionally between November and December 2012. If "Fill Time Points" is not selected, the axis becomes a discrete axis, and "2012-11-06" will not be displayed on the axis, with the first day of each month, such as "2012-11-01", being displayed as the month on the axis.
Measure Axis Reference Line
- Fixed value: can input variables
- Calculated value: average/maximum/minimum/percentile of chart-specific metrics
- Expression: can input constants or aggregate expressions that return constants, fields, metrics, parameters, and user attributes can be used in the expression, but not chart-specific metrics
Color
Reference lines can set color and opacity.
Relationship Between Reference Lines and Filters
If the reference line type is "Calculated Value", the reference value is calculated by the frontend based on the chart data returned by the backend. In this case, the context of the reference line is the chart data, and all filters will be applied to the chart data, thereby affecting the reference line value.
If the reference line type is "Expression", the reference value is calculated by the backend based on the dataset detail context. In this case, the context of the reference line is the dataset detail data:
- Field/metric filters in the chart will be applied to the reference line
- Dashboard filters will be applied to the reference line
- Chart-specific metric filters will not be applied to the reference line
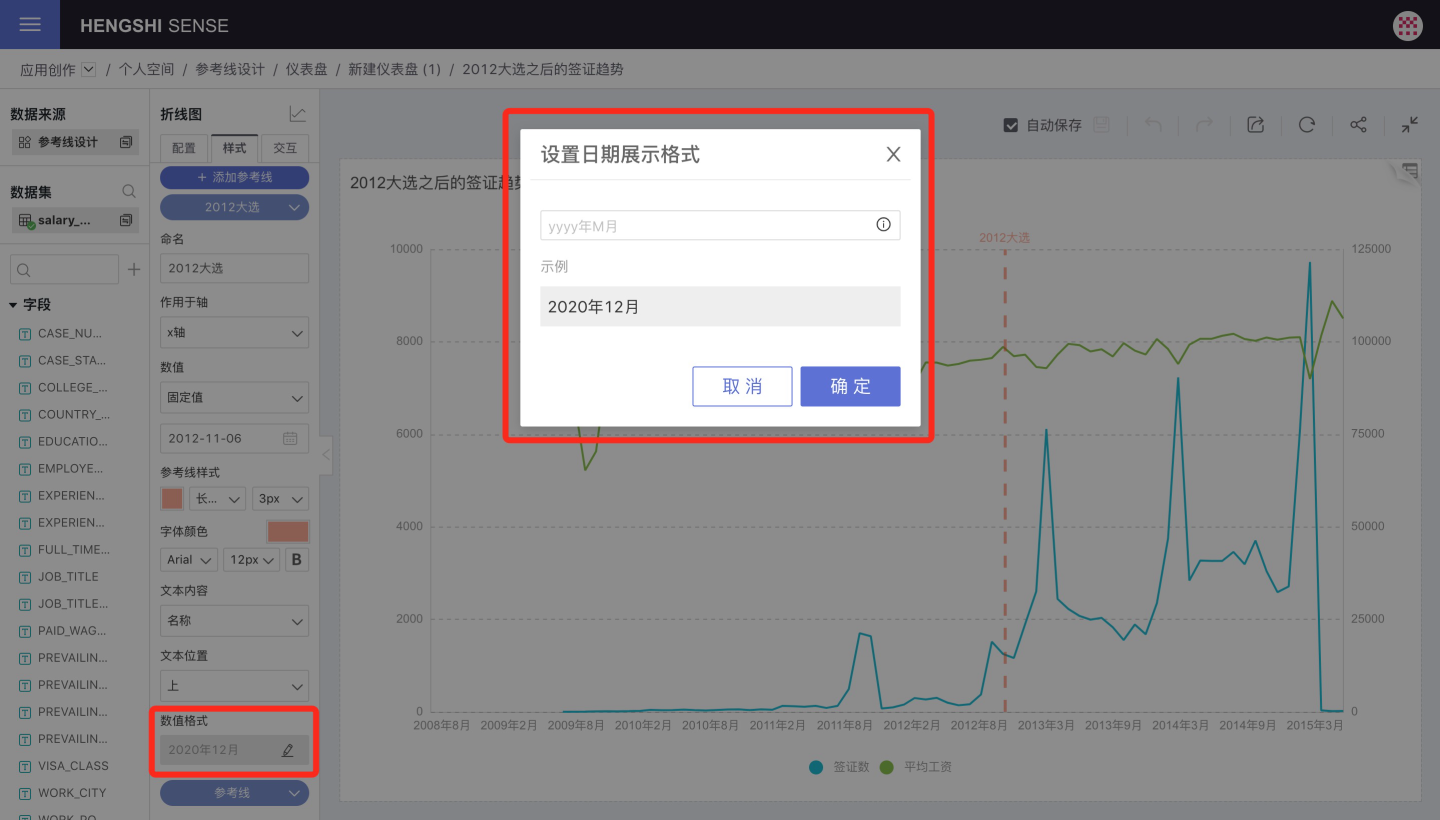
Value Format
The value of the reference line can be set to display format, and the display format popup is determined by the type of the axis:
- If the axis is of numeric type, the popup is a numeric format popup
- If the axis is of date type, the popup is a date format popup
- If the axis is of text type, the reference line does not have a display format menu
