Crosstab
Cross-tab is a basic form of table presentation, consisting of row fields, column fields, and measures, commonly used in scenarios where information within fields needs to be grouped and displayed. It supports various aggregation calculations on data (sum, average, maximum, minimum, count, distinct count, etc.), and supports various interactive operations such as linkage and jump.
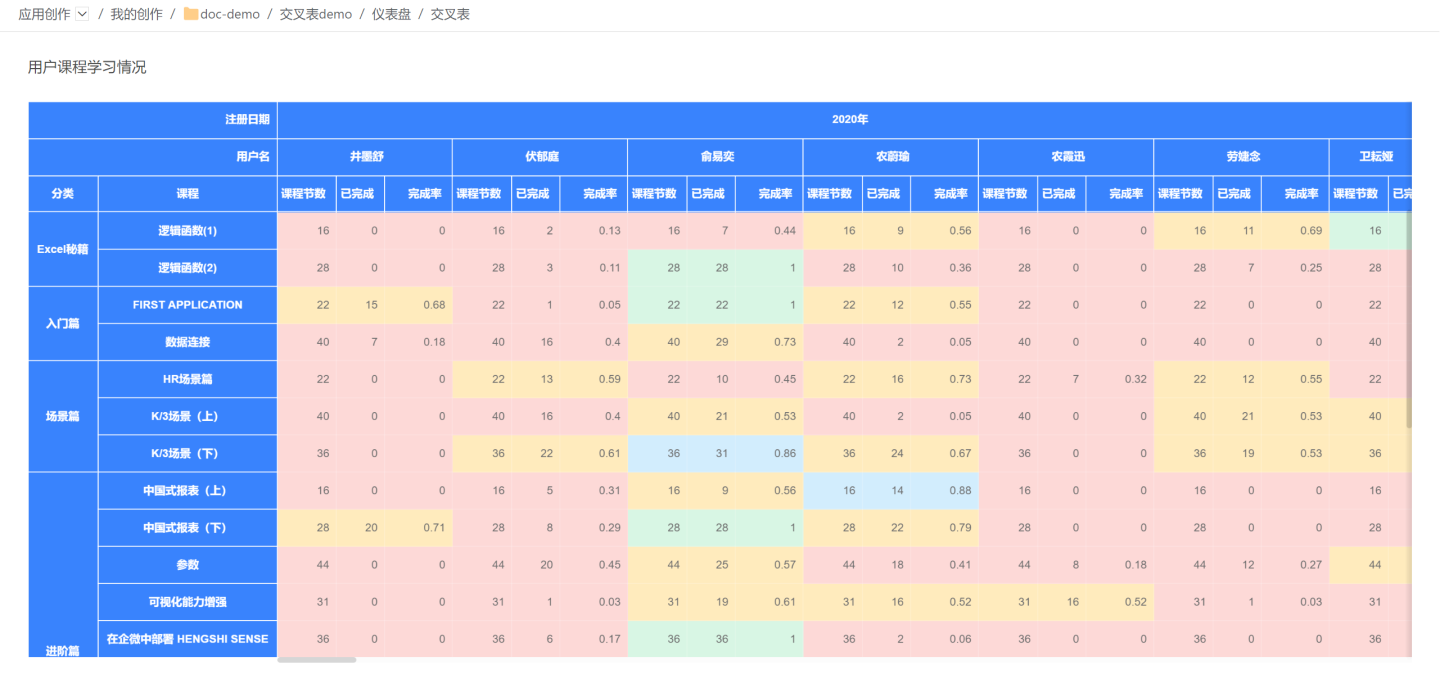
Cross Table Introduction Example
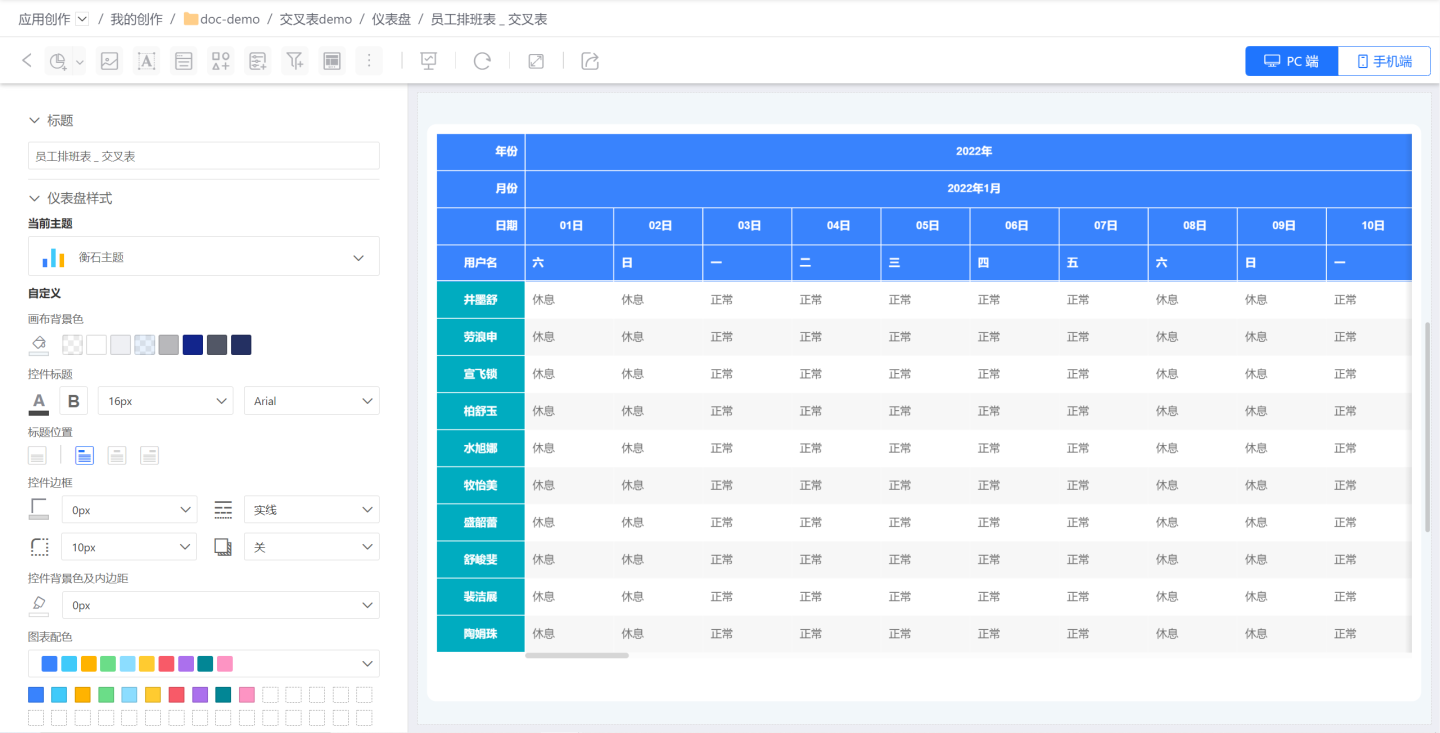
Below is an example of creating a simple cross-tabulation using an employee schedule table.
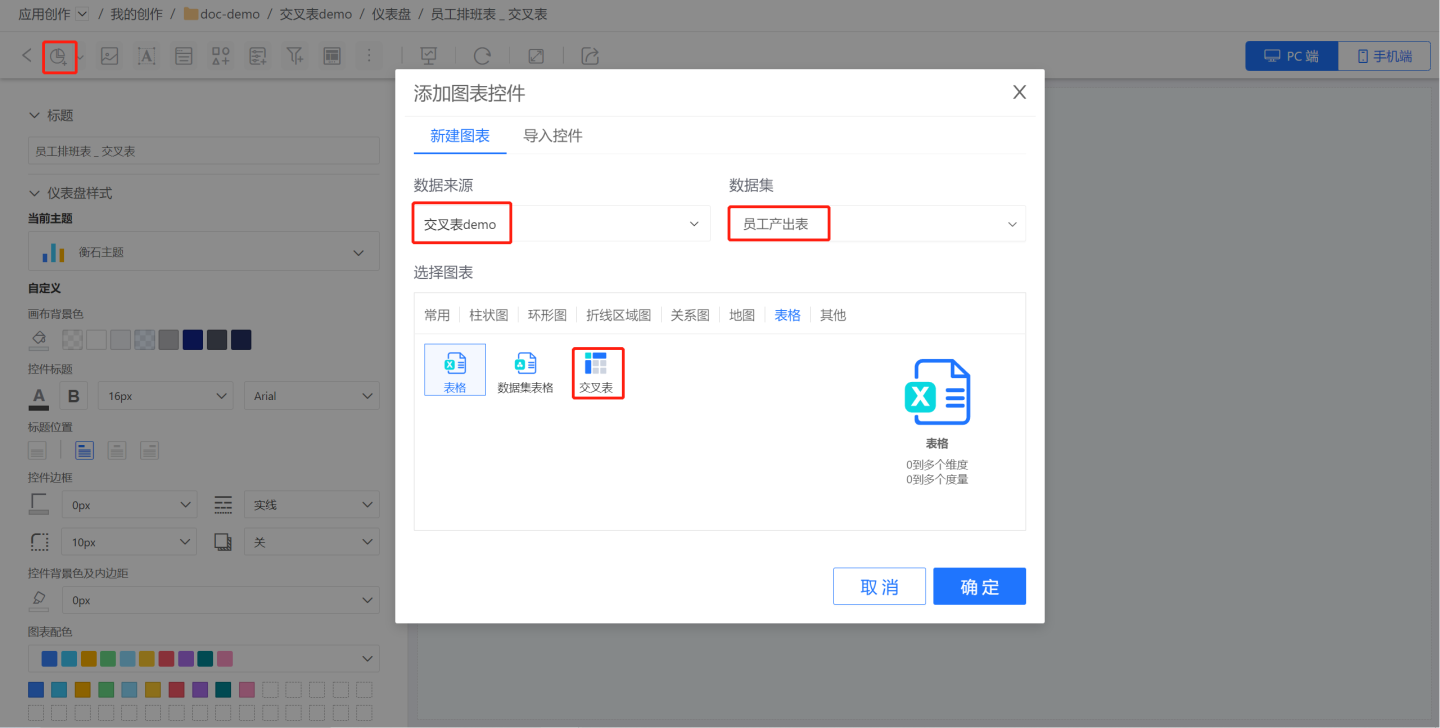
- In the dashboard, click New Chart -> Cross-Tabulation, select the data source and dataset, and click OK.
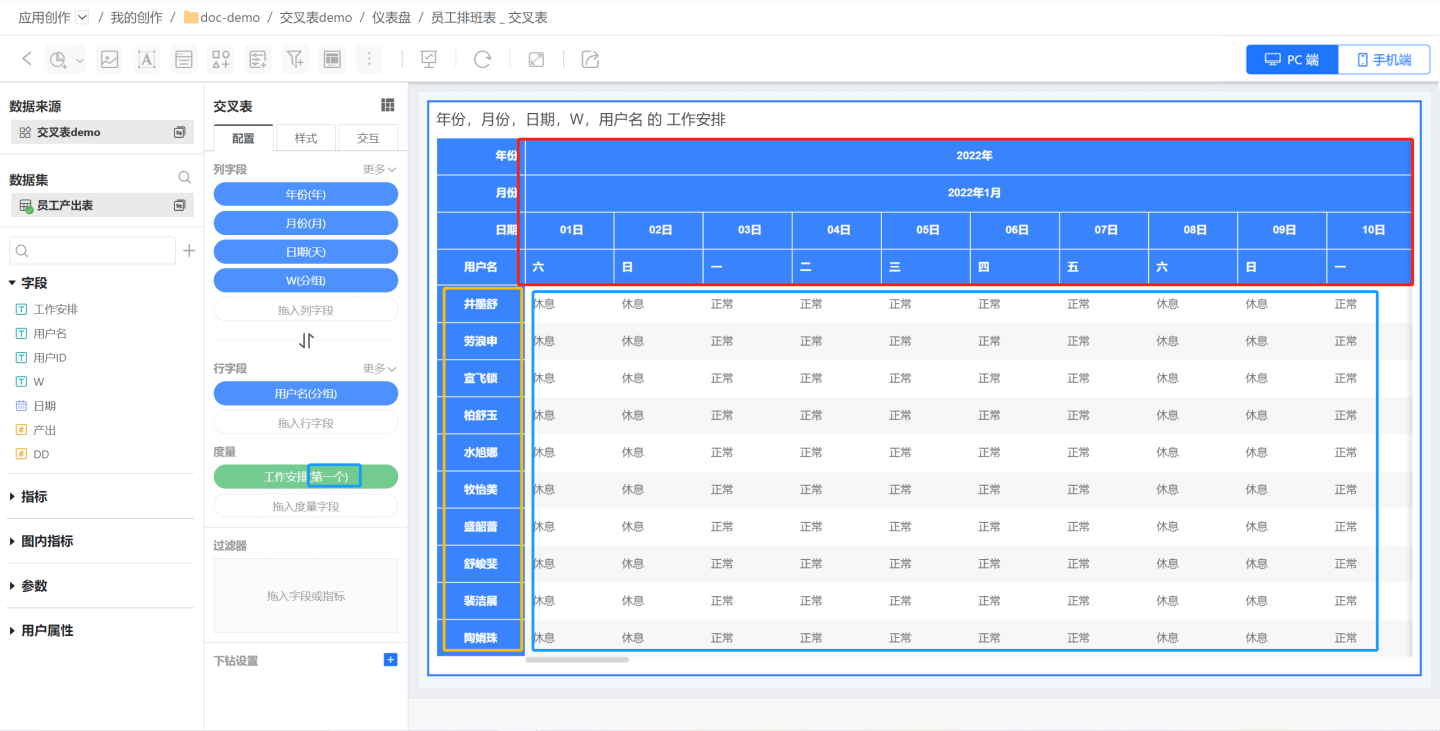
- Drag in the column fields, row fields, and measures to generate the cross-tabulation. The cross-tabulation will only render after all three fields (column fields, row fields, and measures) are configured.
- First, drag in the column fields Year, Month, Date, and Day of the Week to display the employee's schedule dates (red box area).
- Next, drag in the row field Employee Name to display the employee names (yellow area).
- Finally, drag in the measure field Work Arrangement to display the employee's attendance on a specific day. Select the first measure to display the measure content in text format.
- Set the Style and Interaction Operations of the cross-tabulation to complete its creation.
Cross Table Configuration
The column fields and row fields of the cross table are configured independently and do not affect each other. You can switch between column fields and row fields using the conversion button.
The rendering method of the cross table differs from other tables. It requires the configuration of column fields, row fields, and measure fields before the table can be rendered. When only column fields or row fields are dragged in individually, the cross table will not render.
Column Field
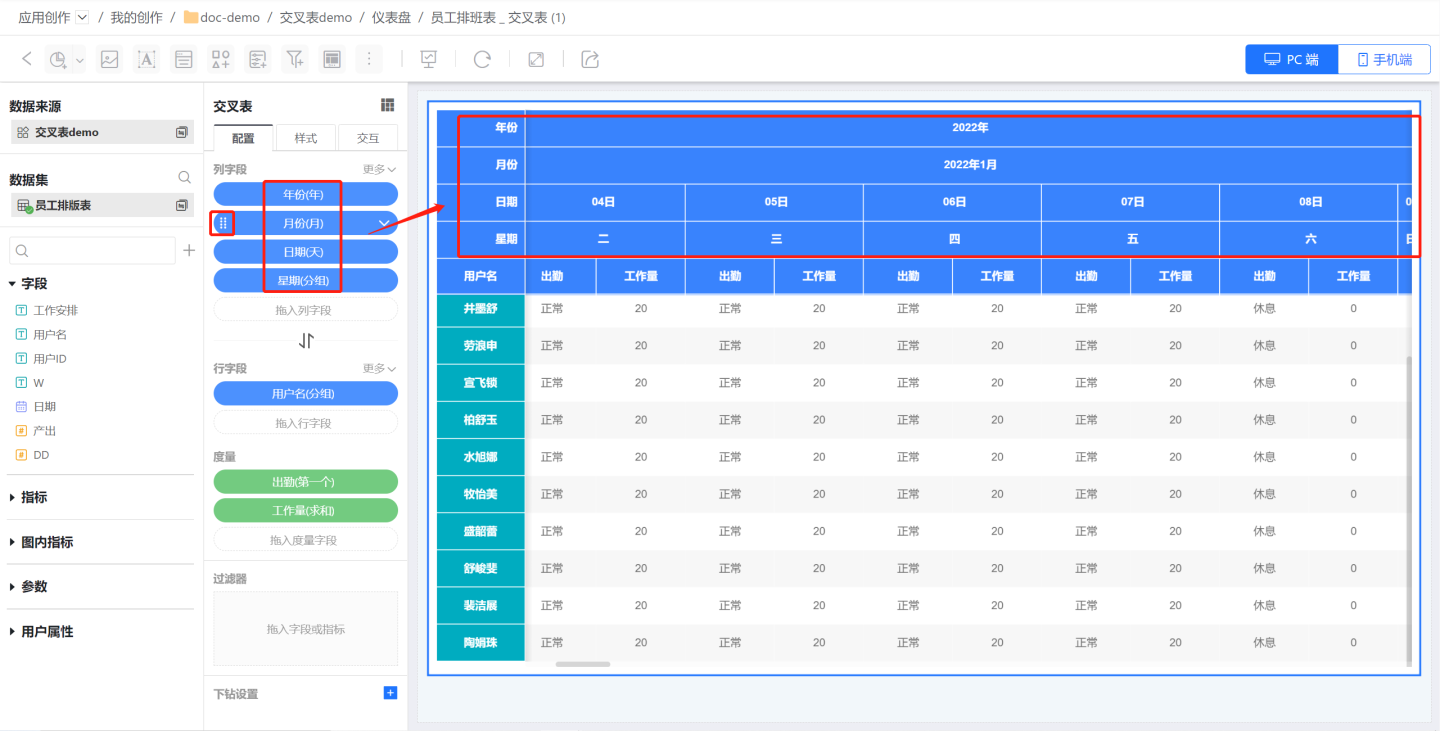
Columns are used to render the top header.
- Add Column Fields
- Add multiple column fields in order, which are arranged from top to bottom in the cross table, and the order of column fields can be manually adjusted.
- Users can modify the field names.
Row Fields
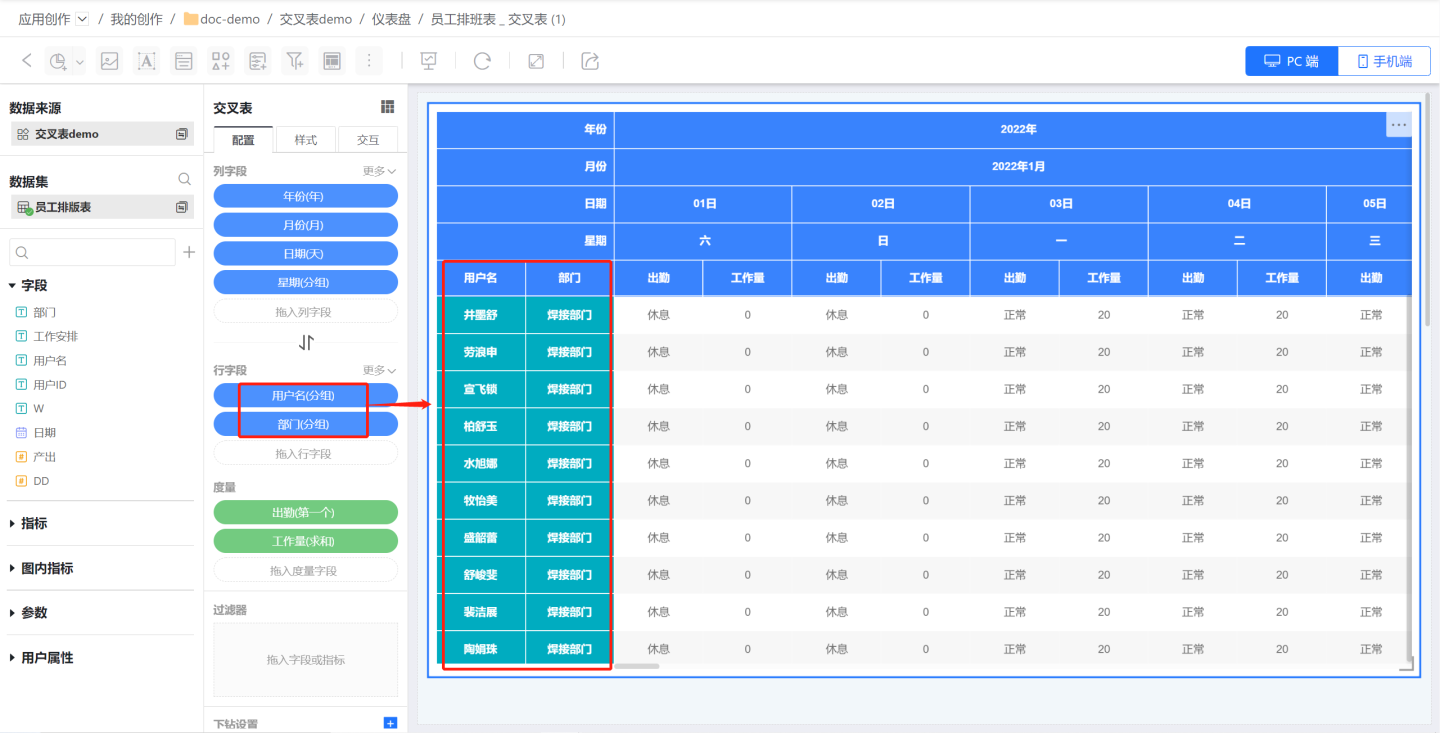
Row fields are used to render the left-side headers and can be switched with column fields with one click. 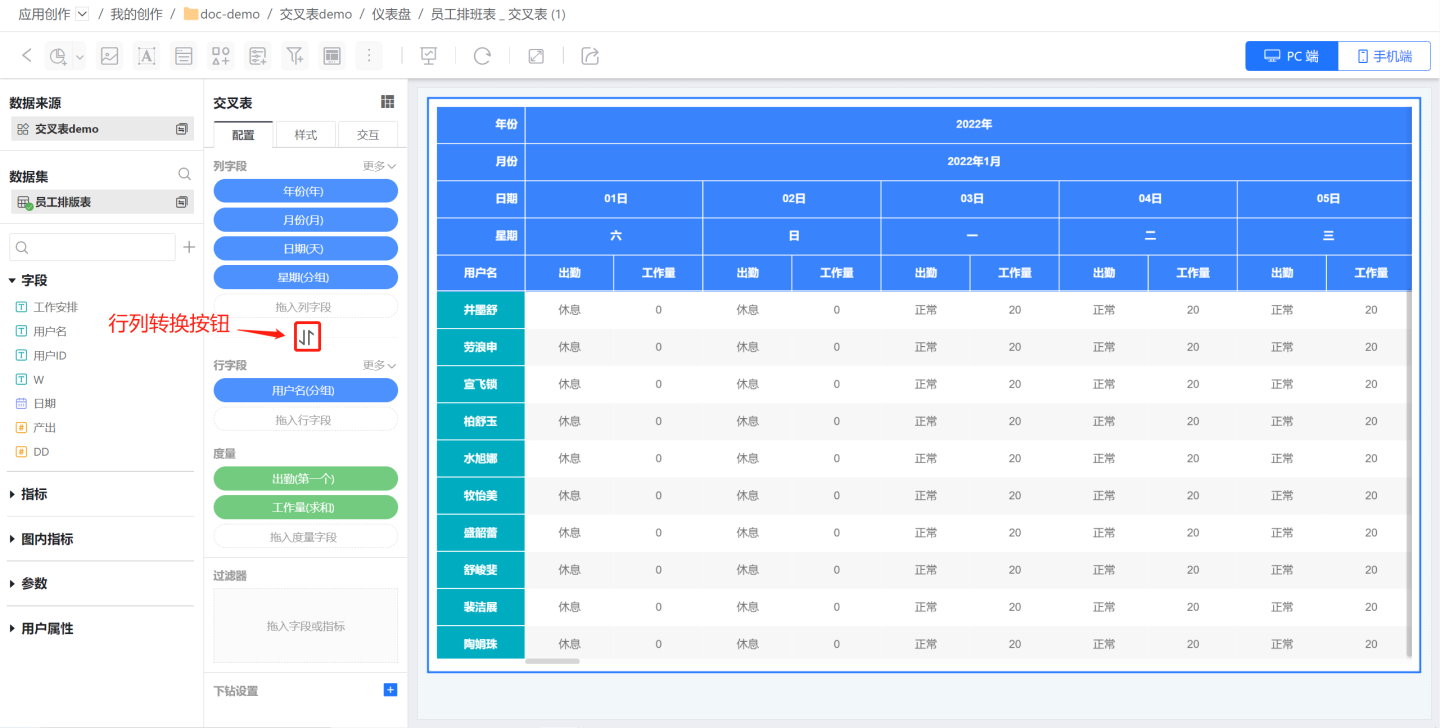
- Add Row Fields
- Add multiple row fields in sequence, which are sorted from left to right in the cross table, and the order of row fields can be manually adjusted.
- Users can modify the field names.
Field Sorting
The sorting basis for cross table fields is the same as that for table fields. Please refer to Table Field Sorting Instructions for sorting operations.
Subtotal
Cross-tab supports the addition of subtotal functions, allowing for the addition of subtotals for column fields and row fields.
Column Field Subtotal
Click the More button on the right side of the column field -> Show Subtotal, the subtotal setting interface pops up, edit the subtotal name, and select the field to be subtotaled. 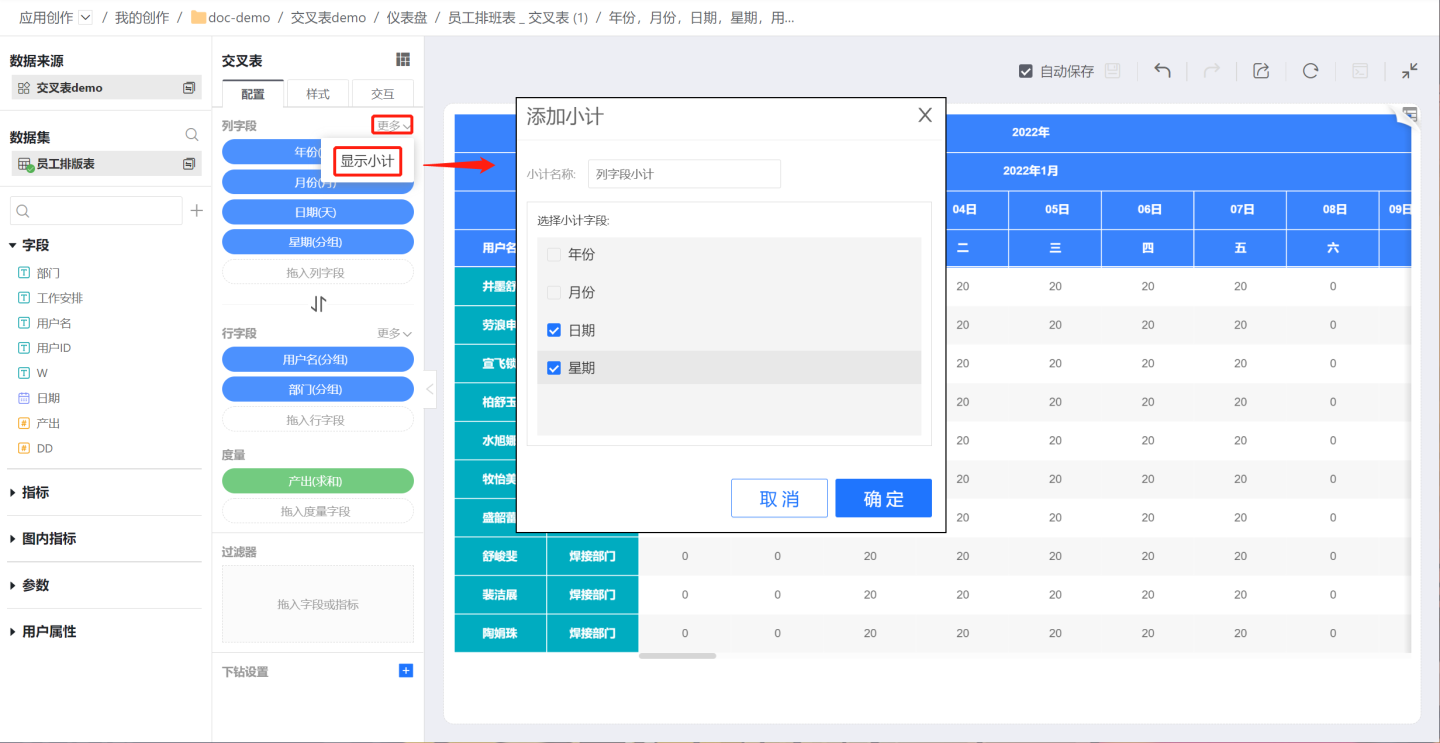
Subtotals for columns can be displayed on the left or right, adjusted through Style -> Subtotals.
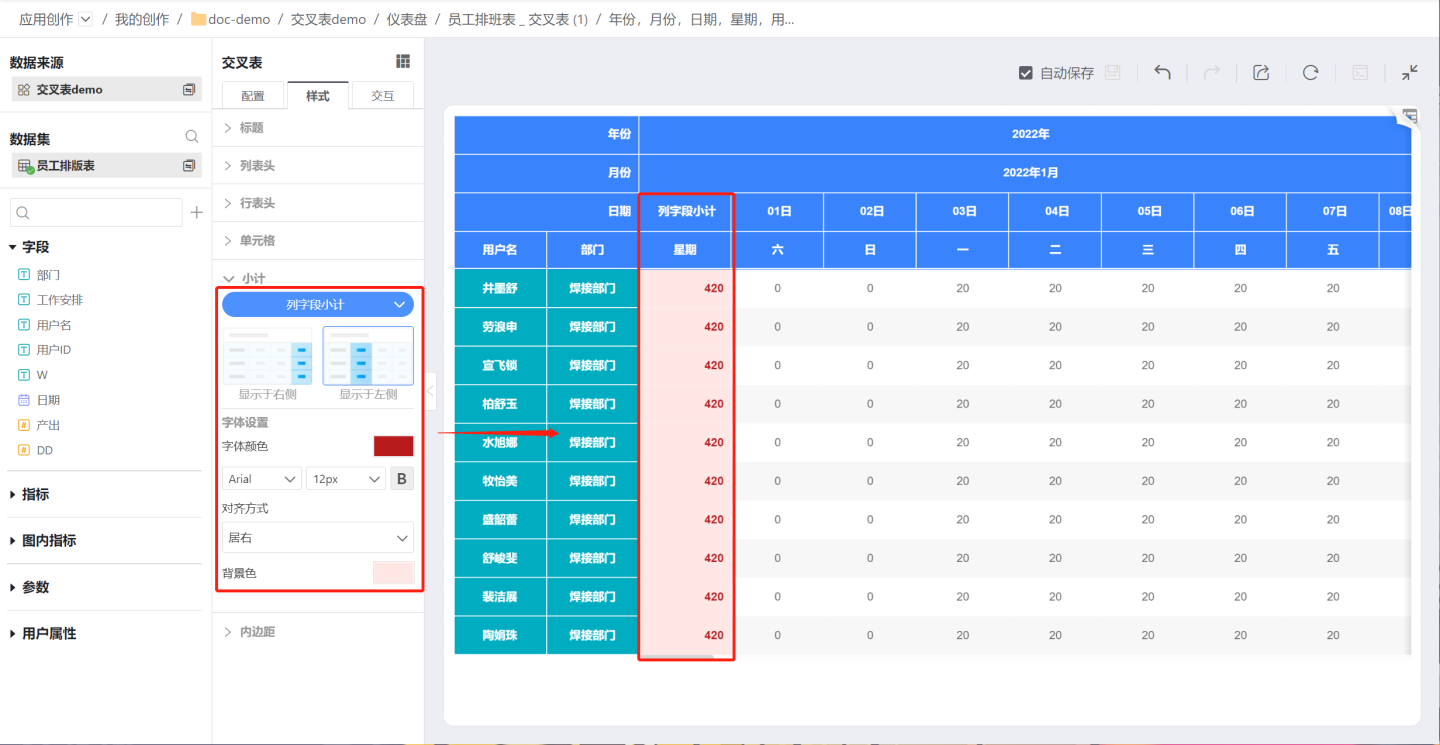
Subtotals for Rows and Columns
Click the More -> Show Subtotal on the right side of the row field, and the subtotal setting interface will pop up, where you can edit the subtotal name and select the field to be subtotaled.

Row subtotals can be displayed at the bottom or top, adjust the subtotal style through Style -> Subtotals. 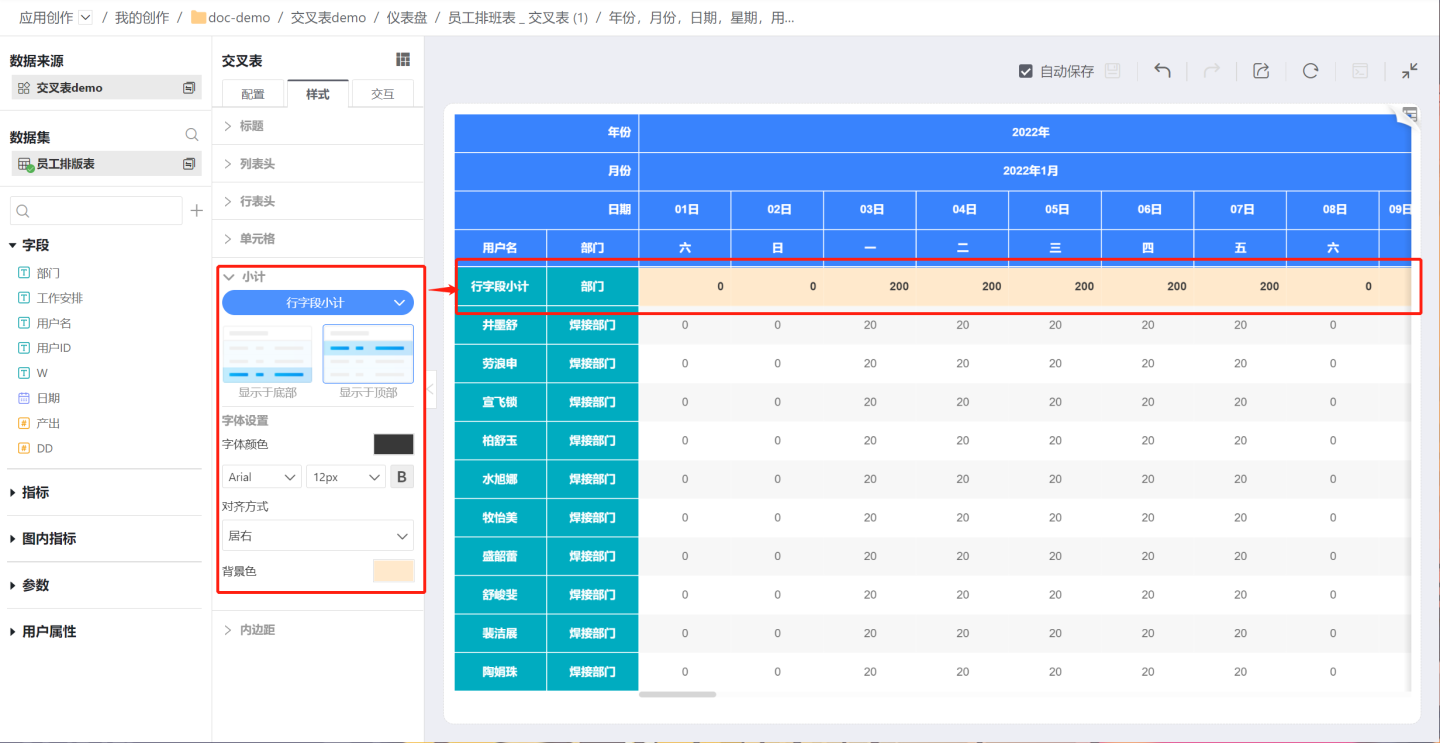
Measures
The measures in the cross table are displayed within the measure area, where one or more measures can be shown. When multiple measures are present, the measure names are displayed; when only one measure is present, the measure names are not displayed. The measure fields in the cross table support renaming, setting display formats, and performing various aggregation calculations.
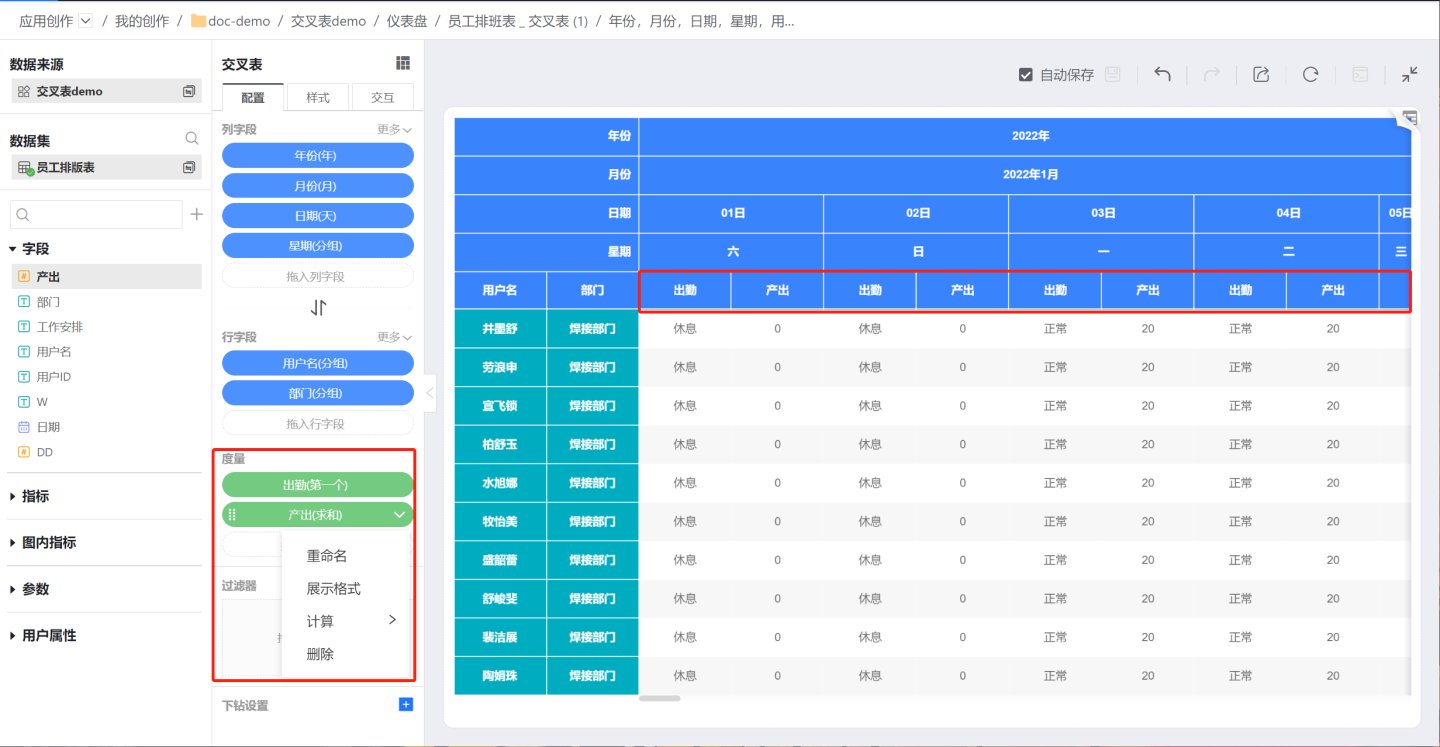
Cross Table Related Settings
Filter
Cross-tab supports adding filters within the chart. Please refer to the Filters in the chart documentation for setup.
Drill Down Settings
Cross-tab supports setting drill-down layers, please refer to the Chart Drill-down instructions for setup.
Cross Table Style
The cross table can display rich styles, allowing you to set titles, list headers, row headers, cells, subtotals, padding, etc. Please refer to Styles for specific operation methods.
Cross Table Interaction Operations
The cross table can set various interaction operations, such as scrolling, paging, click to pop up, etc. It also supports interaction with other charts, such as linking other charts, jumping, etc. Please refer to the documentation for guidance on interaction settings.
Cross Table Operations
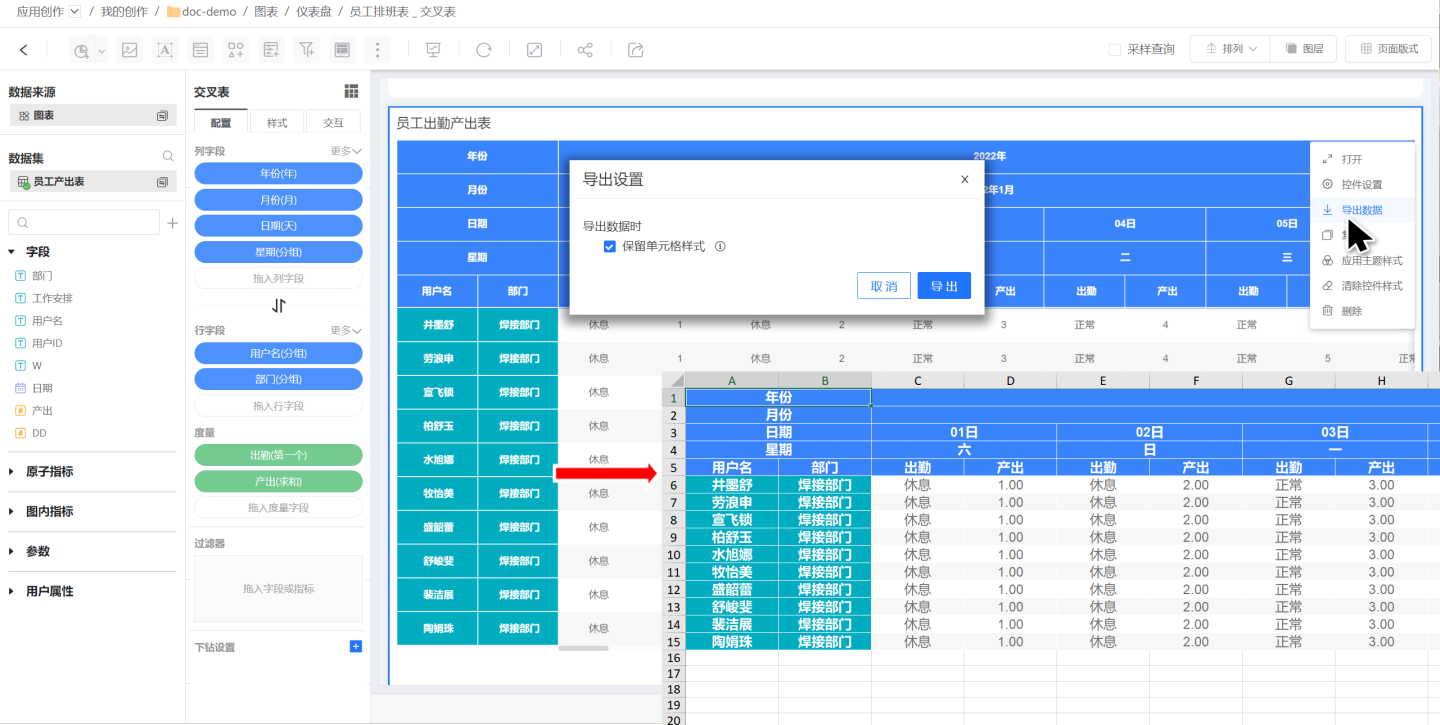
Cross-tab data export retains data types, facilitating secondary calculations on the exported data. Date type data supports processing using date functions, and prefixes and suffixes for numeric data do not affect calculation results.
Export supports setting whether to export cell styles, as shown in the figure.
