Indicator Analysis
After obtaining the business change indicator data, users can display it using charts to view business changes and understand business development trends. After building the business indicator system, the platform has also launched the indicator analysis module, customizing visual analysis dashboards for business indicators.
The indicator analysis module comes with a variety of business indicator templates. Users can drag business indicators into the canvas area to instantly generate charts, and switch chart types through point-and-click operations. The entire process does not require any further processing of indicator data, making it simple and easy to use. The business indicator analysis capability does not require data modeling skills from the analysts, lowering the BI usage threshold and enabling more users to participate in data analysis.
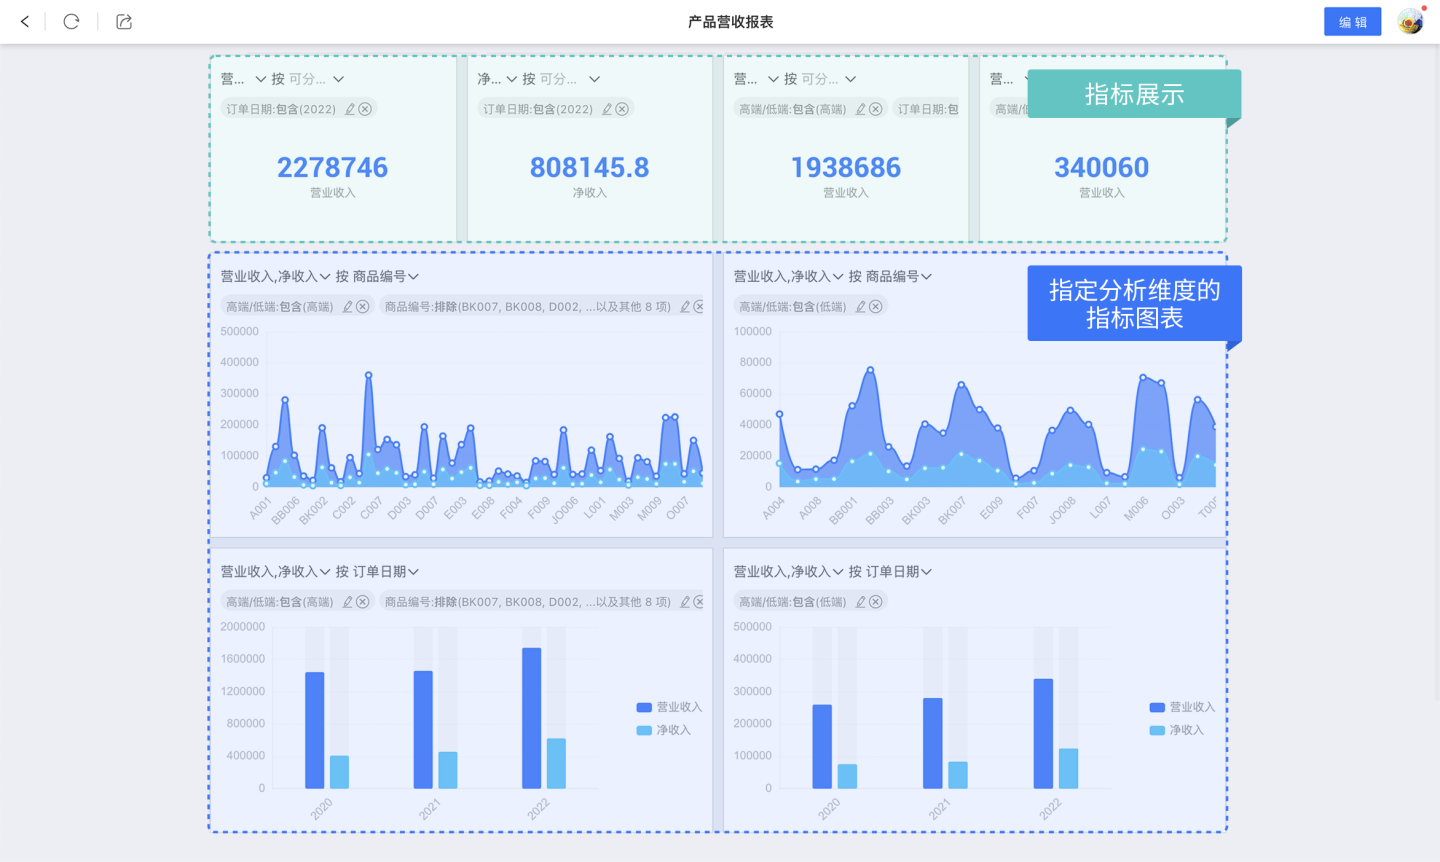
Dashboards can display rich business information through various charts, as shown in the figure. For example, the two indicators of operating income and net income can be displayed by specifying analysis dimensions and filtering information, showing overall KPI revenue, KPI revenue for various products, comparisons of operating income and net income for high-end and low-end categories, and comparisons of operating income and net income for high-end and low-end categories in recent years, and so on.

Kanban Display
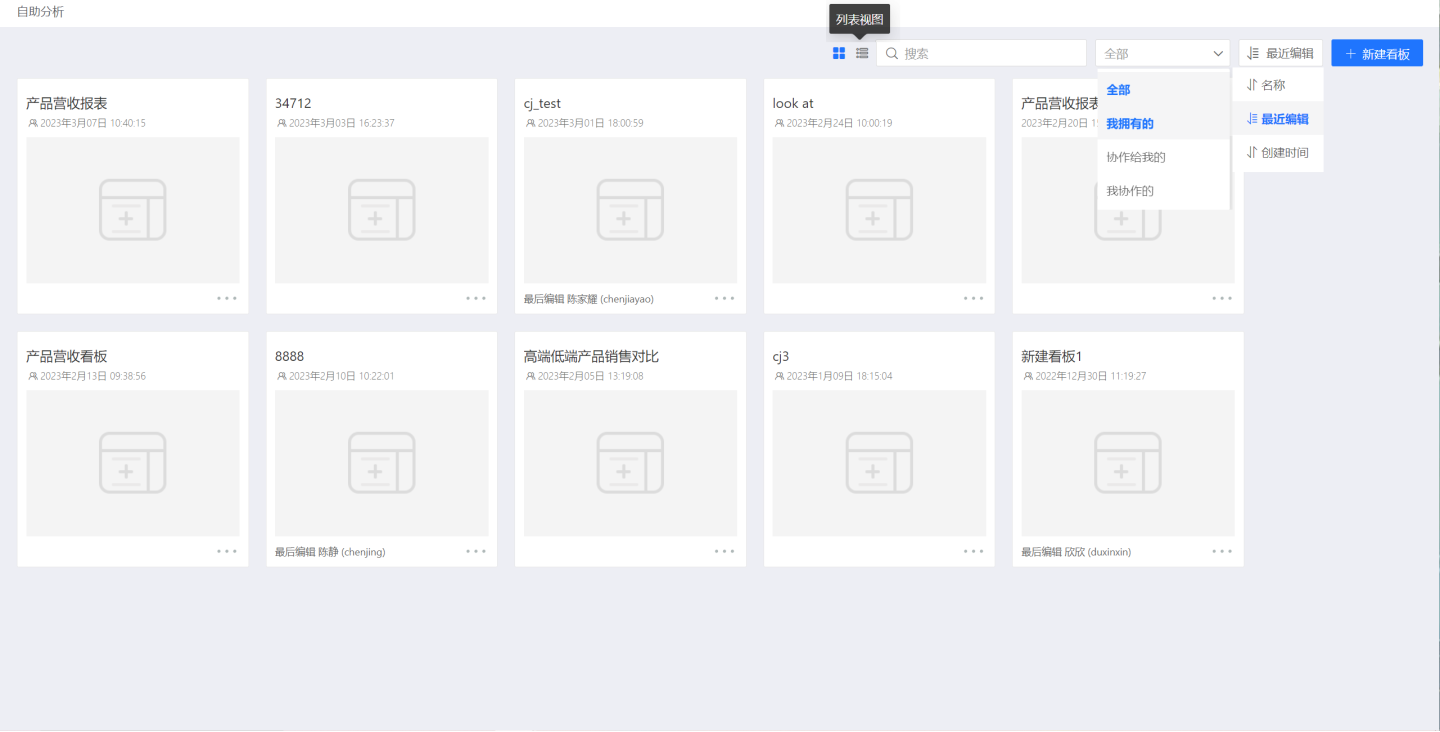
The metrics analysis module displays all dashboards, supporting both tiled and list views, enabling dashboard search, categorized lookup, and sorting. 
Common Operations in Kanban
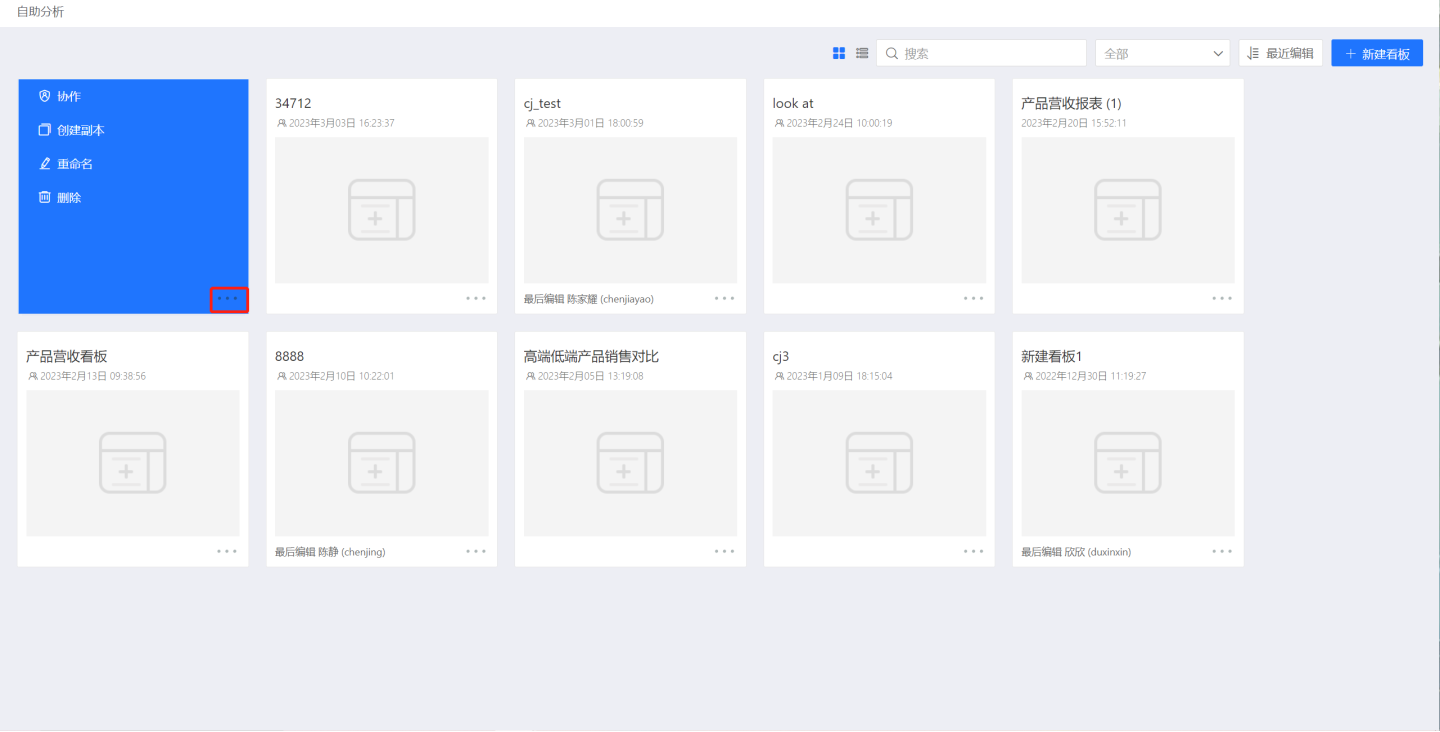
Dashboards support collaboration, creating copies, renaming, deleting, and other operations.

Collaboration
Dashboards in the indicator analysis are by default in the personal workspace, and other users cannot view them. At this point, users can collaborate to share the dashboard with other users, inviting them to jointly create dashboards and review dashboard content. During collaboration, editors and viewers of the dashboard can be set.
- Editor: After collaboration, users can edit dashboard content.
- Viewer: After collaboration, users can view dashboard content.
Create a Copy
Dashboards support creating duplicates, with the new dashboard name being "Dashboard Name" + "(1)". When creating multiple duplicates, the suffixes will be (2), (3), (4)....
Rename
Dashboards support renaming operations.