Report App
Complex Reports integrate the rich and powerful report editing capabilities of Excel, enabling the creation of complex layouts and calculations for Chinese-style reports. The seamless combination of BI and reporting meets the needs of most users. To cater to heavy users of Chinese-style reports, a reporting application has been introduced, further lowering the threshold for using reports. The application can consist of multiple reports, with each new report's interface being the complex report's operation interface. Users can directly perform report operations and drag-and-drop to analyze data.
Report App
In App Creation, click New App -> Report App to create a new blank report app. The report app is similar to the analysis app, consisting of report, Dataset, Data Model, Data Lineage, Parameters, and Settings modules. Except for the report module, the usage of other modules is the same as in the analysis app, and will not be expanded upon here. 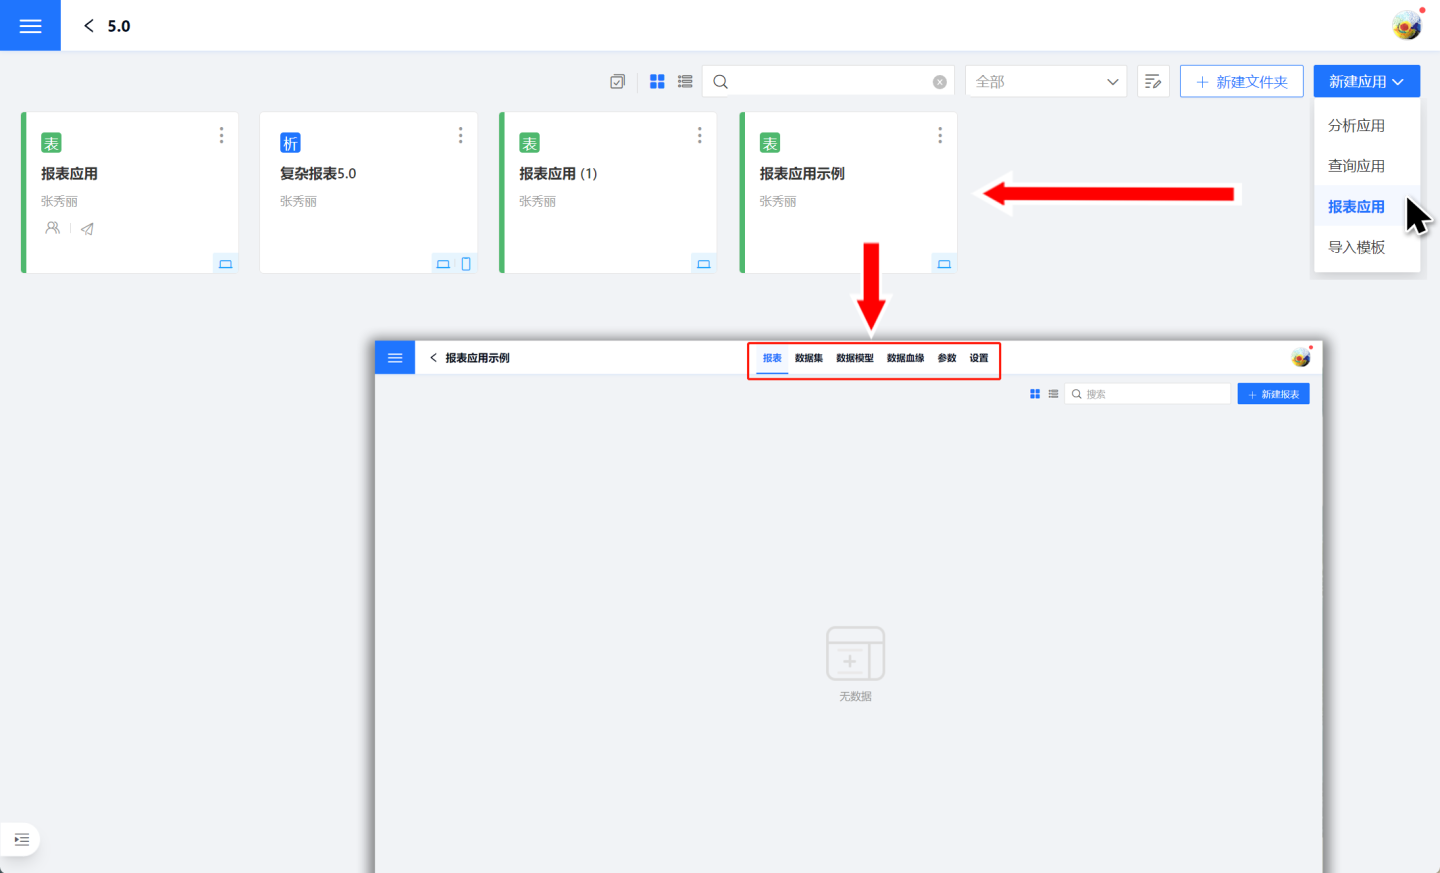
Report App Edit Mode
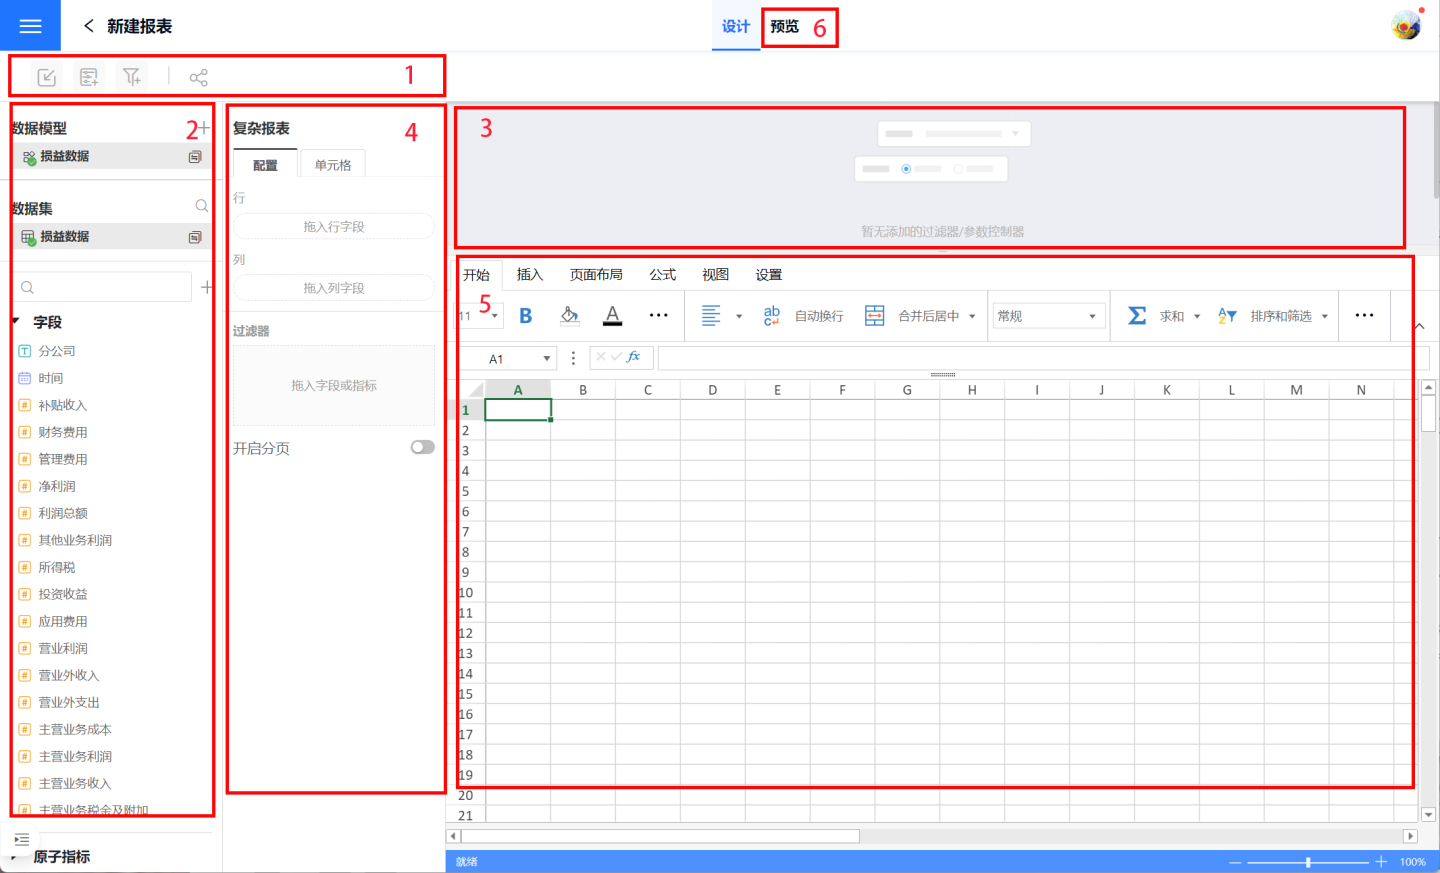
The editing interface of the report application is shown in the figure below, which can be roughly divided into six areas.
- Region 1: The report's functional area, from left to right, includes import template, parameter control, filter control, and embed. The import template allows complex reports to be quickly edited on the template. Parameter control and filter control can be added to the condition filtering area (Region 3) for filtering report data. Embed allows the report to be quickly shared.
- Region 2: Data model and dataset field display area. Complex reports support adding multiple data models.
- Region 3: Condition filtering area, used to display filters and parameter filters for filtering conditions.
- Region 4: Complex report configuration area, including data and related settings used by complex reports. Related configurations for complex report cells.
- Region 5: Complex report data presentation area.
- Region 6: Report preview effect.
Tip
Parameter Control, Filter Control only support local controls, not global controls. The conditional filtering area and data display area can be freely adjusted to show the area size, convenient for editing and layout. When there are many controls in the conditional filtering area, they can be collapsed for display and expanded when performing data filtering.
Report Application Example
Report applications are primarily composed of Parameter Controls, Filter Controls, and Complex Report Controls. For instructions on how to use these features and perform related operations, please click the corresponding links. This article will not provide detailed explanations of the functionalities.
Below is a brief example of the report application building process. The example report showcases the profit and loss situation of a business intelligence company and its branches on a monthly basis. Since the report has a professional profit and loss template, it is necessary to import the company's unified business template when building the report.
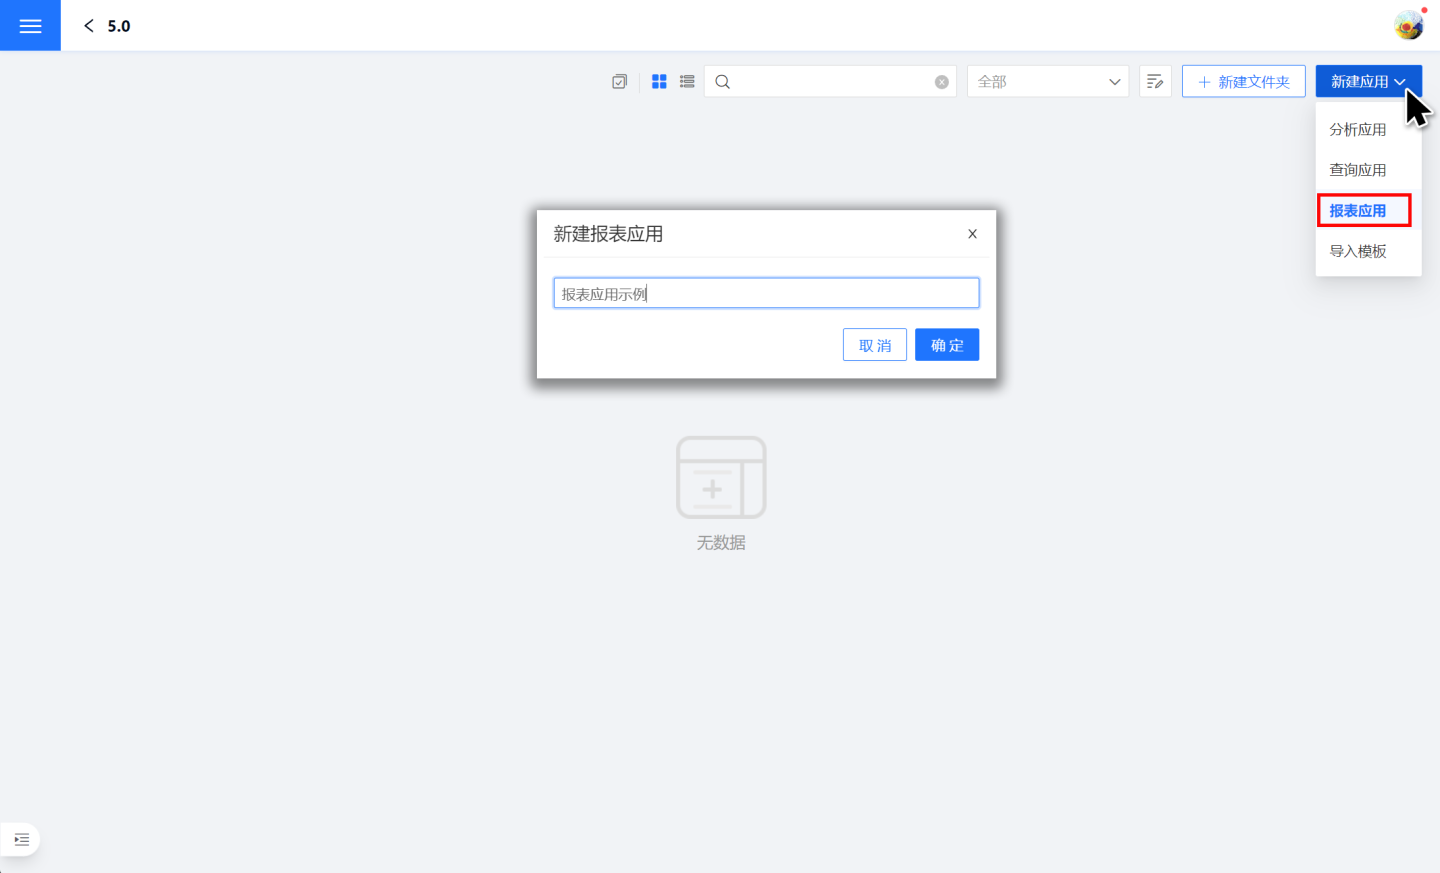
- First, create a report application. In Authoring, click New Application -> Report Application to create a new blank report application.
 2. Prepare the data for the report application. Create Datasets and build Data Models within the application. This step can be skipped if using data packages from the marketplace.
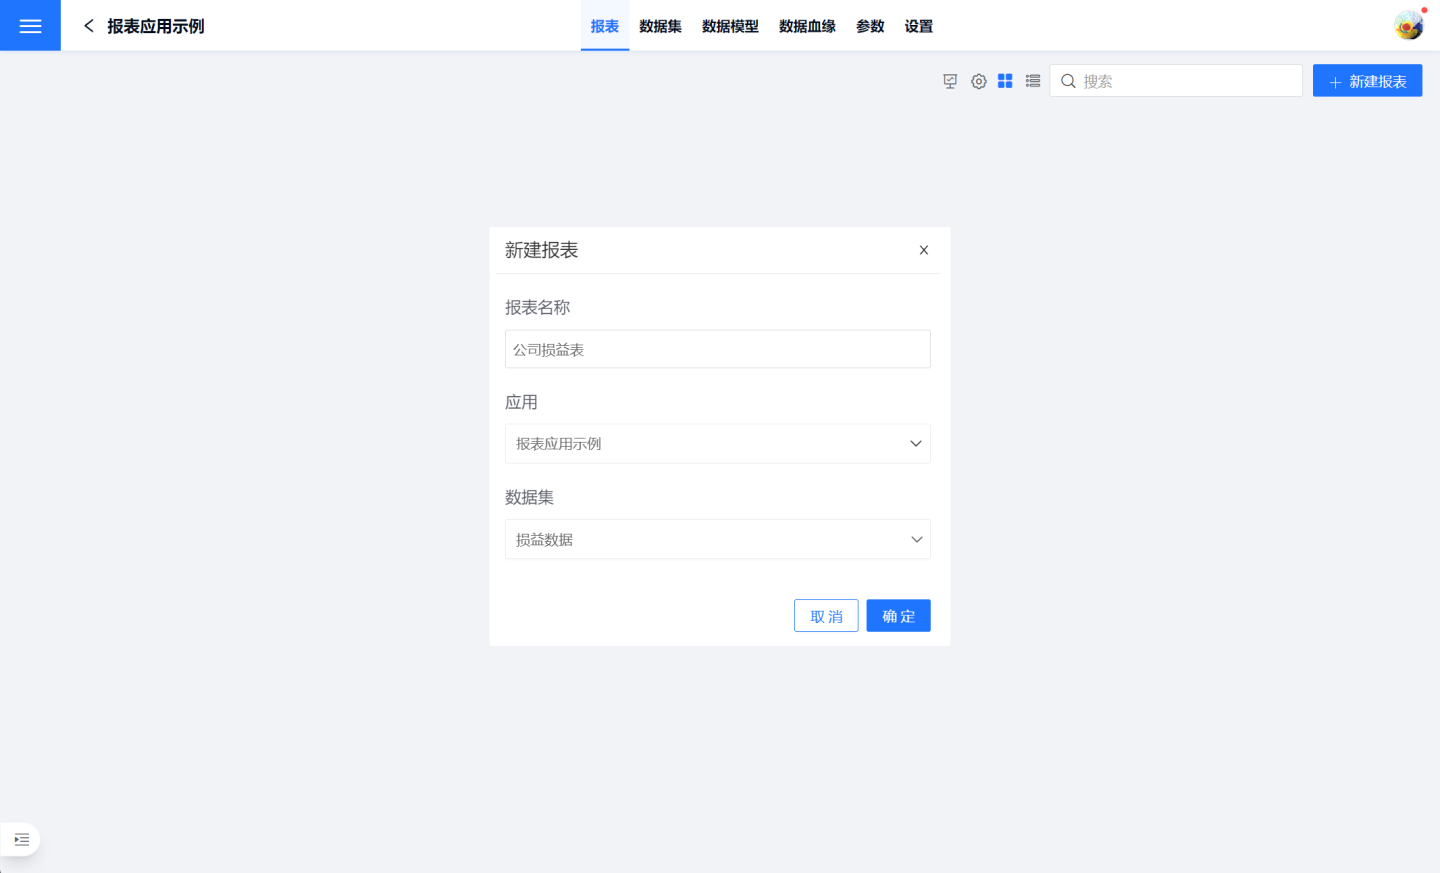
Create a report. On the report page, click New Report in the upper right corner to add a report and select the data used by the report application.
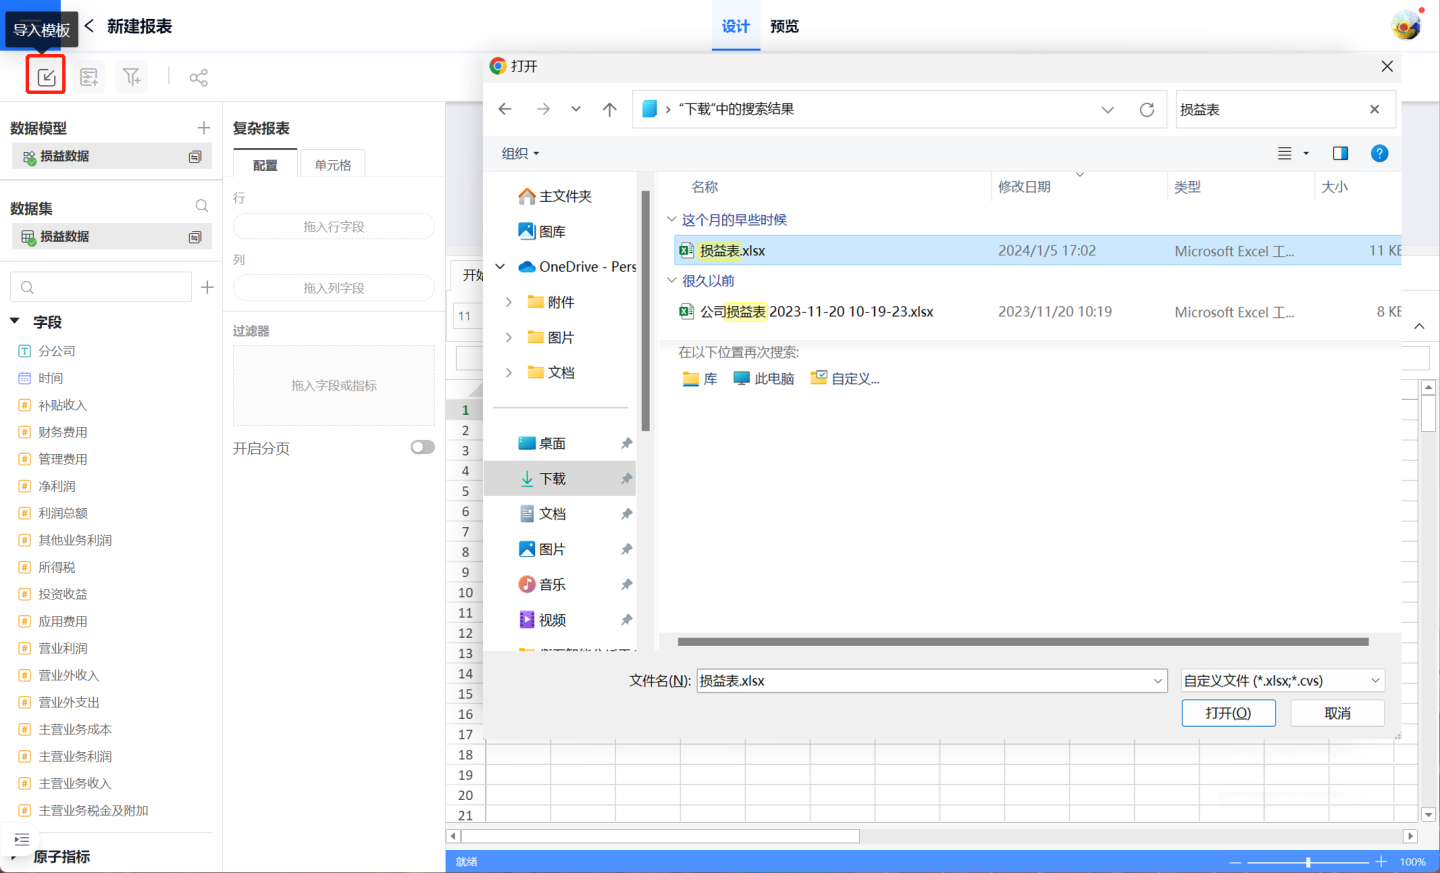
Import the template. The report in the example has a fixed display template, so the template needs to be imported first. If the report does not have a fixed template, skip this step.
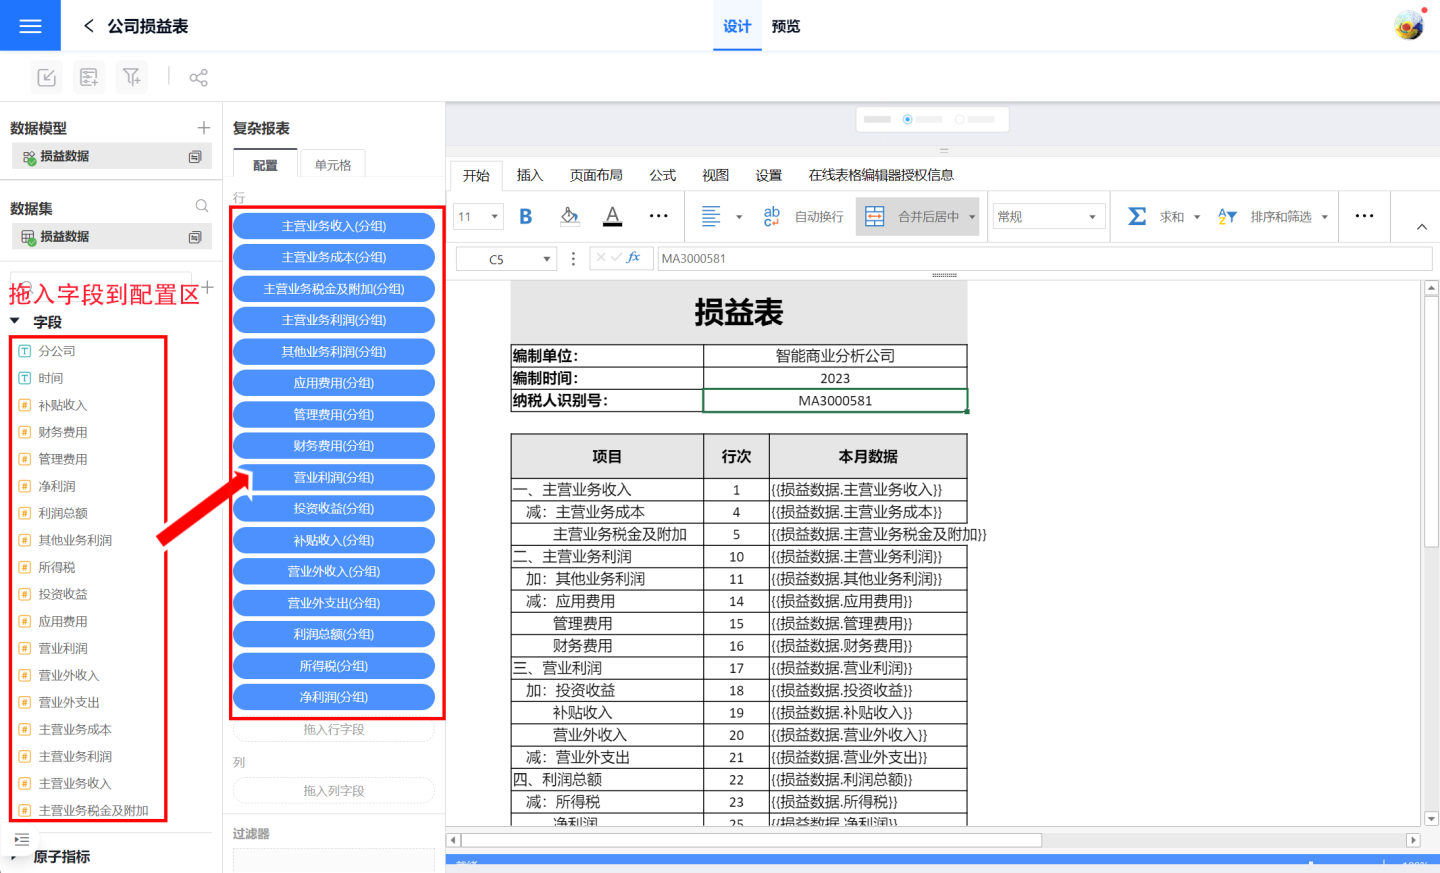
Drag business-related data to build complex reports. Since the example requires a template, business data is dragged into the specified cell positions of the template. For instructions on how to drag and configure fields, please refer to Complex Report Usage Instructions.
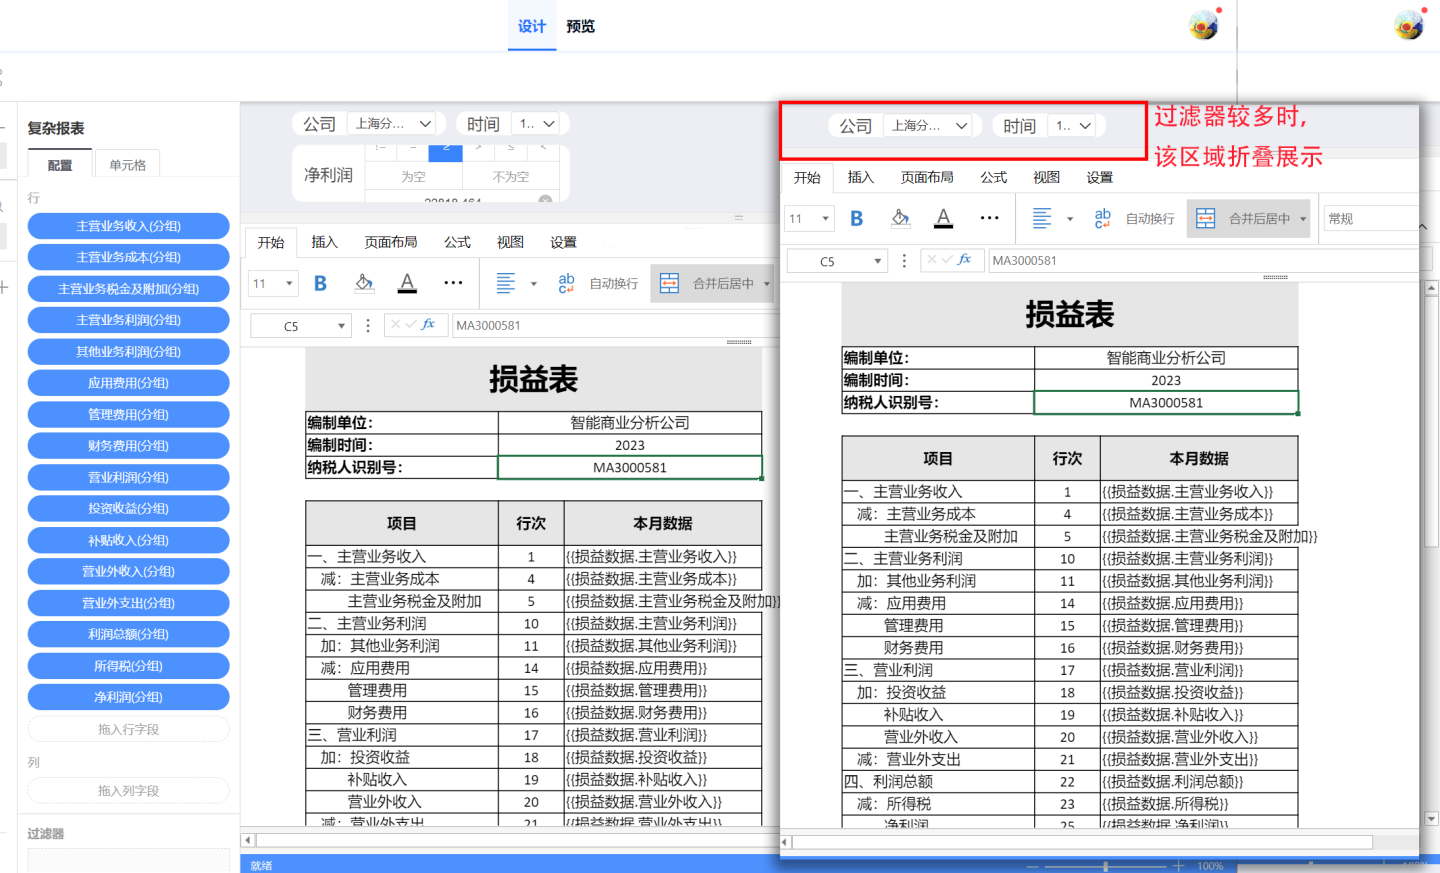
Build a conditional filter area. Drag parameter controls or filter controls into the conditional filter area to filter data. In the example, two filters for branch and time, and three filters for profit are dragged in. Since there are many filters, the net profit filter is collapsed for display.
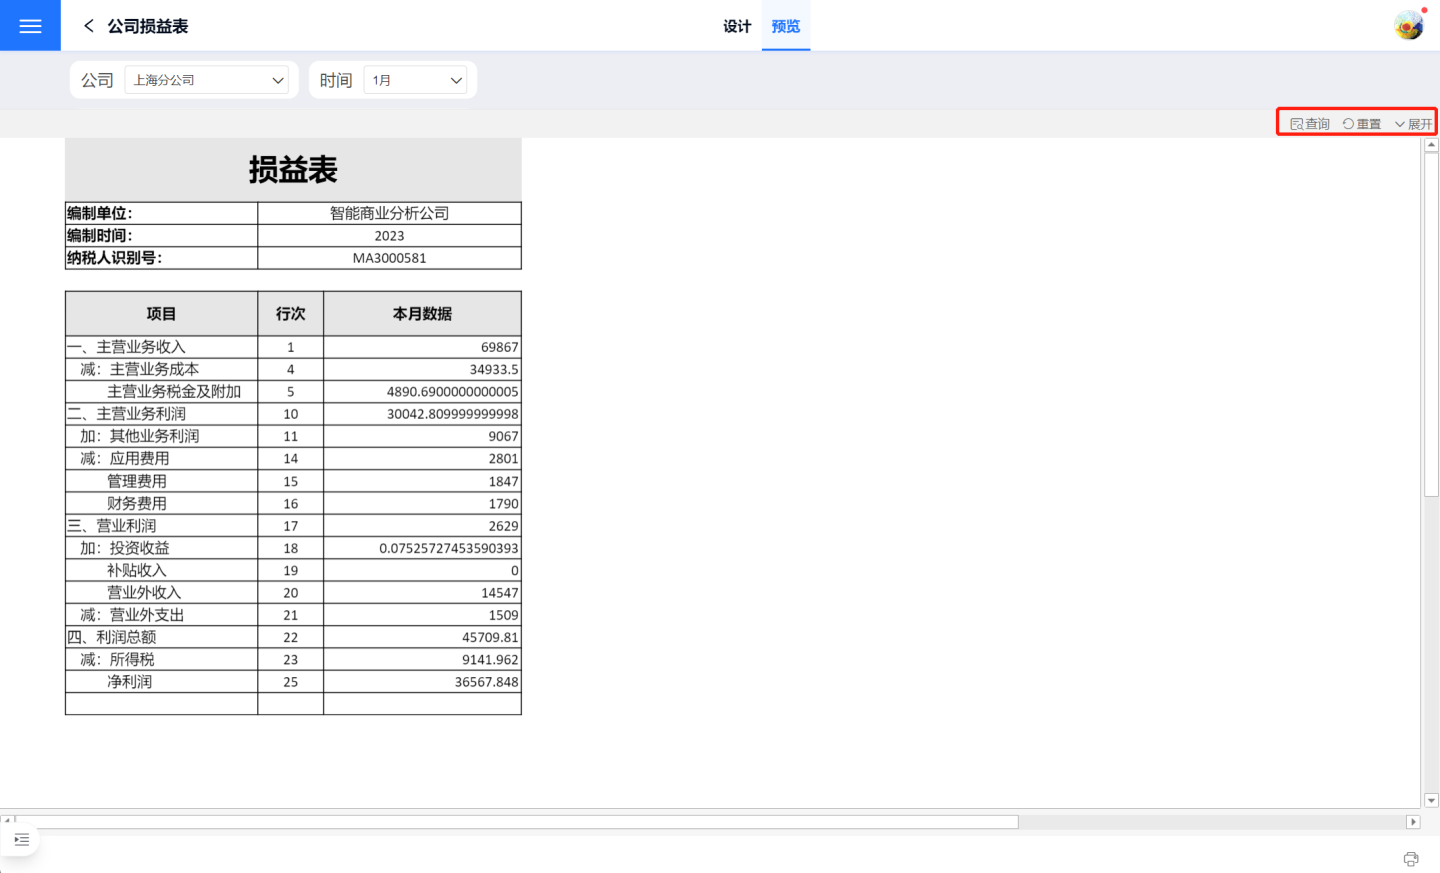
Preview the report. After building the report, click Preview to view the report effect. The preview page has three additional buttons in the red area compared to the editing page. The Query button is used to query the report data. When the filter conditions are modified, this button needs to be triggered to query the data. Reset restores the condition filter area controls to their default state. When the condition filter area controls are numerous and in a collapsed state, the Expand button can be used to open them.
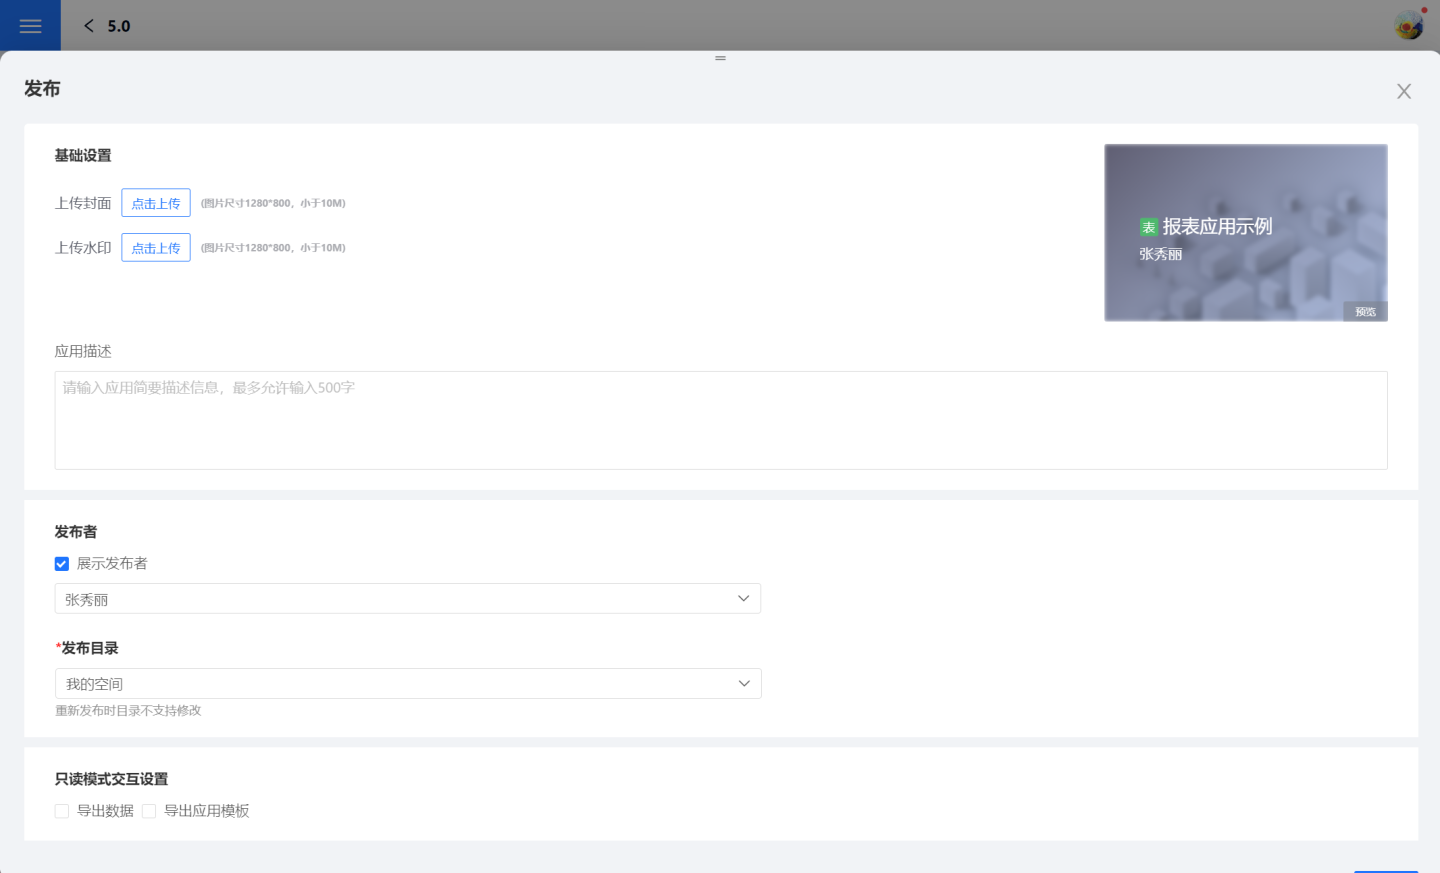
App Publishing. After the report app is created, proceed with publishing and fill in the publishing information. The publishing process is the same as the Analytical App Publishing process.
Report App Published State
Here is the situation after the report application is published. Compared to the editing state in the creation area, there are several additional parts as shown in the figure. These added components enable the report application to dynamically display filter conditions, save user query configurations, and set default query configurations. When the same application is presented to different users, it can display different query interfaces.
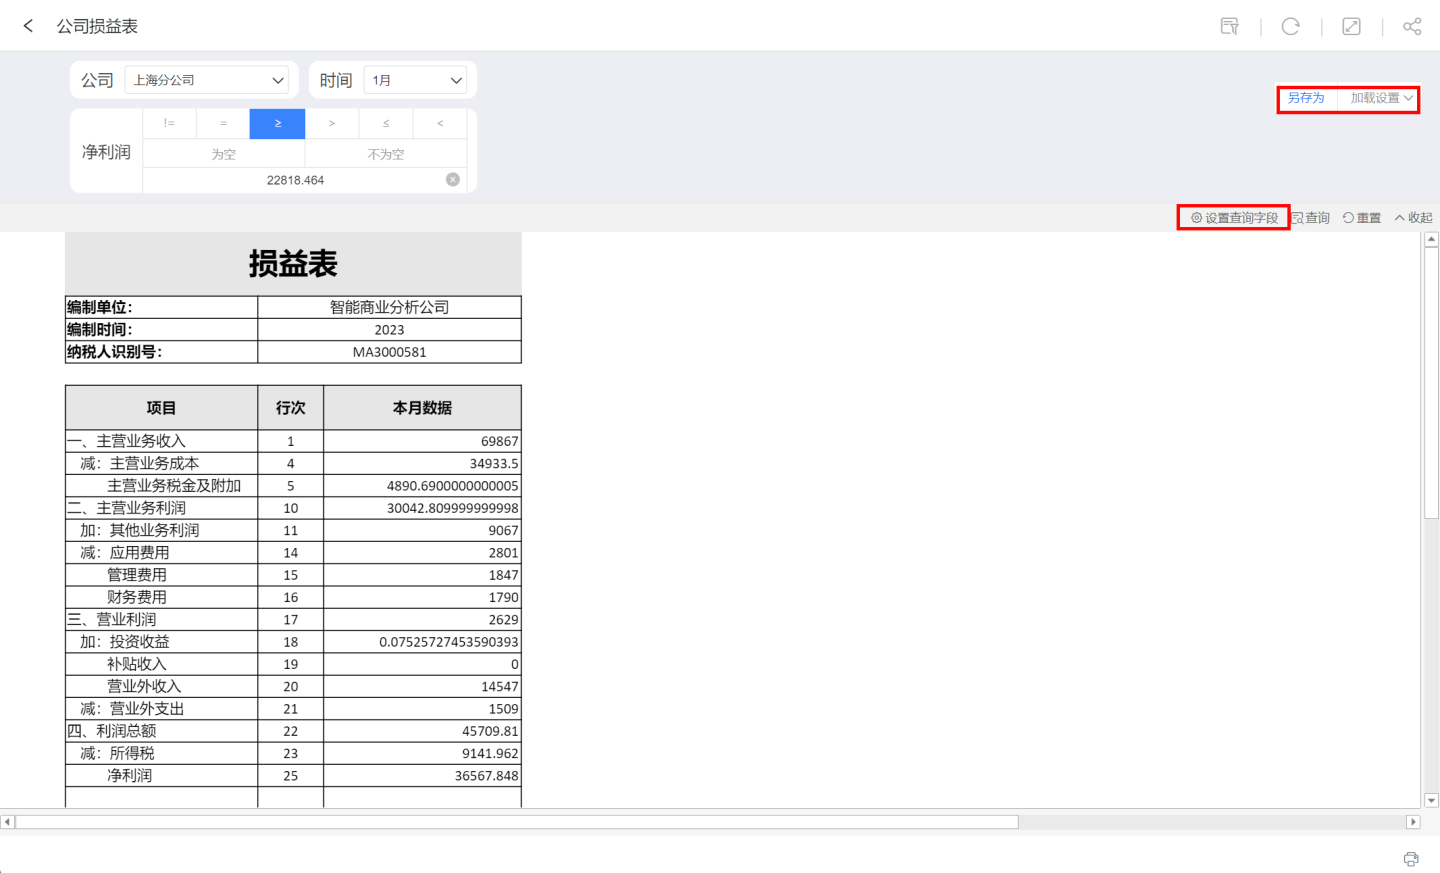
- Set Query Fields: Control the display status of the condition filtering area controls and dynamically adjust the display order of the controls. For example, if there are three filters in the example, you can hide the filters by setting query fields and adjust the display order of the filters.
- Save As: Save all the filter and parameter controls information in the current business scenario's condition filtering area. The next time it is displayed, you can directly select this configuration from the load settings.
- Load Settings: Load the configuration saved by the user previously and support setting the default configuration.