Data Model Management
Data models are based on dimensional modeling as the theoretical foundation, providing modeling capabilities tailored for analytical scenarios. A data model (relational model) is a structured system that centers on a specific dataset and builds a network of relationships between datasets through multi-table joins and unions. The data model serves as the carrier of relationships between datasets.
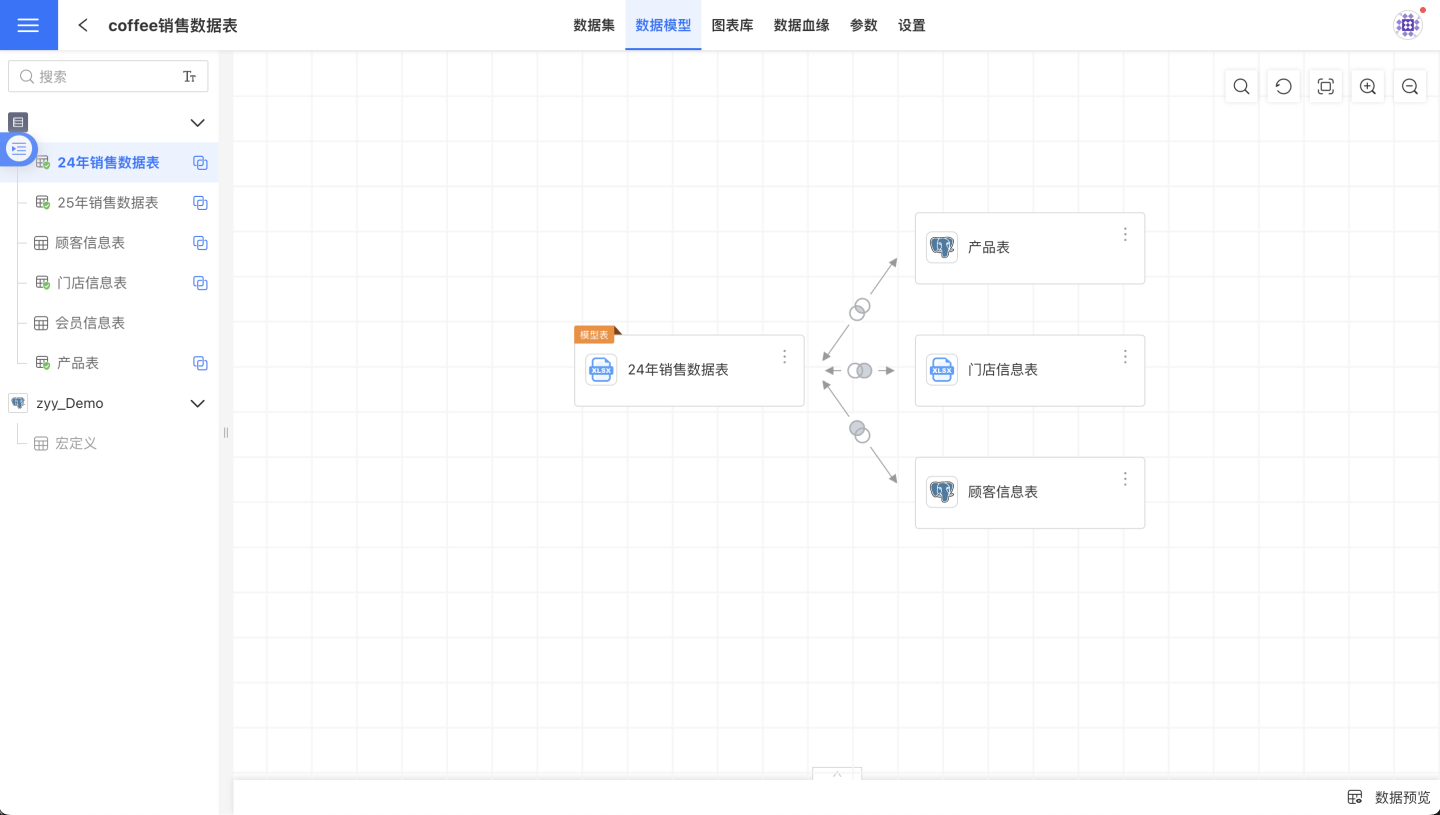
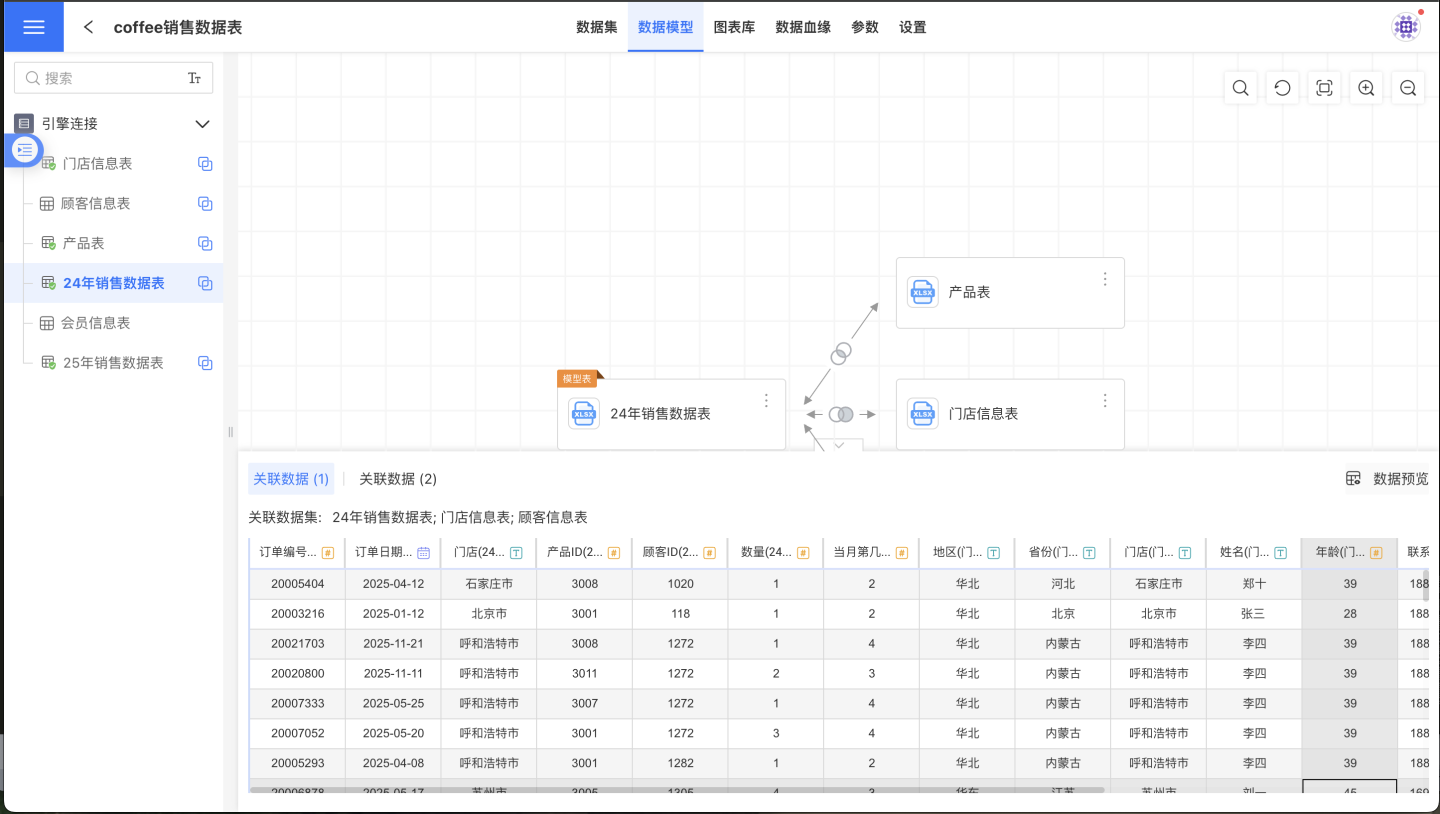
In HENGSHI SENSE, whether a dataset is a dimension table or a fact table is determined by the role it plays within the model; there is no explicit label marking a dataset as a dimension or fact table. The central dataset in a data model is called the model table, while other datasets in the data model are referred to as subordinate tables. In the data model shown below, the "2024 Sales Data Table" is the model table, and the other three datasets are subordinate tables.
Create a New Relationship
On the data model page, select a dataset from the dataset list on the left. The right side will then display the data model centered on the selected model table. Drag a dataset from the list on the left onto a node in the data model to open the Create Relationship dialog, where you can define the properties of this relationship.
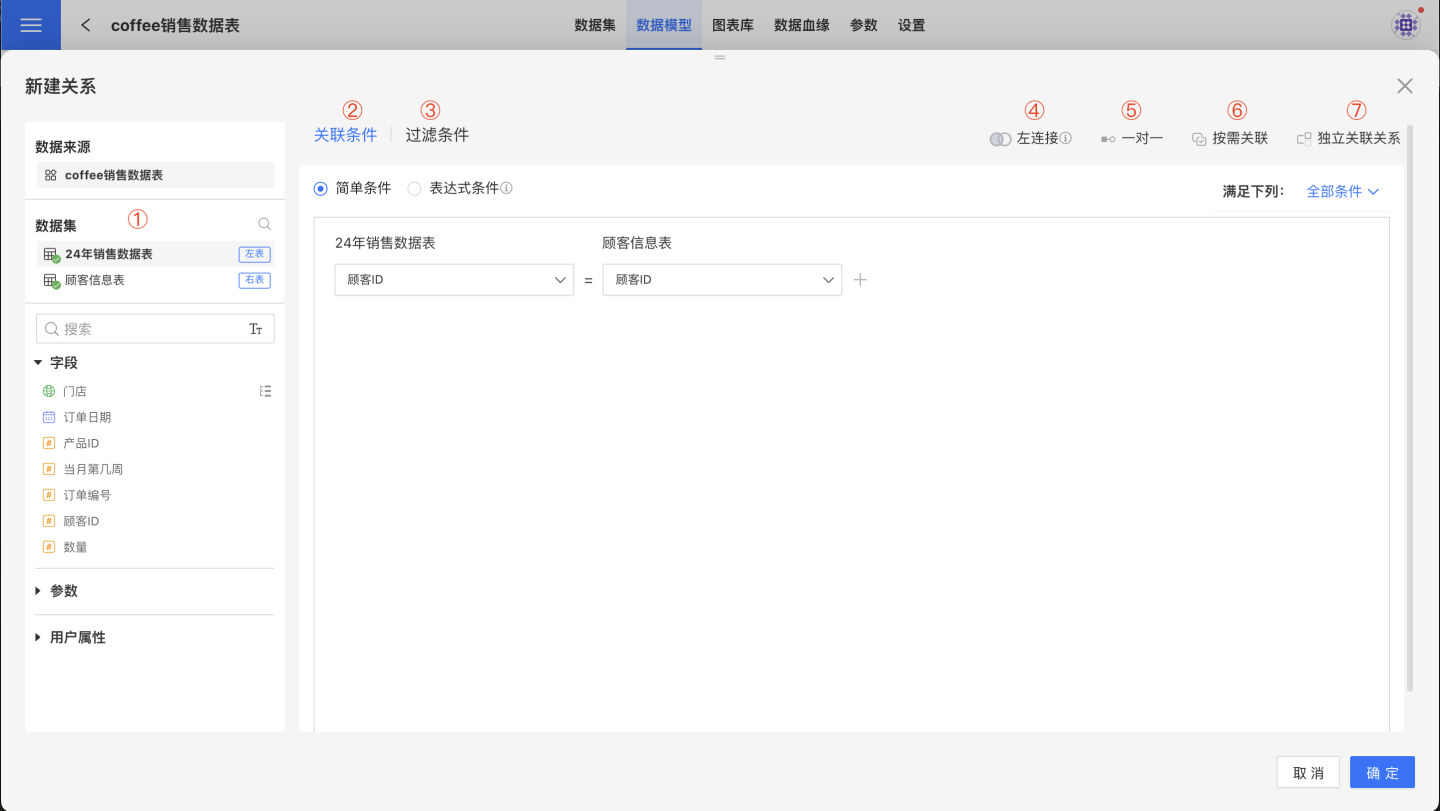
- ① Datasets Involved in the Relationship: Only two datasets can be involved. The dataset on the top is the left table, and the one on the bottom is the right table.
- ② Join Condition: Describes the condition for joining the two datasets. The join condition can be a simple condition or an expression-based condition.
- ③ Filter Condition: A filter condition is an additional filter applied on top of the join condition. After the datasets are joined according to the join condition, they are further filtered based on the filter condition. The filter condition can be a simple condition or an expression-based condition.
- ④ Join Type: The join type between the left and right tables, corresponding to database join types, including left join, inner join, right join, and full join.
- ⑤ Join Cardinality: The join cardinality between the left and right tables, describing the data characteristics of the two tables, such as one-to-one, one-to-many, many-to-one, and many-to-many.
- ⑥ Activation Mechanism: The model's activation mechanism includes on-demand join and always join.
- ⑦ Enable Circular Model: There are two types: independent relationships and shared relationships.
Edit Relationships
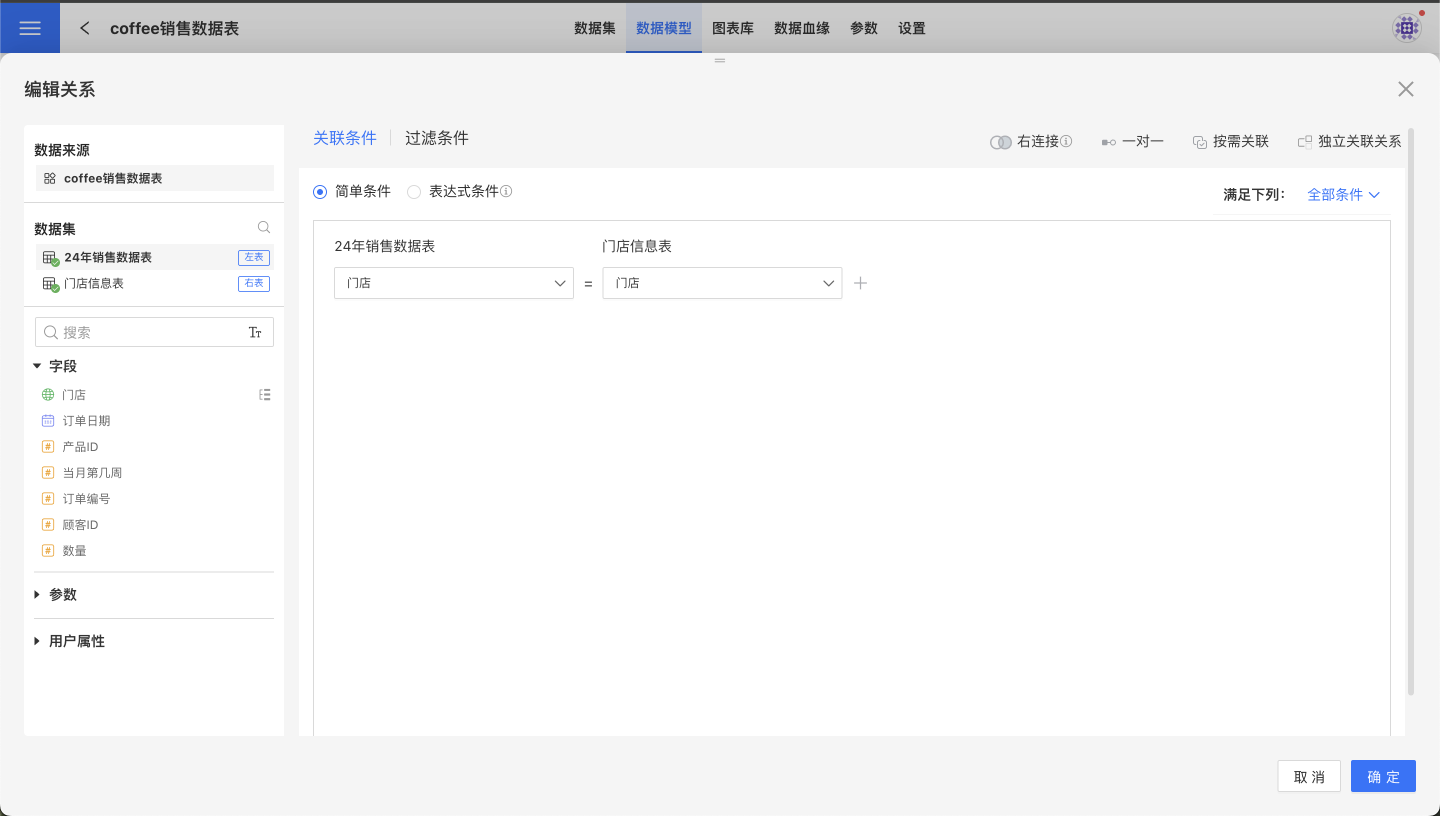
On the data model page, select a dataset from the dataset list on the left. The right side will then display the data model centered on the selected model table, which serves as the area for displaying and editing the model. Click the icon in the middle of the dataset connection line to access the Edit Relationship menu; alternatively, you can find the Edit Relationship menu in the three-dot menu at the top right corner of the dataset. Clicking any of these Edit Relationship menus will open a pop-up window for editing relationships. The attribute descriptions are the same as when creating a new relationship.
Delete Relationships
On the data model page, select a dataset from the dataset list on the left. The right side will then display the data model centered on the model table, which is also the area for displaying and editing the model. Click the icon in the middle of the dataset connection line to access the Delete Relationship menu; alternatively, you can find the Delete Relationship menu in the three-dot menu at the top right corner of the dataset. When deleting a single relationship, any other relationships associated with the related table being deleted will also be removed. In other words, there will not be any relationships in the data model that are independent of the model table—every dataset will be associated with the model table.
Rename Relationships
In the data model, when a child table is newly created, its default name is the same as the underlying dataset of the child table. Users can modify the name of the child table according to business requirements; this will not affect the name of the underlying dataset used by the child table. The name of the child table's dataset will affect whether the dataset filter conditions take effect. The rule is: for a filter condition to be effective in the current calculation, the dataset ID it uses must be the same as the underlying dataset ID of the child table, and the dataset name it uses must also be the same as the name of the child table's dataset.
Create a Merge Relationship
Each dataset in the data model supports data appending. Click the vertical ellipsis menu in the upper right corner of each node in the model and select "Append Data". At this point, the dataset list on the left will be displayed with checkboxes, and the right side will show the field information of the current dataset. Select the dataset to be appended from the list on the left, and click "Confirm" to successfully append the data. The data from the selected dataset will be appended to the dataset of the node. 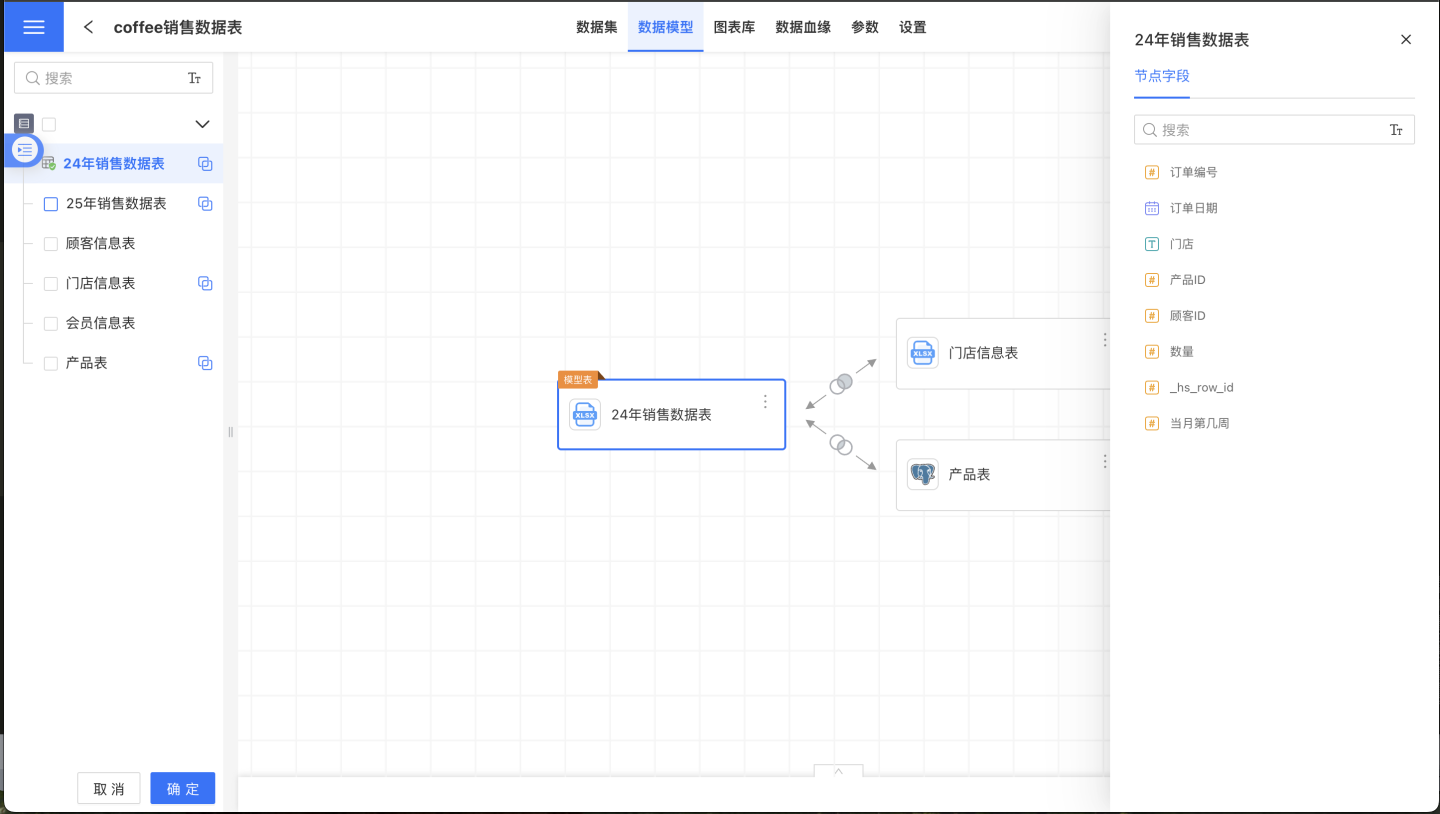
Tip
The appending rules are as follows:
- Fields are automatically aligned by node field names. The first dataset is the base node dataset. Other datasets with the same field names will have their data appended together. Datasets with different field names will be ignored and will not be reflected in the current model.
- For user-added fields in the base node dataset, they will remain as new fields after appending. If the appended dataset has a field with the same name and it is a physical column, it will be ignored.
- Hidden columns can participate in appending.
Edit Merge Relationships
Following the same steps as creating a new merge relationship, simply check or uncheck the datasets to be included in the merge.
Enable/Disable Dimension Deduplication
In the absence of a common dimension table, if there is a many-to-many relationship between multiple tables, directly associating them to build a model may cause data inflation, resulting in duplicate data and affecting subsequent data mining and analysis. In such cases, you can use the dimension deduplication feature to remove duplicate data and eliminate data inflation. Click the three-dot menu in the upper right corner of the model table to find the "Enable Dimension Deduplication" option. Clicking "Enable Dimension Deduplication" turns on this feature; clicking "Disable Dimension Deduplication" turns it off.
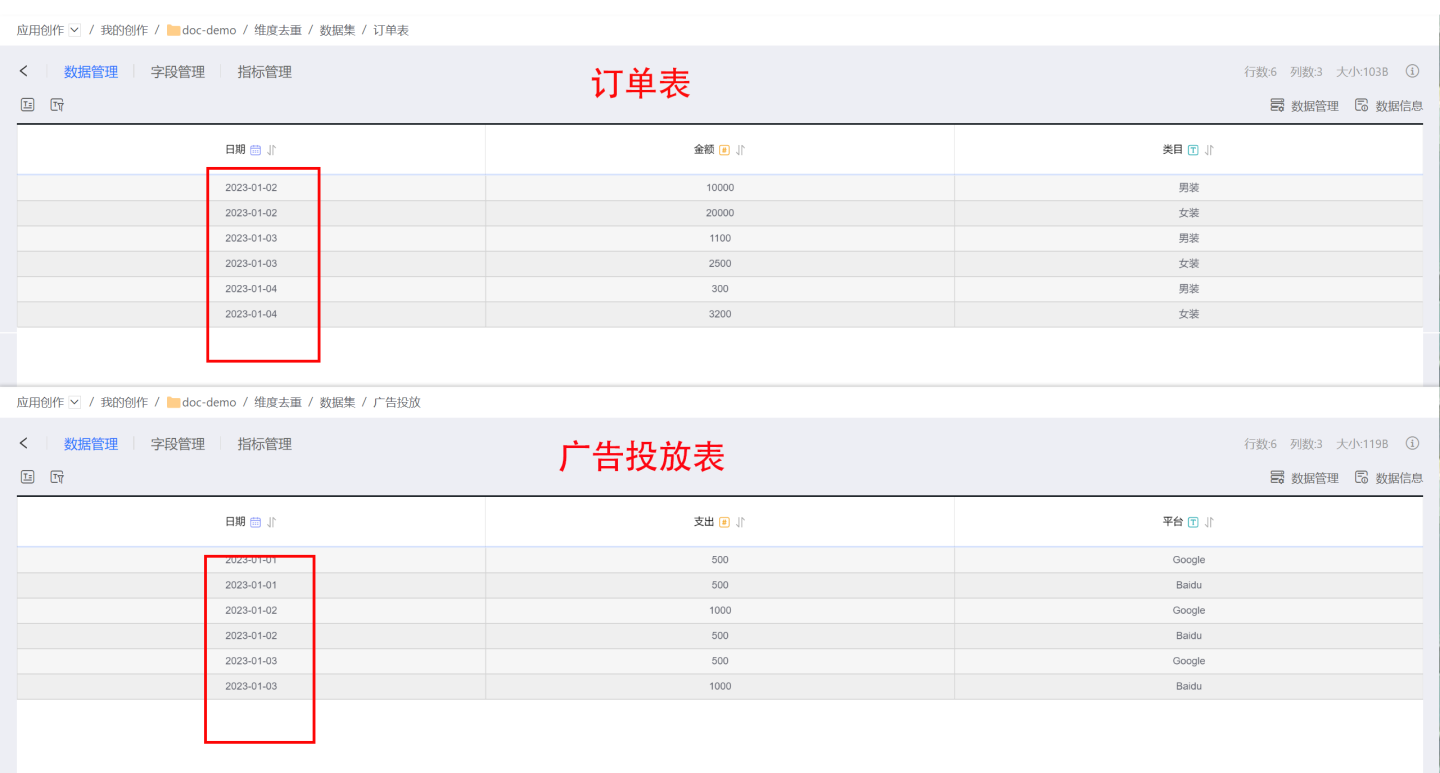
The following example uses two datasets, the order table and the ad campaign table, to demonstrate how to use the dimension deduplication feature to eliminate data inflation.
The original data of the order table and the ad campaign table is as follows.
If you directly associate the tables using the date field in a many-to-many relationship and perform chart analysis, the resulting associations and chart data will be inflated. When the total ad campaign expenditure is only 4000, the aggregated result becomes 6000. 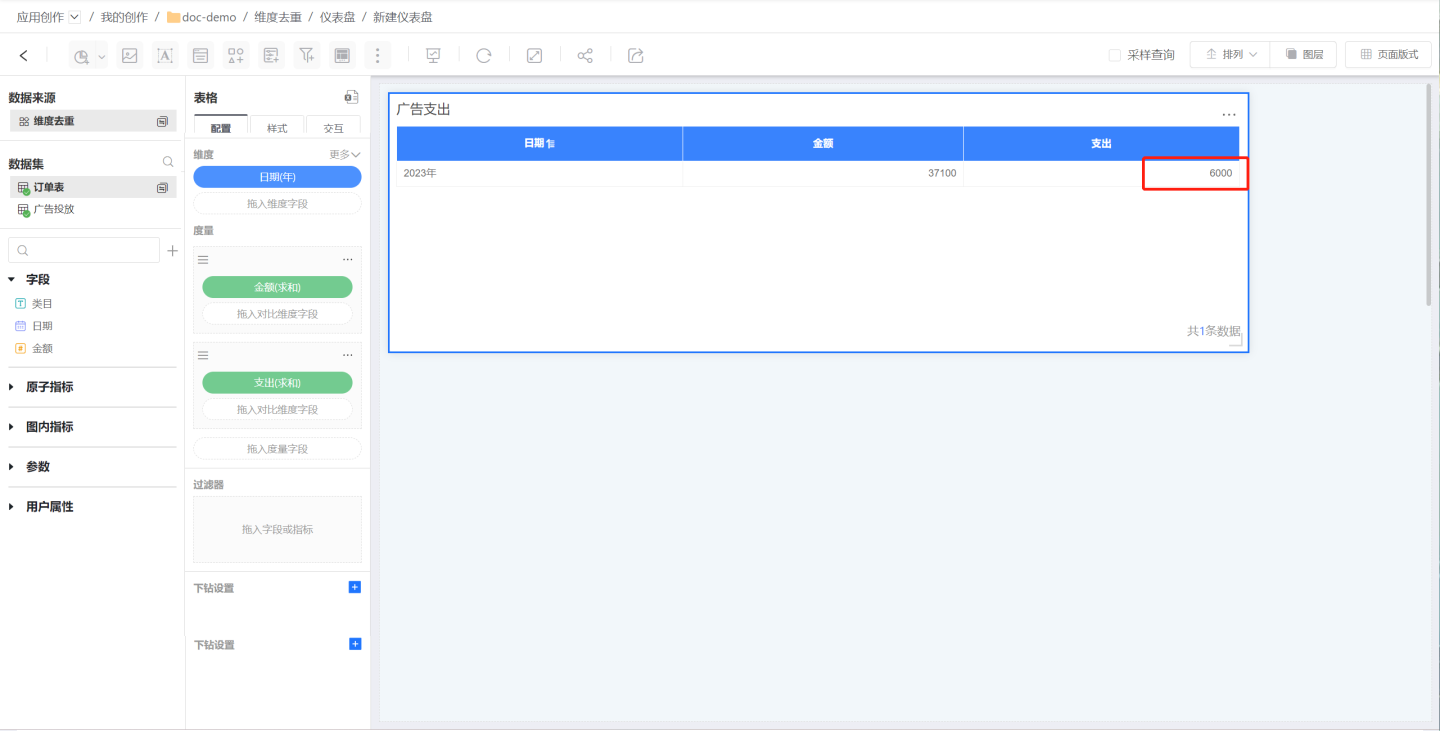
After enabling dimension deduplication, the model can calculate, according to the user's intent, that the ad expenditure corresponding to the order date is actually only 3000. 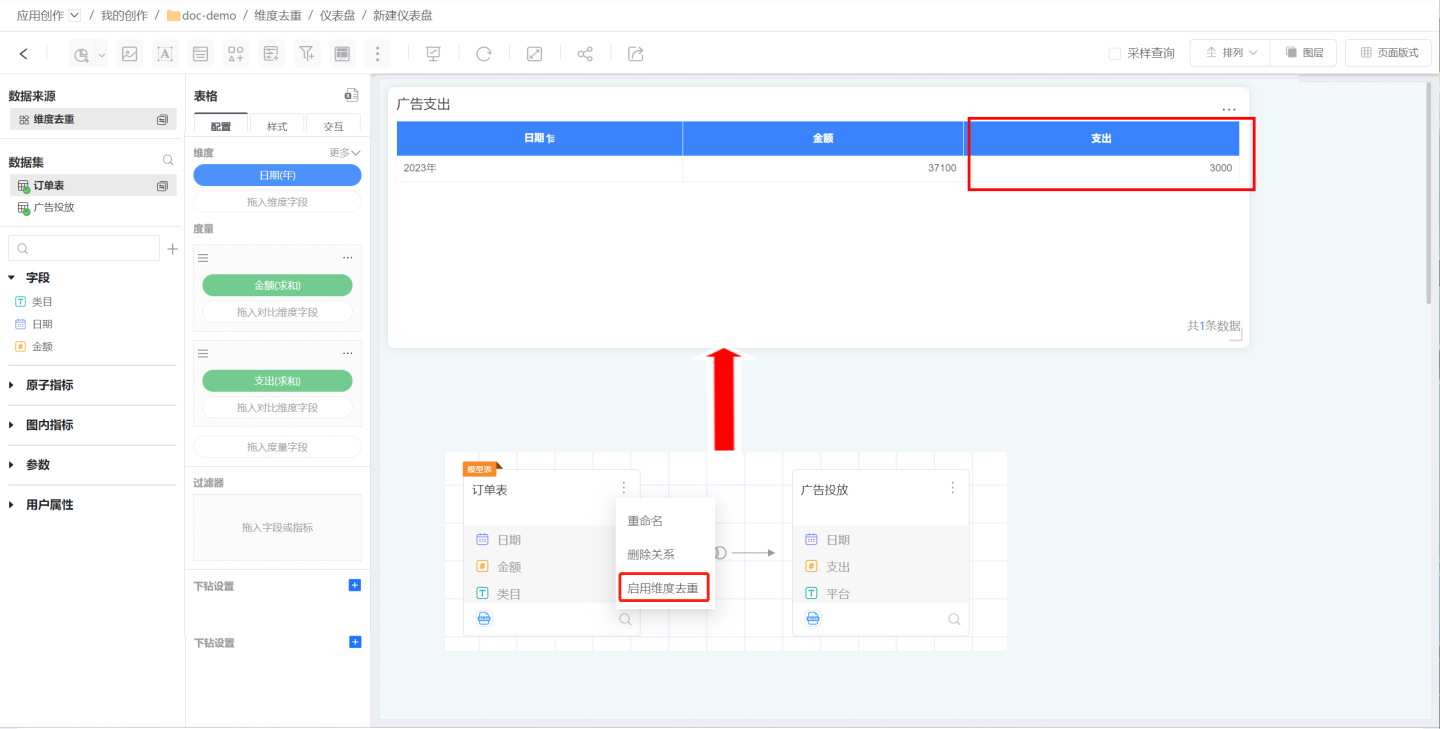
Tip
The dimension deduplication feature can be enabled or disabled as needed for data analysis. When using the dimension deduplication feature, be clear about which data has been inflated and which inflated data is being eliminated.
Preview Data
Click Preview Data at the bottom right of the data model area to instantly preview the data after the associated model takes effect:
Dataset Sources in Data Models
Under normal circumstances, all datasets in a data model must originate from the same data connection, and only associations or merges between datasets from the same source are supported. If you need to model heterogeneous datasets, you can refer to the following solutions:
- If the import engine feature is supported, import all datasets into the engine before building the data model. In this scenario, all model calculations occur in the data warehouse configured by the engine.
- If only a small number of datasets come from heterogeneous data sources and these datasets contain fewer than 500 rows, you can set them as public dictionary tables and then build the data model with other datasets. In this scenario, model calculations occur in the data connection of the model tables' source. Public dictionary tables cannot be used as model tables.
Using the Same Dataset Multiple Times in a Data Model
There are two scenarios for using the same dataset multiple times within a data model: one is as independent associations appearing multiple times, and the other is as shared associations.
Scenarios of Independent Relationships
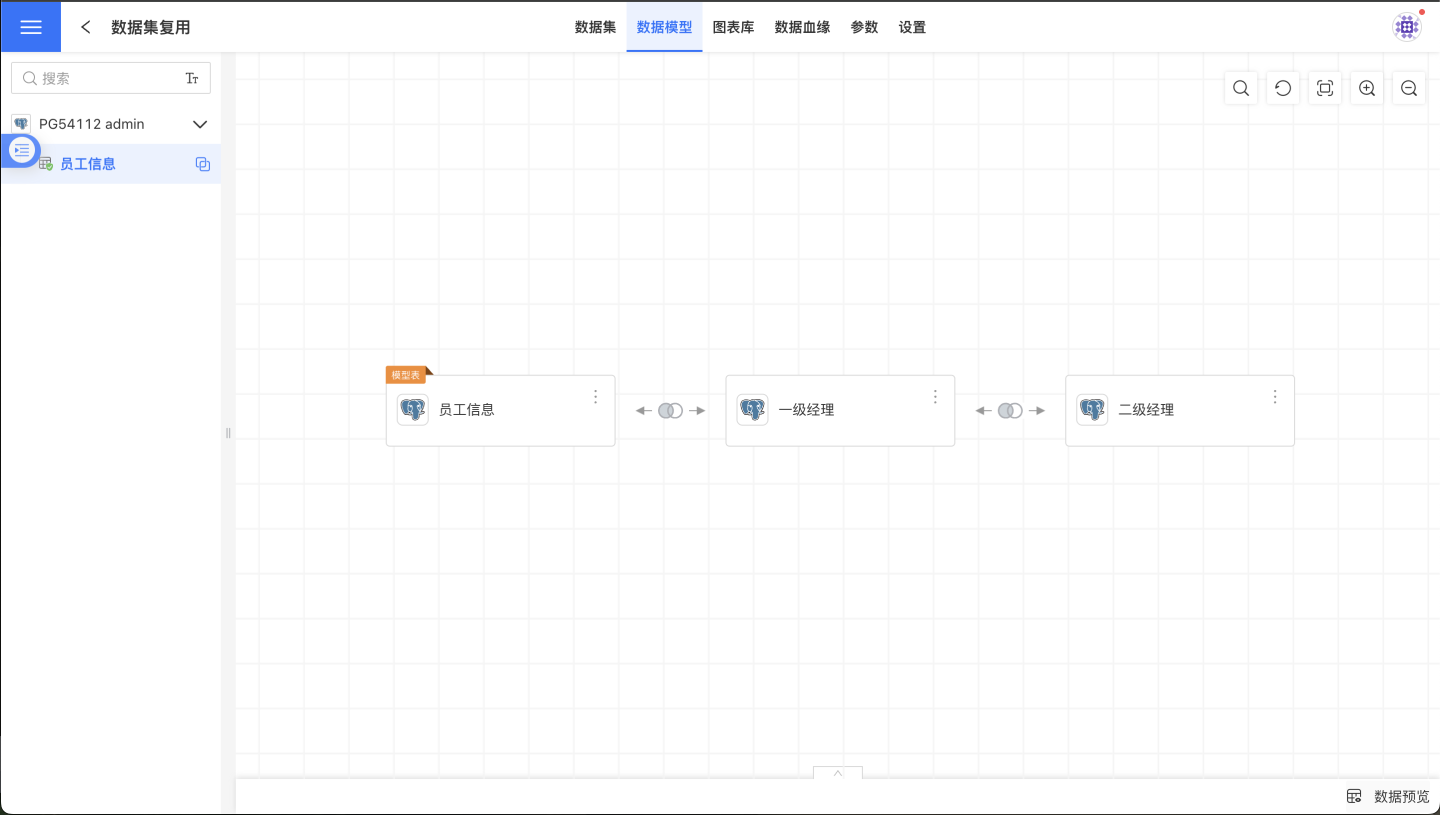
In a data model, when the same dataset is dragged in multiple times and the relationships are configured as independent associations, this dataset will play multiple roles within the model, with each relationship representing a different analytical perspective. When the same dataset is dragged in multiple times, the system will automatically append (1), (2), etc., to the dataset name for subsequent instances, and users need to rename the child tables according to business requirements.
In the scenario shown below, the goal is to analyze the company's organizational structure. The Employee Information dataset is dragged in multiple times. The model table Employee Information describes the basic information of all employees, Level 1 Manager describes information about level 1 managers, and Level 2 Manager describes information about level 2 managers. The underlying dataset for both the Level 1 Manager and Level 2 Manager child tables is Employee Information.
Scenarios for Shared Relationships
In a data model, when the same dataset is dragged in multiple times and the relationship configuration is set to shared relationship, it is typically used in scenarios with multiple dimension tables and multiple fact tables. This configuration will create loops in the model connections, also known as a ring model. For an example of a ring model, refer to Enable Ring Model. The operation steps are as follows:
- Drag in the dataset as a child table and set the relationship configuration to shared relationship.
- Drag in the same dataset again and set the relationship configuration to shared relationship. In the model display area on the right, the system will merge the two instances of the child table into a single node.
Usage of Aggregated Datasets in Data Models
When an aggregated dataset only uses fields from the main table of the model, it can be associated with the data model of the main table, allowing for reverse filtering and viewing of details in the main table. After dragging the main table's aggregated dataset into the main table's data model, situations such as circular references may occur, in which case a prompt will be displayed to the user. Below are some scenarios where dragging the main table's aggregated dataset into the main table model will result in errors.
In the data model of the main table:
- If the main table's aggregated dataset uses fields from datasets other than the main table, this aggregated dataset is not allowed to be added to the main table model.
- If the activation mechanism of the main table's aggregated dataset is set to "Always Associated" after being dragged into the model, this aggregated dataset is not allowed to be added.
- If there is a main table aggregated dataset in an upstream dataset within the model, the activation mechanism of downstream datasets cannot be set to "Always Associated"; if set to "Always Associated," the addition is not allowed.
When appending data to datasets in the model:
- Aggregated datasets of the main table are not allowed to be merged vertically (appended) in the model.
- When other datasets in the model are merged vertically, fields from the main table's aggregated dataset cannot be appended.
After the main table's aggregated dataset is dragged into the model:
- If non-main table fields from the model are added when editing the main table's aggregated dataset, an error will occur.
- An error will occur when attempting to replace the main table's aggregated dataset with a sub-table from the model.
Compressed Dimensions in Data Models within Charts
Assume the model table in the data model is A, with table B associated to A with a "1:many" cardinality, and table C associated to A with a "many:many" cardinality. This article uses this model to illustrate the function of Compressed Dimensions.
- The dimension in the chart is set to a field from A, a_f1.
- The measure in the chart is set to a calculation on a field from B, sum({b_f2}).
- The measure in the chart is set to a calculation on a field from C, sum({c_f3}).
- Without enabling the
Compressed Dimensionsfeature, since table B is created earlier than table C, the dimension field values come from the dimension field values introduced when calculating sum({b_f2}). - When sum({b_f2}) is set as a
Compressed Dimension, the effect on the chart data is the same as not settingCompressed Dimensions. However, for users, it allows them to actively determine the dimension field values, as it is often difficult for users to distinguish the creation order of the associated tables. - When sum({c_f3}) is set as a
Compressed Dimension, the dimension field values come from the dimension field values introduced when calculating sum({c_f3}), which may cause the chart's result data to change. Examples where changes will definitely occur:
- The association type between A and C is inner join, and the dimension values of A are reduced, which will cause the dimension values in the chart to decrease.
- There is a filter condition on dataset C in the chart, causing the association values between A and C to be filtered, reducing the dimension values of A, which will also cause the dimension values in the chart to decrease.
- There is a filter condition on dataset B in the chart, but not on dataset C, so the calculation of sum({c_f3}) will introduce more dimension values, thereby increasing the dimension values in the chart.
Data Model Performance Optimization Guide
- Use the
equals (=)operator for join conditions whenever possible. - Ensure that the fields used in join conditions are indexed in the database tables, and avoid type conversions in join conditions that may cause index invalidation.
- Use caution when including relationships with
many-to-manycardinality in join models, as this can lead to model calculation inflation. - Join models are typically used directly for queries; consider pre-aggregating and materializing detailed data, then use the resulting data to build the data model.
- If you only need to analyze a subset of the dataset, it is recommended to introduce filtering conditions before model calculation, such as placing the filter conditions in the dataset's filters or row-level permissions.
Differences Between Data Models and Multi-Table Union Datasets
- All datasets involved in a multi-table union dataset participate in calculations, while datasets involved in a relational model can participate in calculations as needed.
- The result of a multi-table union dataset can be materialized into a large wide table.
- Data models provide more flexible modeling methods, such as dimension deduplication, ring models, and dynamic dataset activation mechanisms.
- When creating charts, a multi-table union dataset is used as a single wide table, hiding its upstream datasets; a data model is used as a list of datasets.