App Settings
Each user has a settings menu for the apps they have management permissions for (specifically, their own apps in the personal space, and apps in the team space or data marketplace with management permissions). In the settings menu, users can configure the data permission mode for the app, set row-level permissions for datasets, enable the sharing link for the app, and configure chart interactions within the shared link.
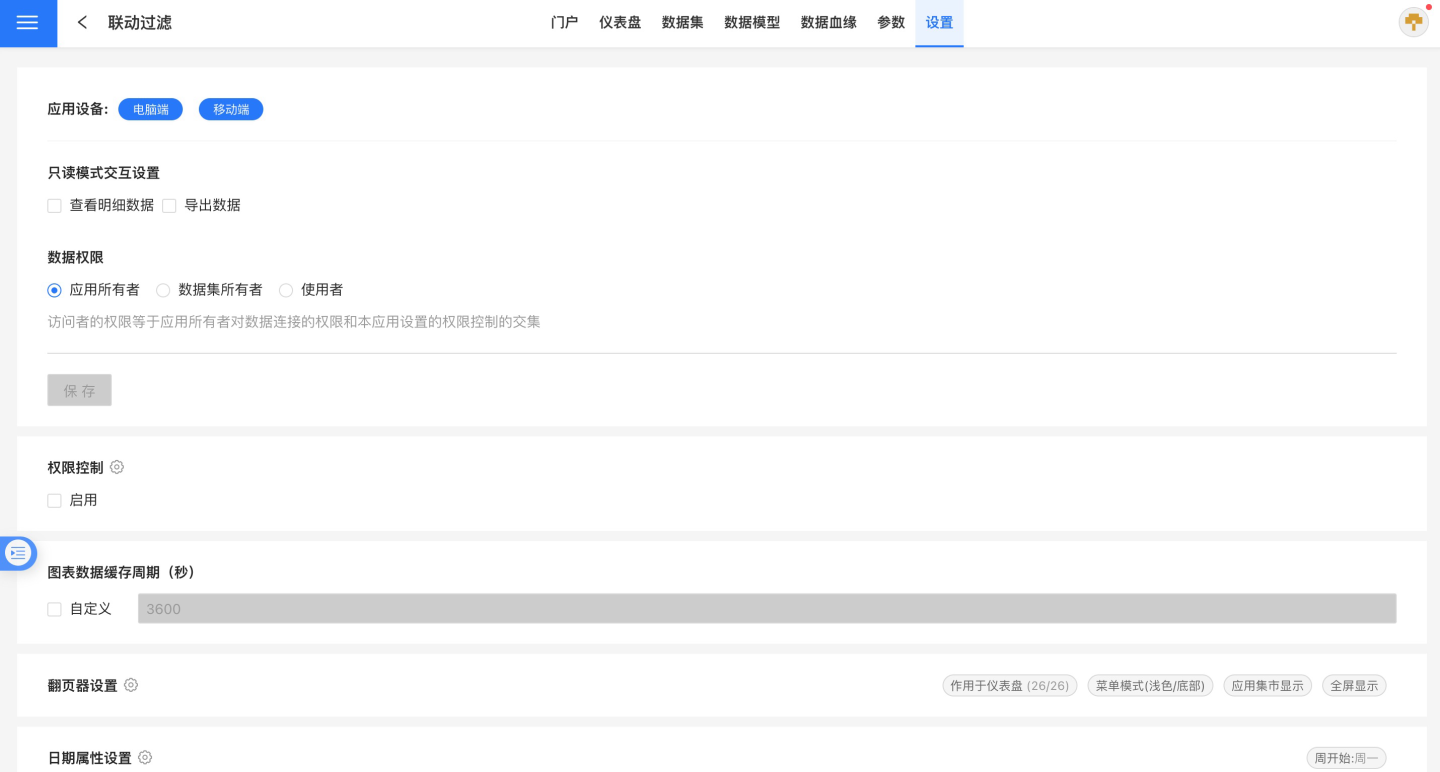
Application Devices
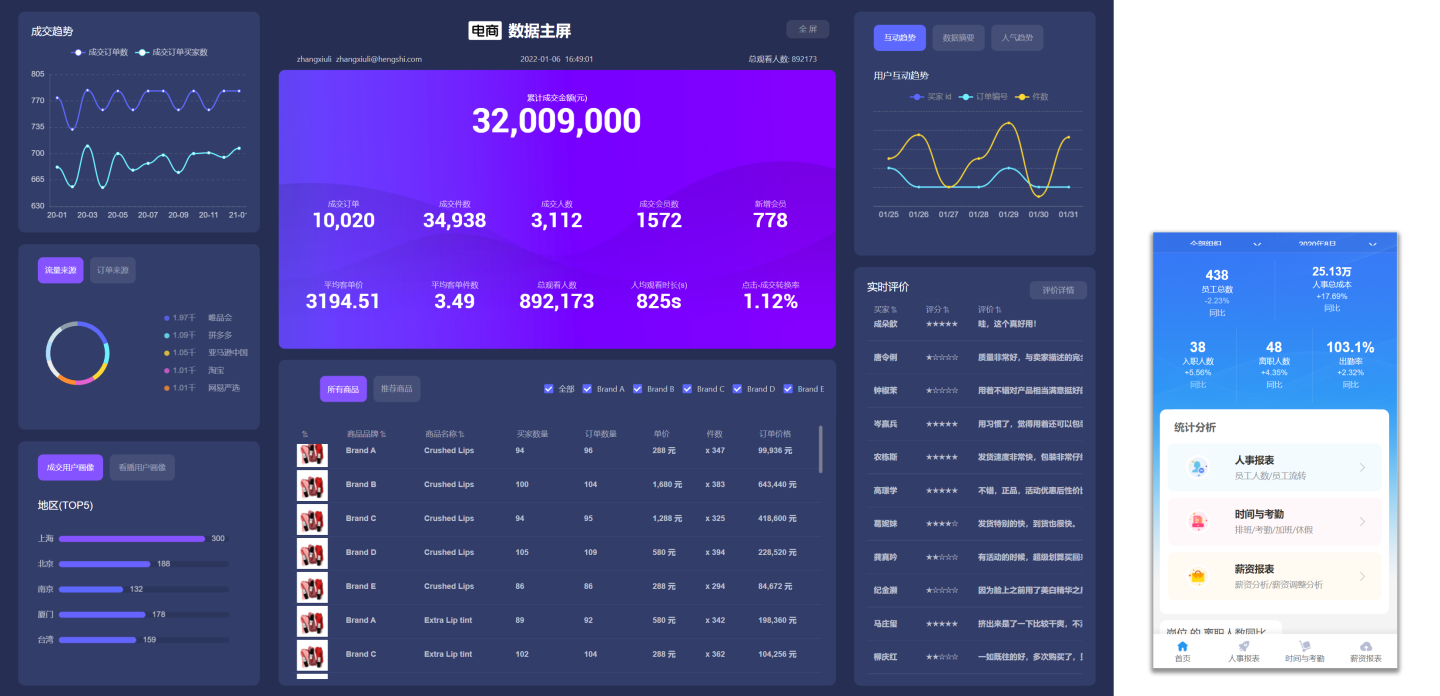
The dashboard displays differently on desktop and mobile devices. The application settings include device configuration, presenting the corresponding editing page based on the selected device. For users utilizing a single display device, operations become more convenient.
The image below shows examples of desktop and mobile displays.
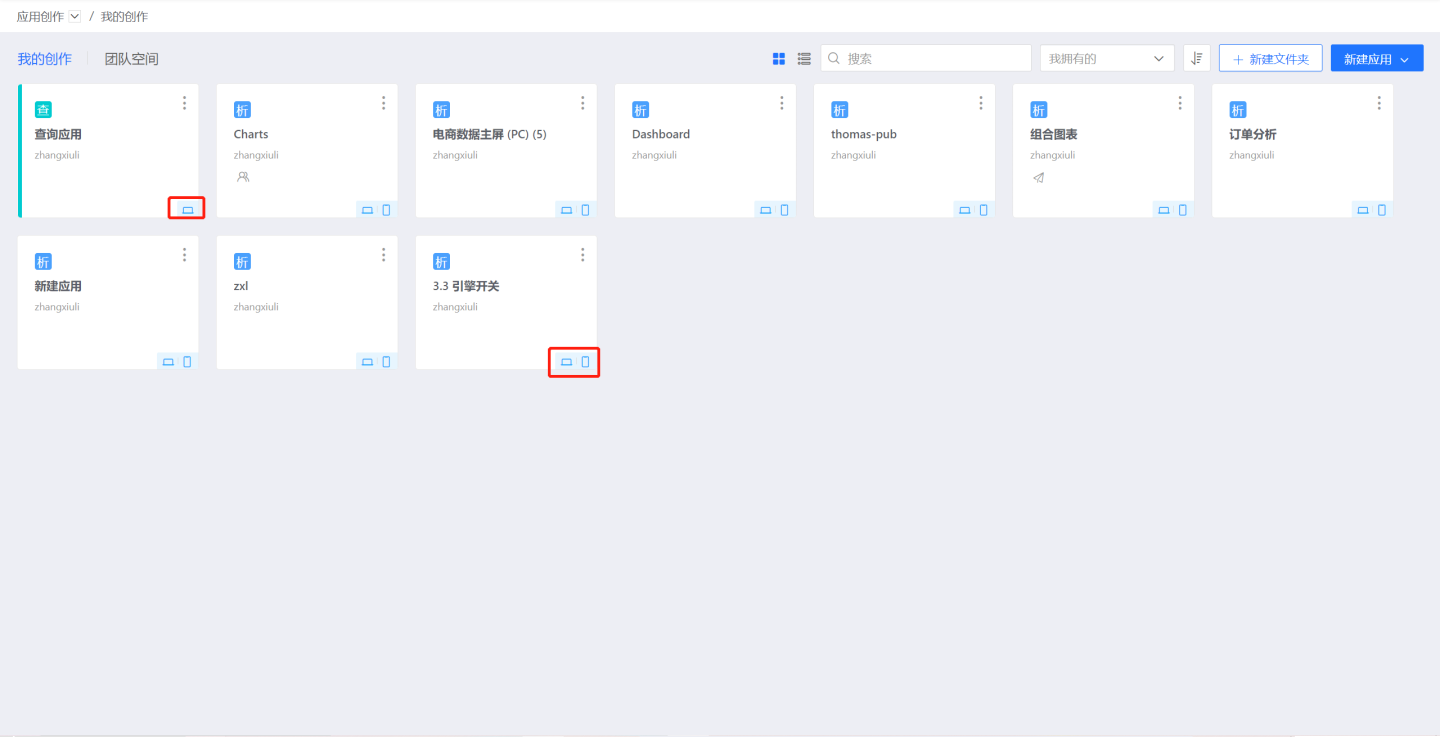
During application editing, the display device can be modified at any time. The application's display device will be shown on the card. Query applications are only supported on PC.
Interaction Settings in Read-Only Mode
When sharing a public link, the interactive permissions that can be set include:
By default, the interactive permissions for sharing a public link are: not allowing viewing detailed data and not allowing exporting data. If shared with the default settings, the operations for viewing detailed data and exporting data will be unavailable in the shared link.
Data Permissions
By setting data permissions for the app, users can only view and use data within the authorized scope, enabling controlled data distribution. Administrators can decide which data users can see when accessing the app.
Data permissions are divided into three types: App Author, Dataset Author, and User. When creating an app, the default permission is App Author.
App Author
Using the App Author permission is primarily for scenarios where analysts create analysis models, and all users with access to the app within the system can view the complete data in the app without needing additional permission settings.
All accounts with access to the app will see the same data as the app creator.
The app manager can set row-level permissions on datasets to restrict data. For accounts with access to the app, the data they see will be based on the app owner's view, with the addition of row-level permissions applied.
Dataset Author
Dataset authors use creators' data to publish applications, enabling the reporting and sharing of operational metrics. Relevant teams can promptly identify and adjust strategic directions.
Using dataset author permissions is also a form of sharing within the system. Publishers can set permission controls within the application to specify the accounts that can access the application and the data access scope corresponding to each account, thereby granting reading permissions for the application to designated users.
Application managers can add rules to datasets. Other non-manager accounts with access permissions to the application will see data with row-level permissions added, based on the data visible to the dataset owner.
User
Using user data allows enterprises to simplify the process of embedding rich data applications into various business systems by controlling user access to data through permissions on data connections within the HENGSHI SENSE product.
Using user data is a form of internal sharing within the system. When the application publisher sets permission controls in the application, they only need to specify the accounts that can access the application. The visible data scope for these accounts within the application is determined by the permissions on the connection.
In the User mode, the engine functionality is disabled. Additionally, in this mode, row-level permissions are not effective, and data visibility is controlled based on the current account's connection permissions.
Please Note
If the application contains datasets imported into the engine, switching to User mode is not allowed.
Permission Control
Chart Data Cache Cycle
The chart data cache cycle refers to the period during which chart data for each query is read from the cache. The default is 3600 seconds, which equals 1 hour. In other words, chart data is stored in the cache for 1 hour, and the system refreshes the data once the cache cycle is exceeded.
Each app supports custom settings for the chart data cache cycle. If not set, the chart data is updated according to the time specified in System Settings->Chart Data Cache Cycle.
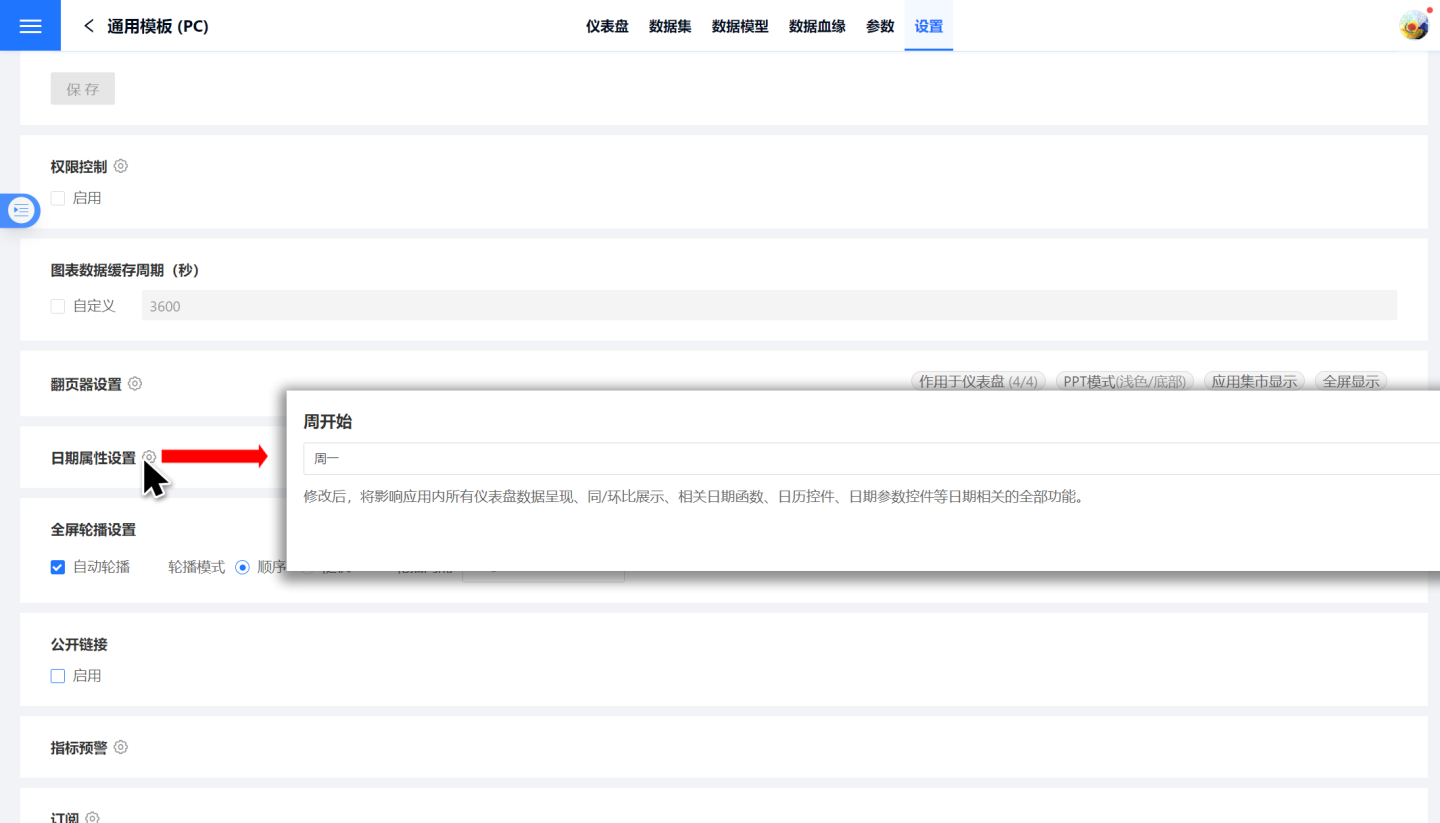
Date Attribute Settings
The system's date display format is fixed from Monday to Sunday. However, different business statistics cycles may vary; some business cycles run from Sunday to Saturday. In such cases, you can customize the start date of each week through the date settings, making it convenient for users to perform data cycle statistics, year-over-year and month-over-month comparisons, and other operations.
Once the date attribute is set, it applies to the entire application. Date-related parameter controls, date filters, and other controls within the application will display according to the configured date attributes. Year-over-year and month-over-month cycle calculations will also be performed based on the configured date attributes.
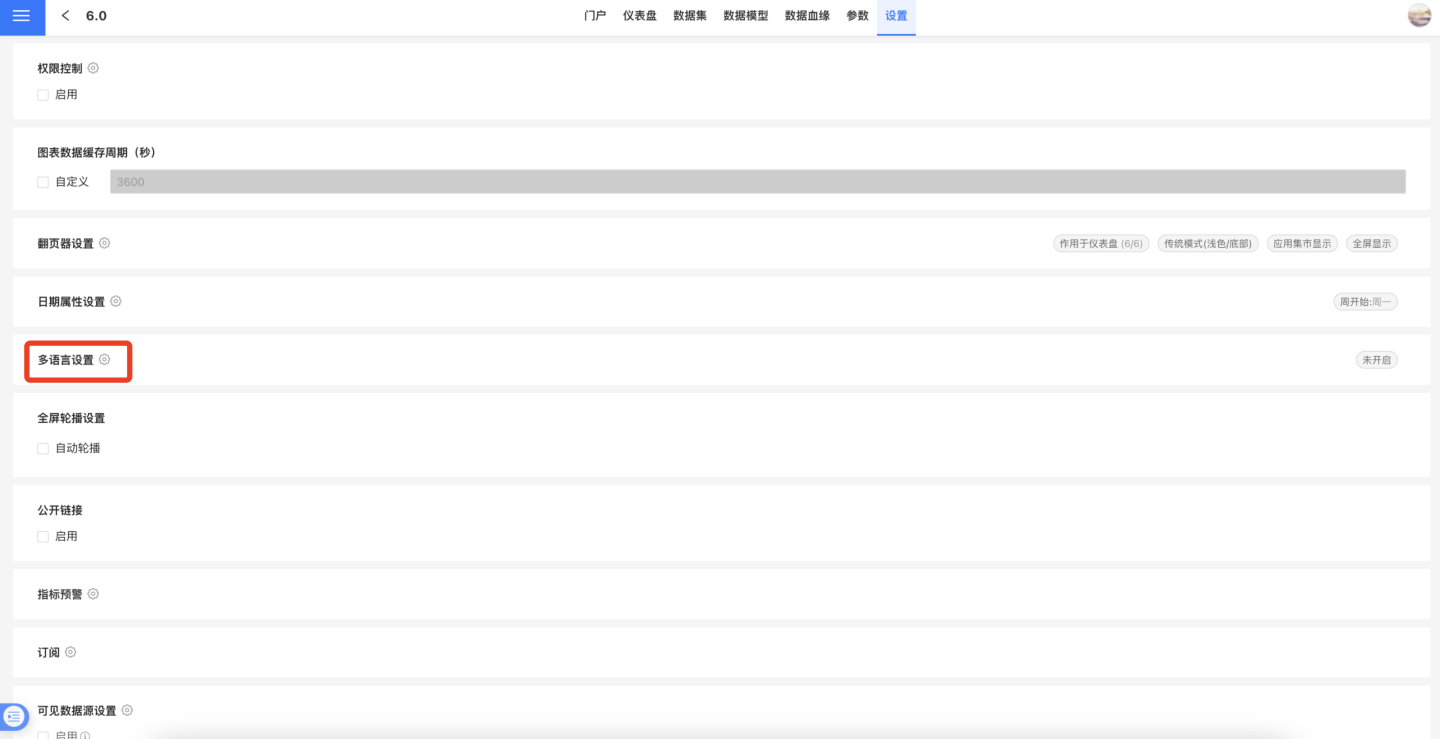
Multi-language Settings
Many overseas customers use HENGSHI SENSE to view reports. Data scientists create reports not only for domestic users but also for overseas users. Previously, analysts had to duplicate reports and configure them in different languages, which resulted in high production and maintenance costs.
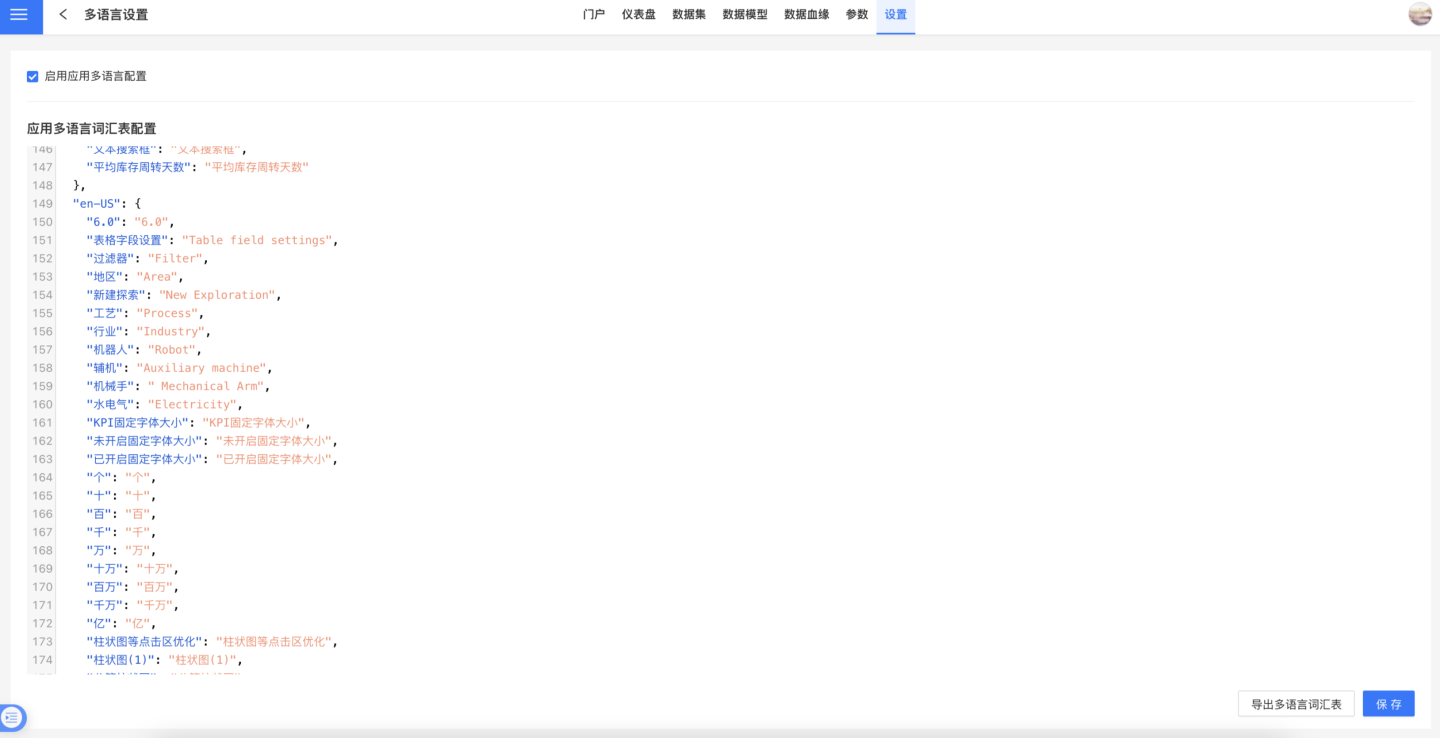
In version 6.0, a new [Multi-language Settings] feature has been added to the application settings. Application administrators can configure, edit, and save multi-language glossaries online. Once saved, they can enable the [Application Multi-language Configuration], completing the multi-language setup for the application.
Additionally, analysts can export the multi-language glossary, which is exported as a JSON file. After editing locally, the content can be copied and pasted into the multi-language glossary configuration and saved.
The multi-language glossary includes content such as: application name, portal title/subtitle/menu, dashboard name, chart title, field name, filter/parameter control name, and other static resources.
Pager Settings
Please refer to App Pager to learn the specific usage of the pager.
Global Carousel
Global Carousel refers to the dashboard carousel display within the application in full-screen mode. It supports two modes: sequential carousel and random carousel.
After enabling automatic carousel, the application will enter full-screen mode, and the dashboard will automatically carousel based on the settings.
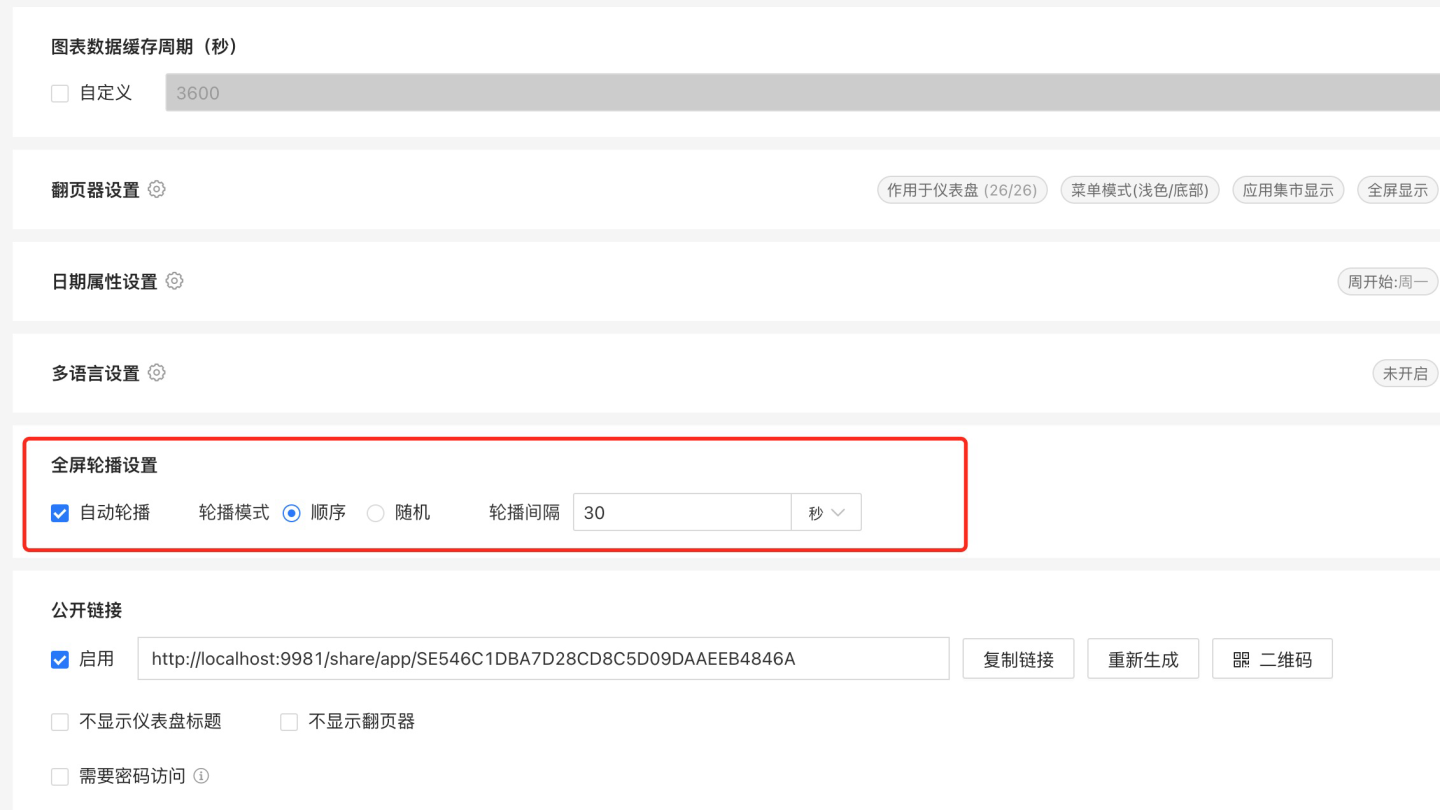
Public Link
See Public Link
Indicator Warning
Subscription
See Subscription
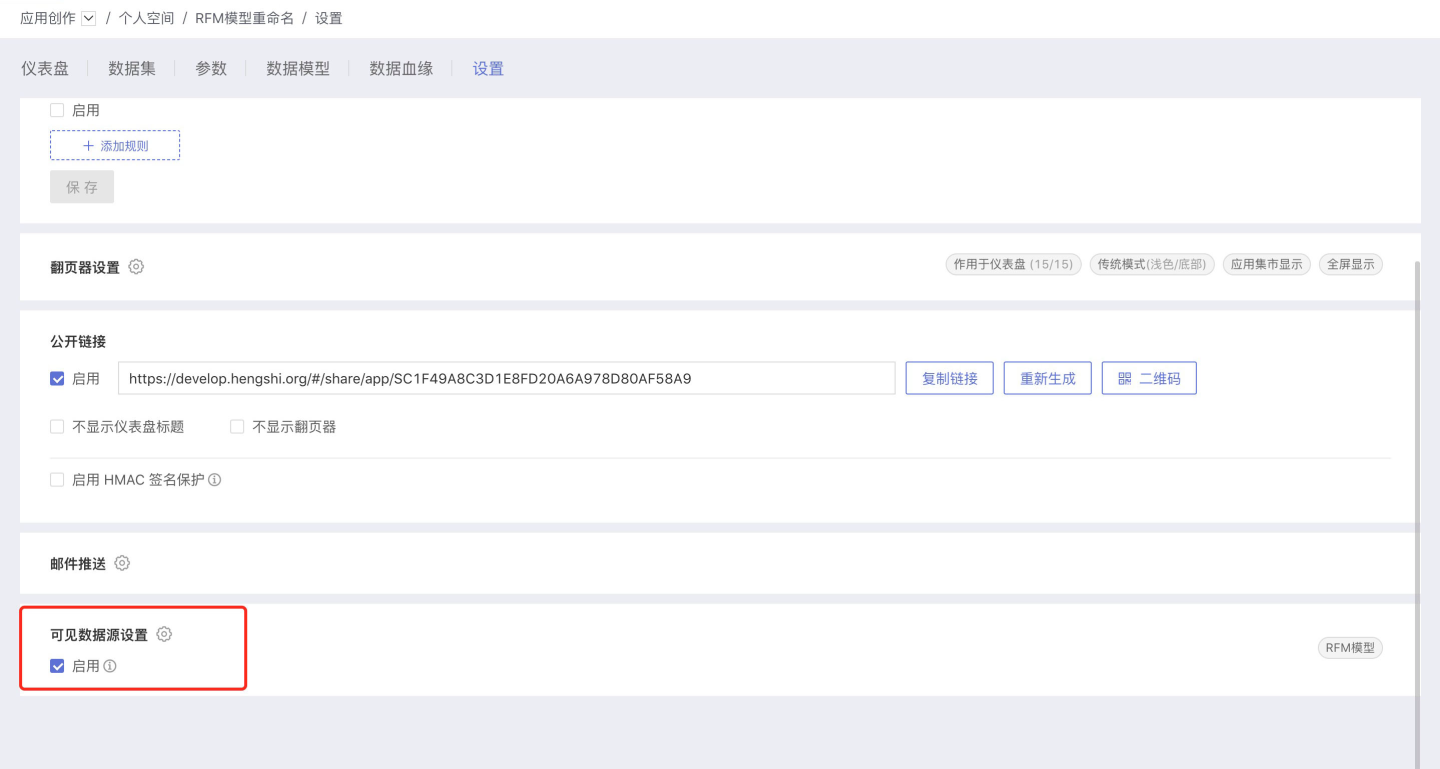
Visible Data Source Settings
Click App -> Settings, and navigate to the Visible Data Source Settings section.
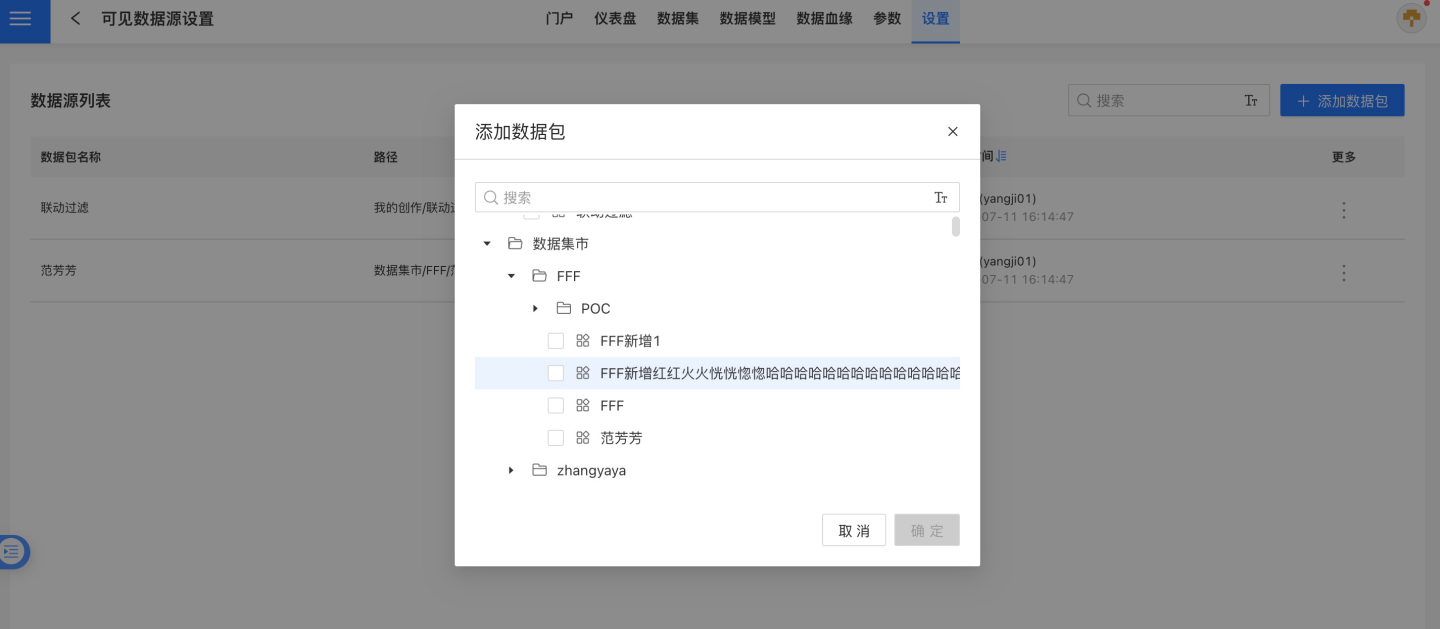
The purpose of the visible data source settings is to configure the data sources that can be used for chart creation within the current app, including data packages from both the current app and the dataset marketplace.
When a user wants to use only specific data sources for chart creation in an app, they can set those data sources as visible. This avoids the need to select from a long dropdown list of data sources every time a chart is created, making the chart creation process more convenient.
By default, visible data sources are disabled. When disabled, all data sources are visible.
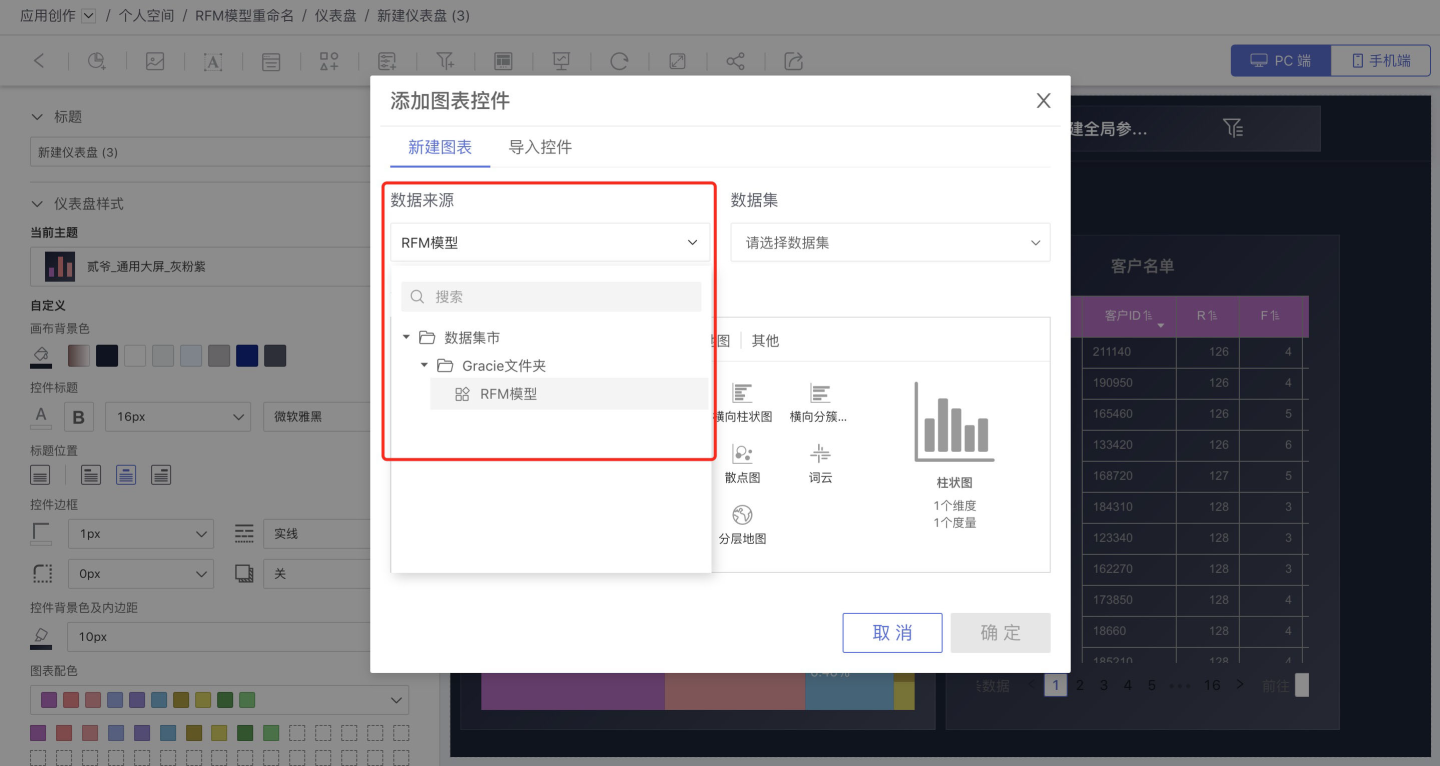
When enabled, only the data sources selected in the visible data source settings are visible. These data sources will appear in the dropdown list for data sources during chart creation.
If no data sources are selected, the dropdown list for data sources during chart creation will be empty.
If only one data source is selected, the dropdown list for data sources during chart creation will default to that data source, allowing users to directly select a dataset without switching data sources.
Visible data source settings do not control backend data source permissions; they only control the list of data sources available for chart creation in the current app.
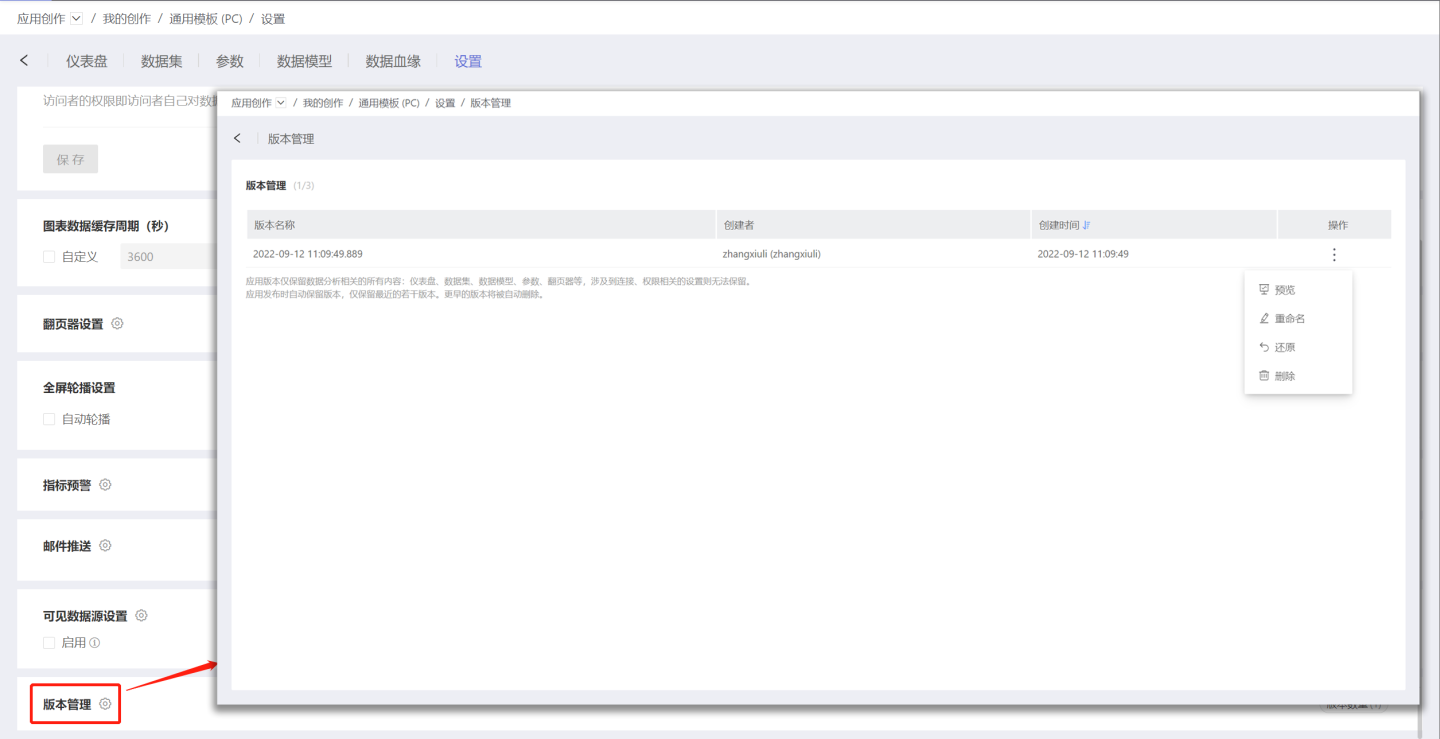
Version Management
After an application is released, it may continue to update its content and release new versions. As a result, an application might have multiple versions. New versions overwrite the content of old ones, making it impossible for users to view the content of a previously released version.
The application version management feature saves the data and related analysis content at the time of application release. When there is a need to revert to a historical version, users can find the desired version in the application management section and restore it with one click, quickly and conveniently. The application version management feature is currently not available for tenant scenarios.
Application versions only retain all content related to data analysis: dashboards, datasets, data models, parameters, paginators, etc. Settings related to connections and permissions cannot be preserved. Versions are automatically saved upon application release. To avoid occupying excessive memory space, only the latest three versions are retained, and older versions are automatically deleted.