Dashboard
The dashboard consists of a Canvas and Widgets. As shown in the figure, the red area is the canvas, where various widgets are arranged to display data analysis information. 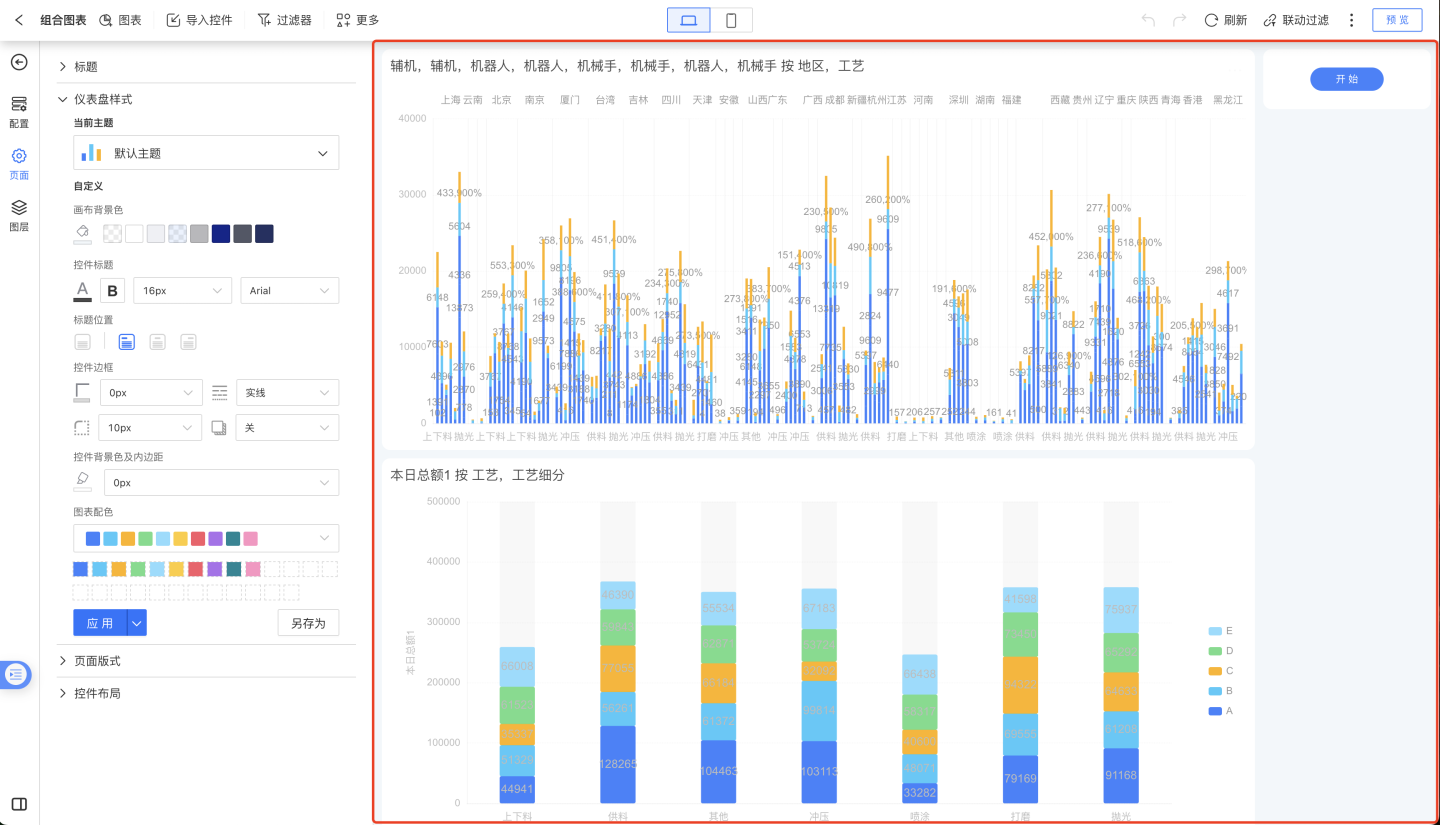
Dashboard Management
You can perform the following operations on the dashboard list page:
- View the dashboard recycle bin
- Enter dashboard preview mode
- Manage dashboard sorting, hiding, and other operations
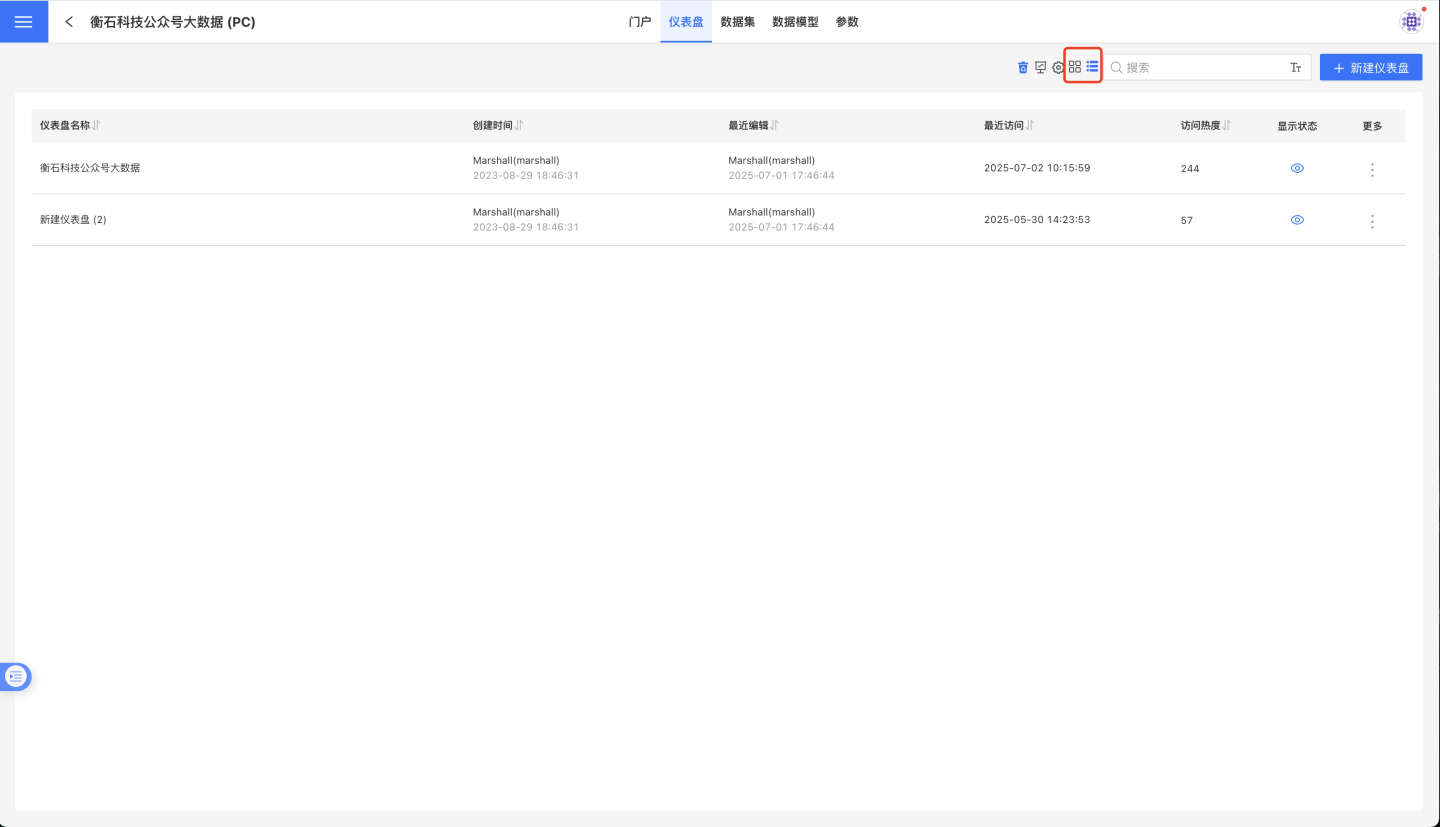
- Switch between dashboard list view and card view
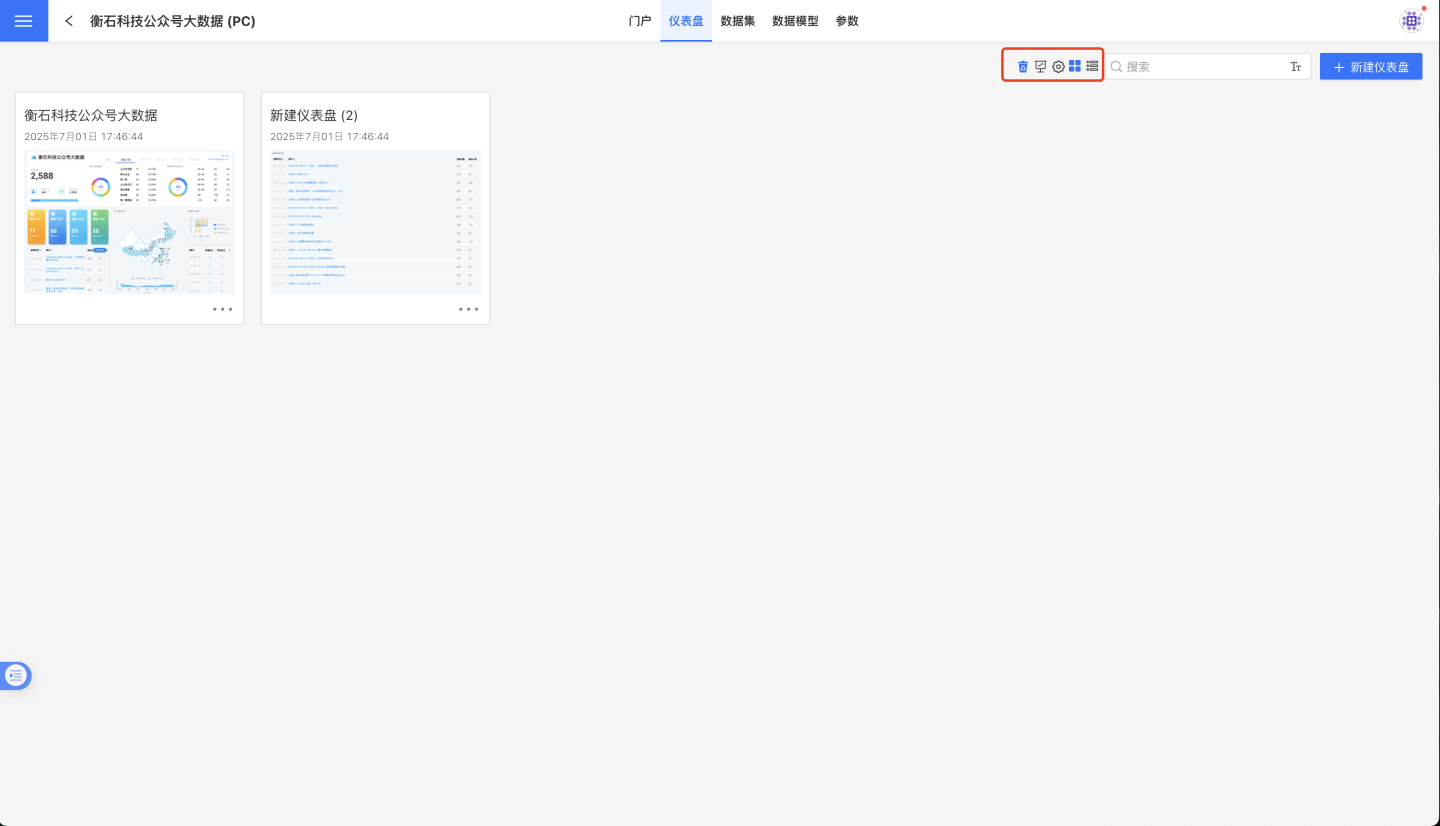
The default display is the card-style list. Click the list icon in the image to switch to the list view. You can click the sorting icon in the header fields to arrange items in ascending/descending order.
Click the three-dot menu at the bottom right corner of the dashboard to bring up the action menu. The dashboard supports the following operations:
- Rename
- Delete
- Create a copy
- Copy to
- Manual sorting
- Hide
Rename
Click the Rename button to open a popup window. Enter the dashboard name and click Confirm to complete the renaming of the dashboard.
Delete
You can perform delete operations on dashboards. When a dashboard is deleted, the charts within the dashboard will also be deleted. At this point, the dashboard is only moved to the app's recycle bin and is not permanently deleted. 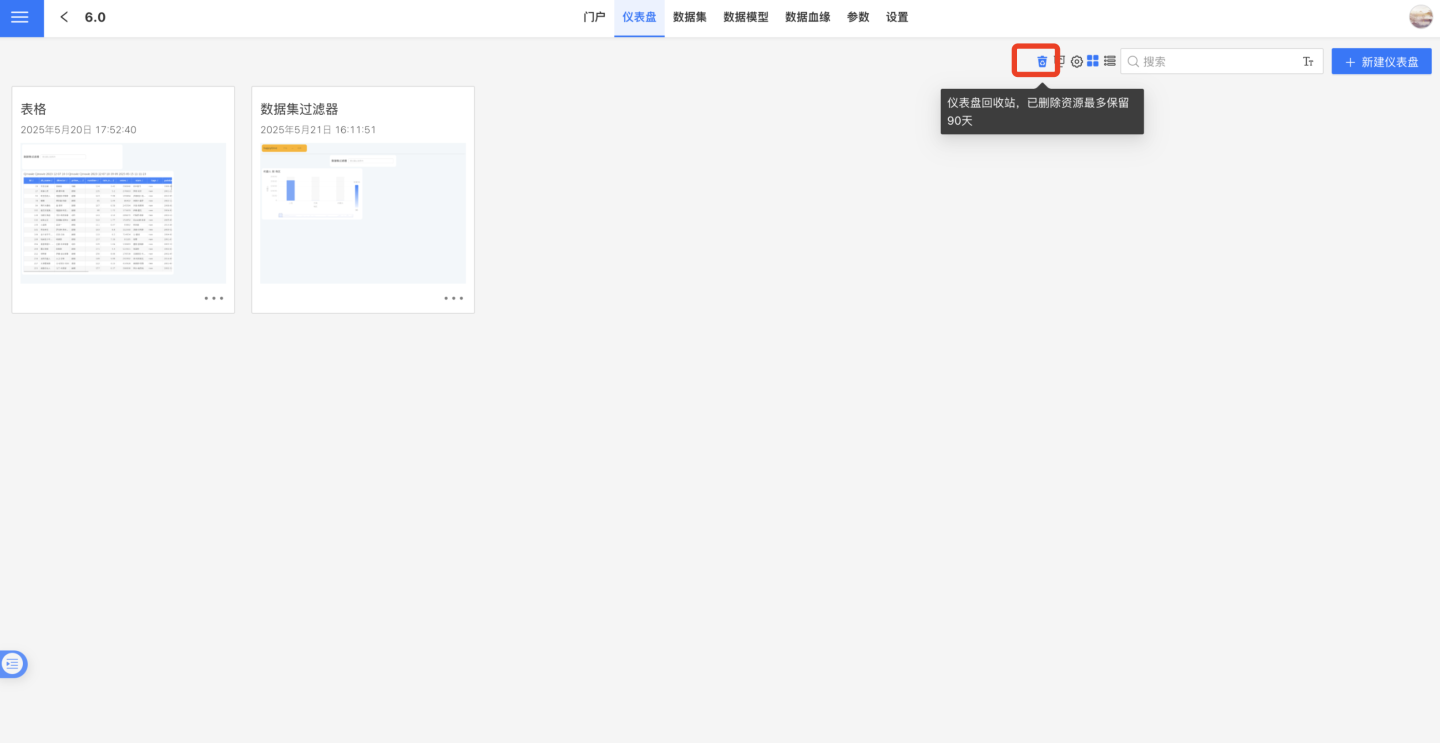
Dashboards stored in the app's recycle bin can be restored or permanently deleted. Resources in the recycle bin are retained for up to 90 days. Only users with app management and app editing permissions can see the recycle bin entry within the app. 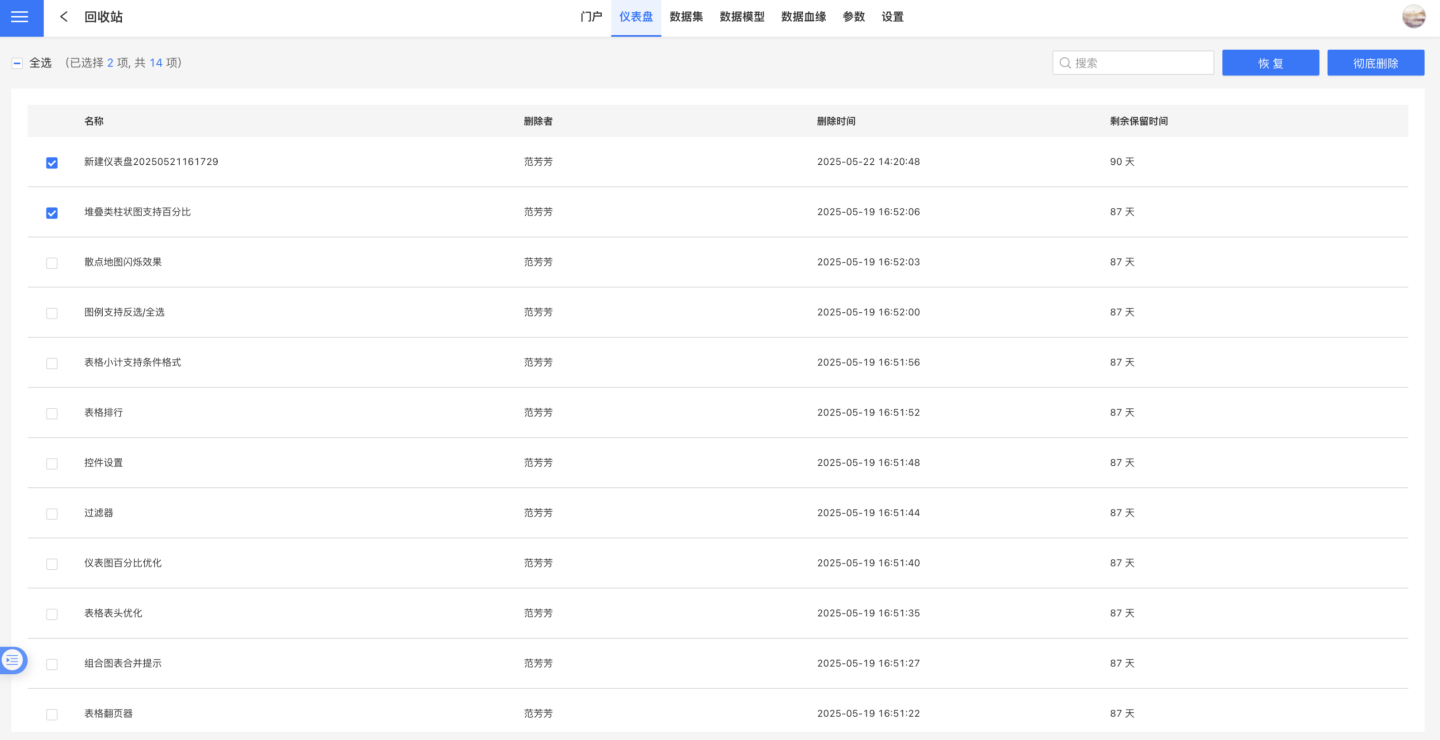
Create a Copy
Click the Create a Copy button to duplicate the dashboard, including the charts within the dashboard. The copied dashboard will appear at the end of the current app.
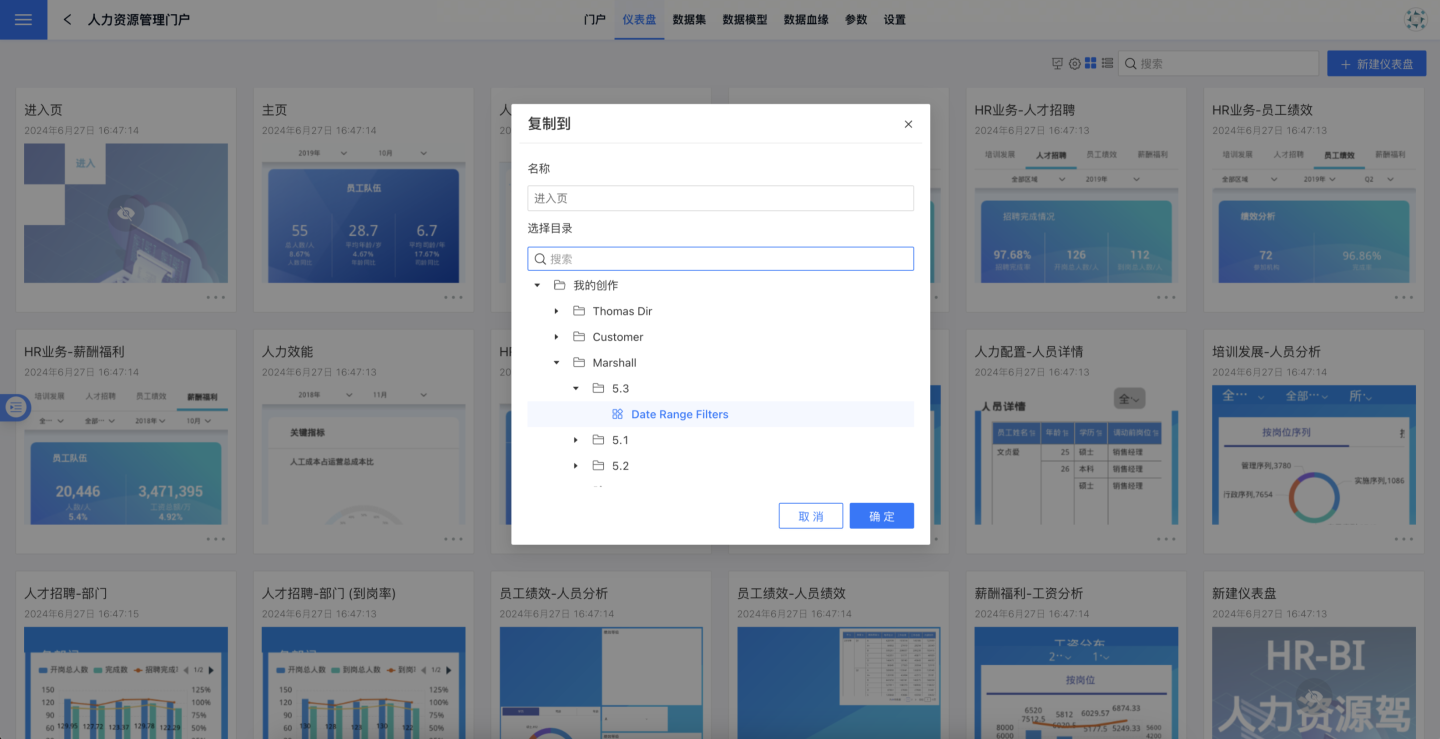
Copy To
An app serves as an independent analysis scenario, containing multiple datasets and dashboards. Dashboards rely on datasets, so copying dashboards between different apps requires consideration of the following two situations:
- If the dashboard's data comes entirely from the dataset marketplace, simply copy the required dashboard to the target app.
- If the dashboard's data comes from within the app, after copying is complete, you need to perform data replacement operations for the related charts.
Manual Dashboard Sorting
The system defaults to sorting dashboards based on their creation order, with the most recently created dashboard appearing at the end. The sort button in the upper-right corner of the dashboard allows for custom sorting, as shown in the figure below.
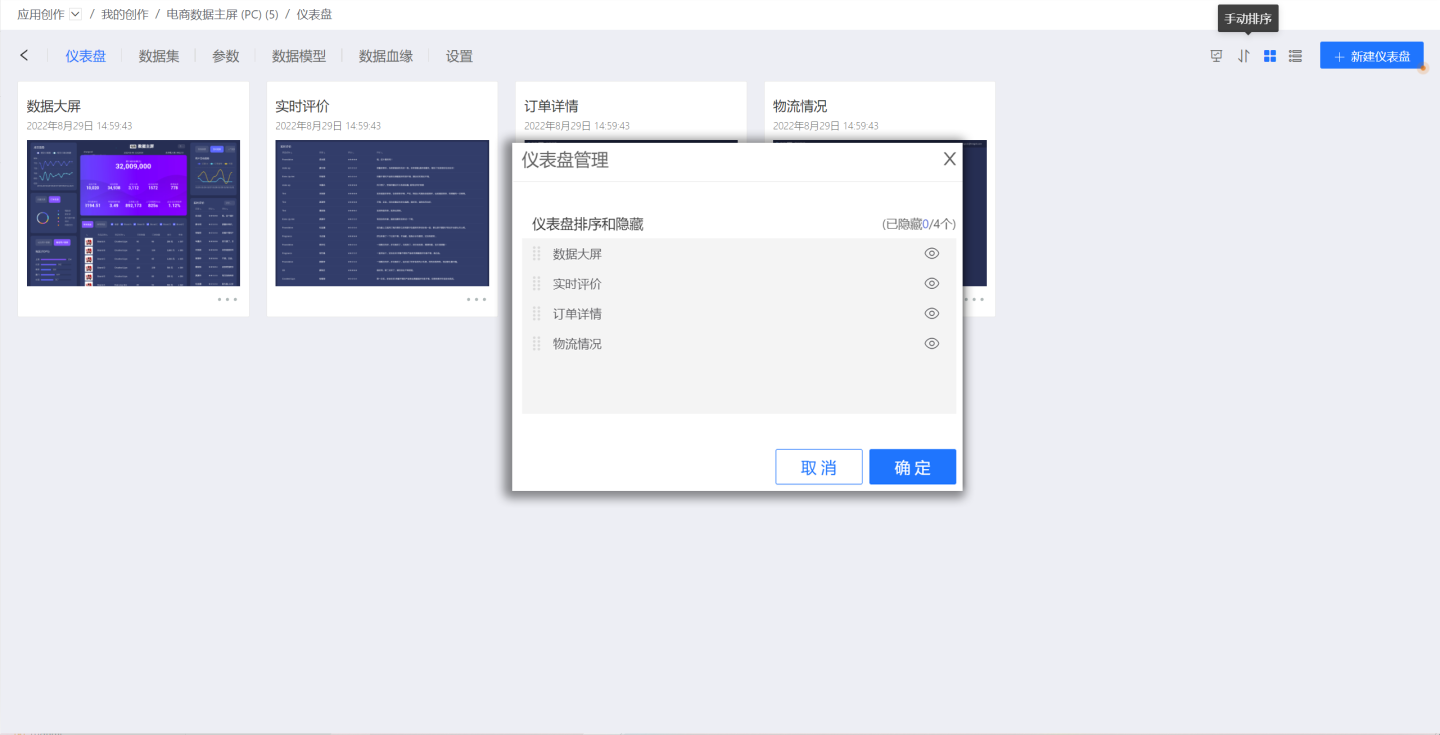
Custom sorting can be completed by dragging.
Hide Dashboard
When the dashboard does not need to be displayed, it can be hidden. The hidden dashboard is shown as follows.
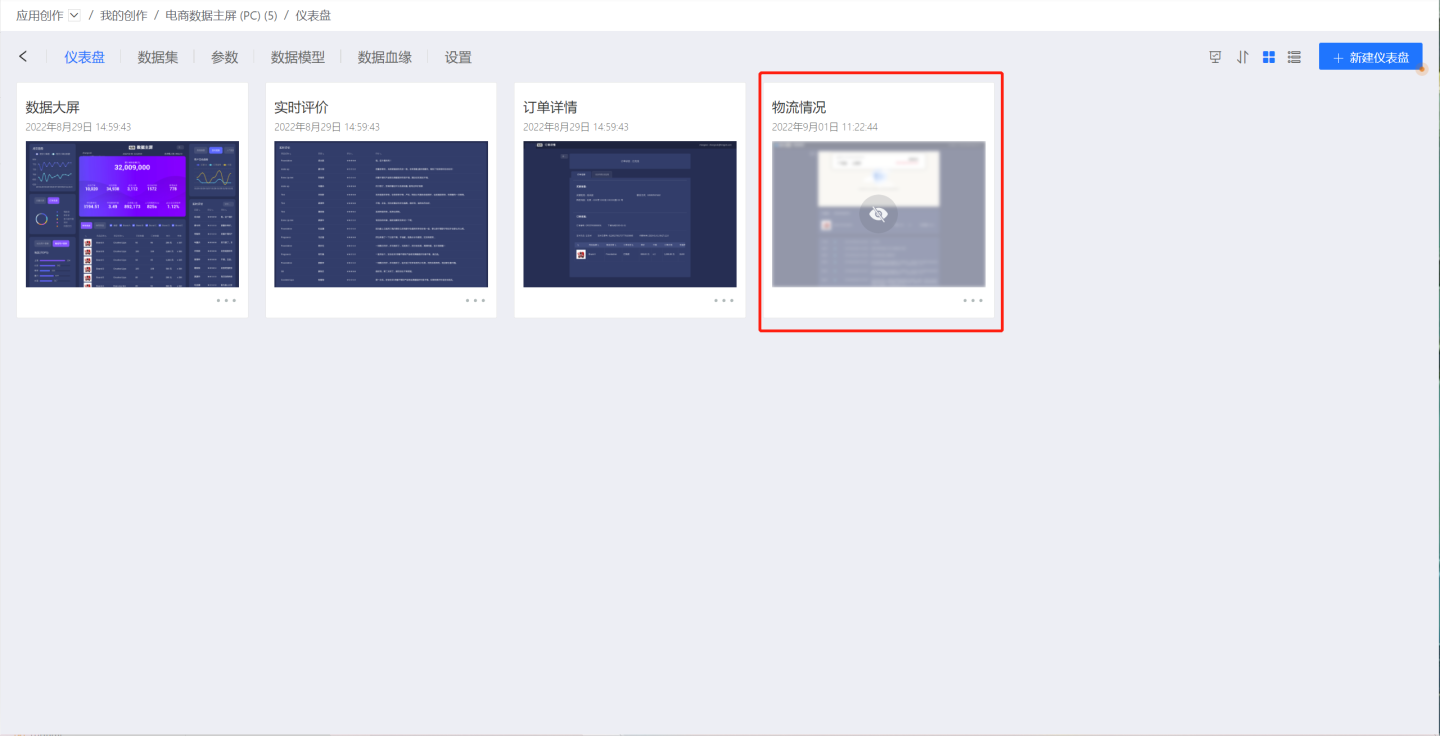
After the dashboard is hidden, the "Hide" option in the three-dot menu changes to "Show." Click "Show" to restore the dashboard display.
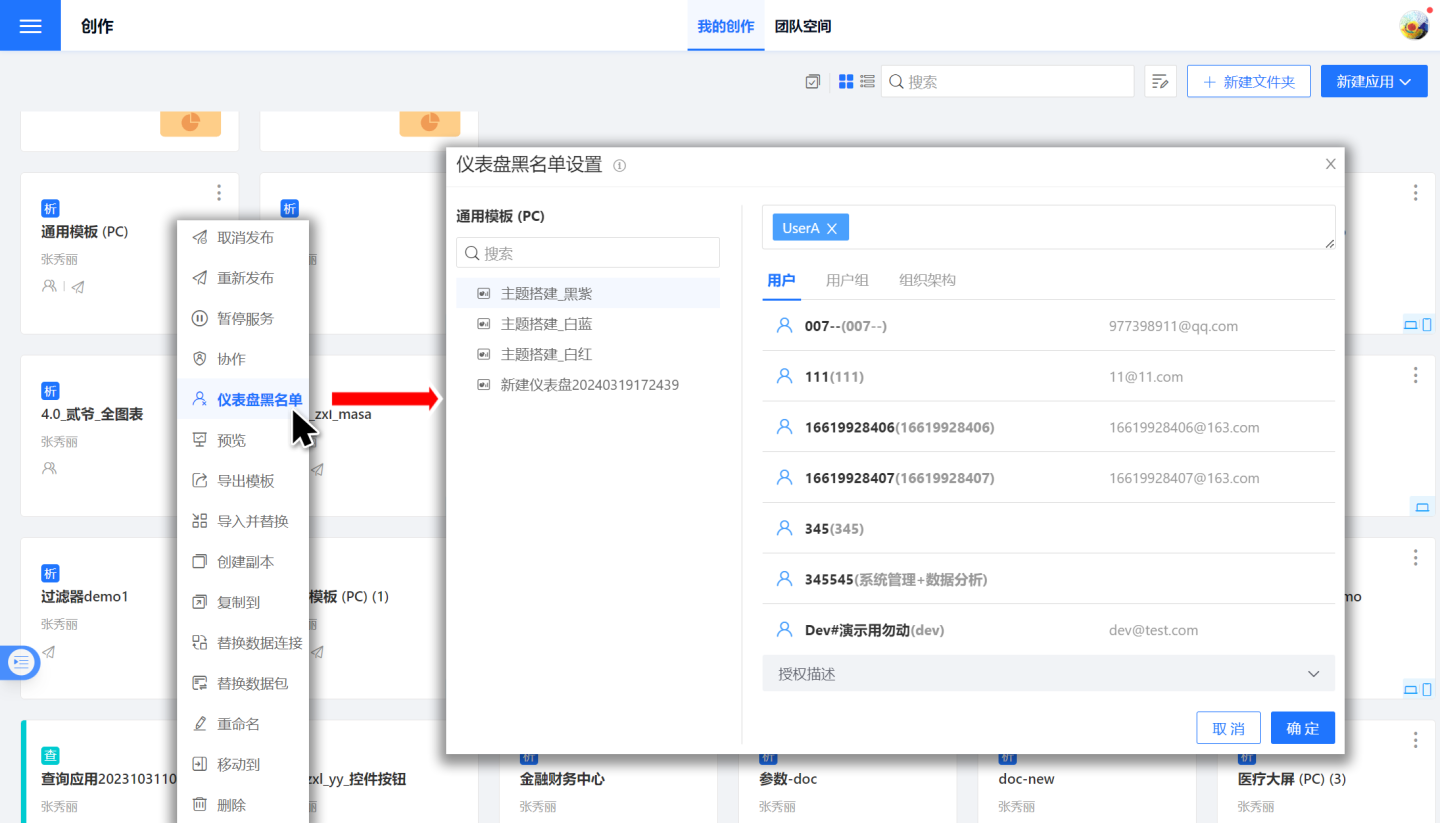
Dashboard Permission Management
Each app can consist of one or more dashboards. When an app is authorized for user access, dashboard permissions can be managed through a blacklist, specifying which dashboards within the app should be hidden from the user. Once a dashboard is added to the blacklist, the user will not see that dashboard when opening the app.
Dashboard Editing
After opening the dashboard, you will see all the charts within the dashboard.
Move the mouse over a chart and drag it to adjust its position. Drag the bottom-right corner of the chart to resize it.
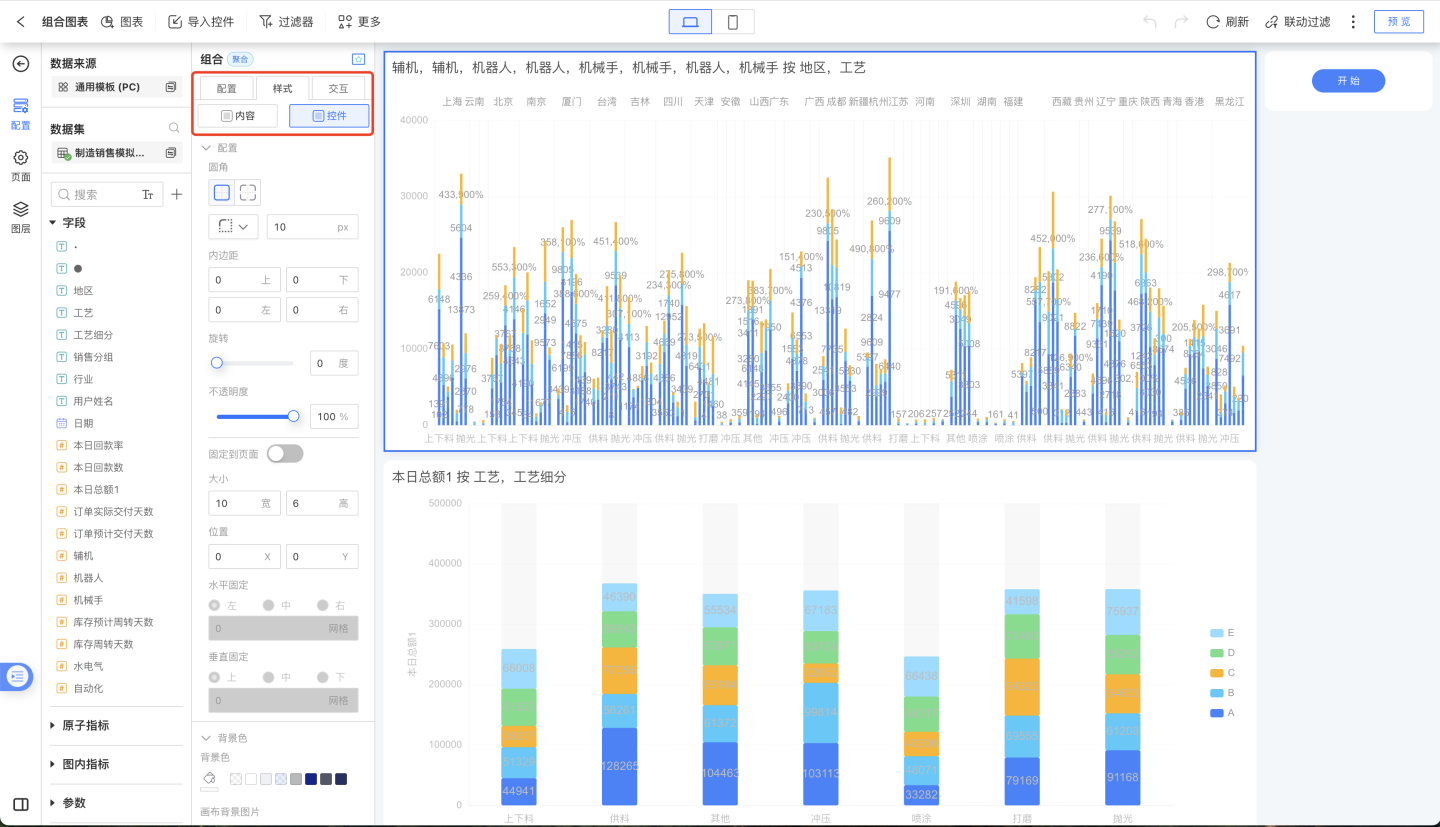
Toolbar
Top Left Corner
The menu in the top left corner of the dashboard is as follows, in order:
- Chart
- Import Controls
- Filters
- More
![]()
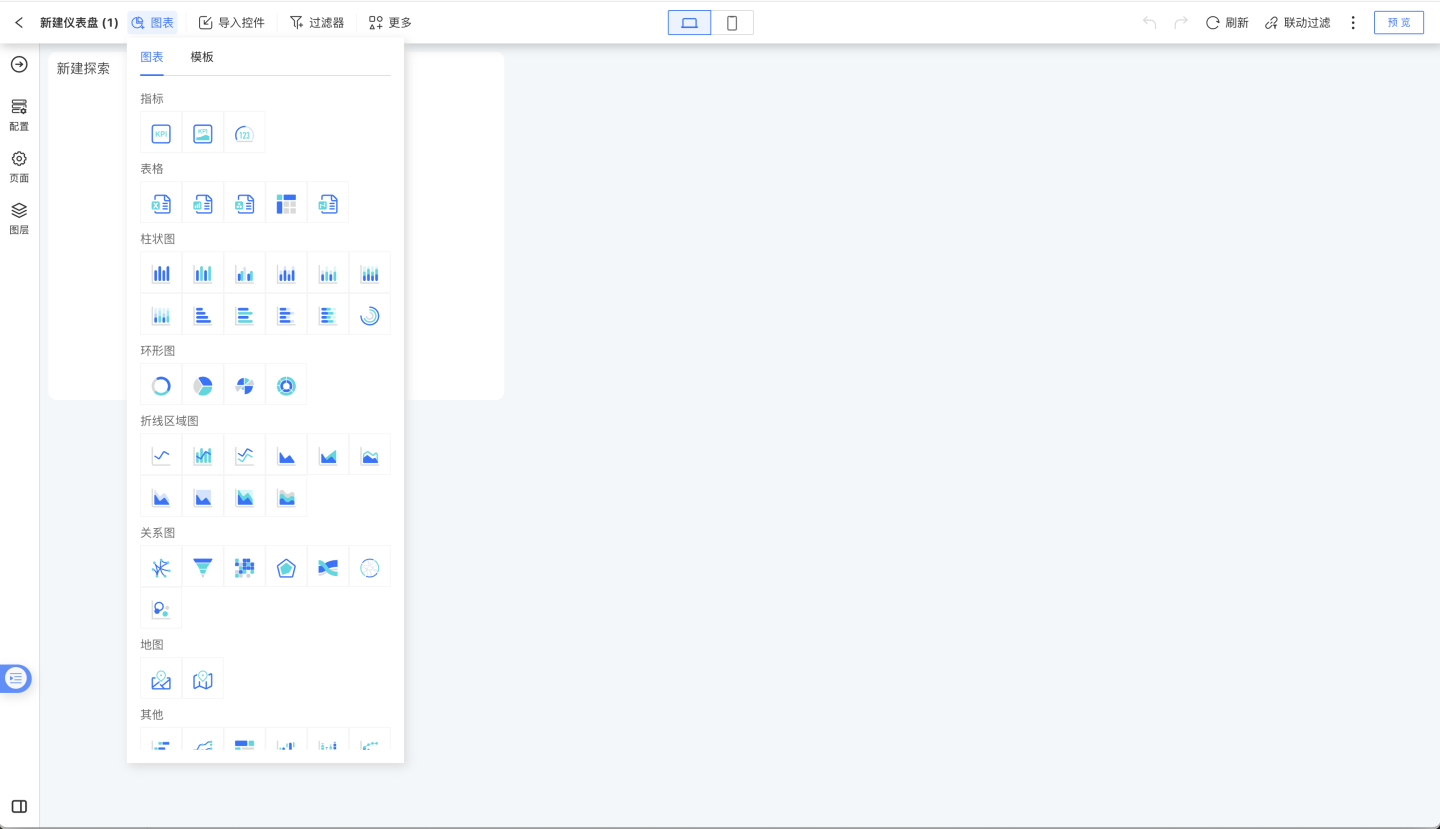
Chart
Click the Chart button to open the chart dropdown menu. Select any chart type to add a chart to the dashboard. When creating a chart, there are two methods: Create New Chart and Use Template.
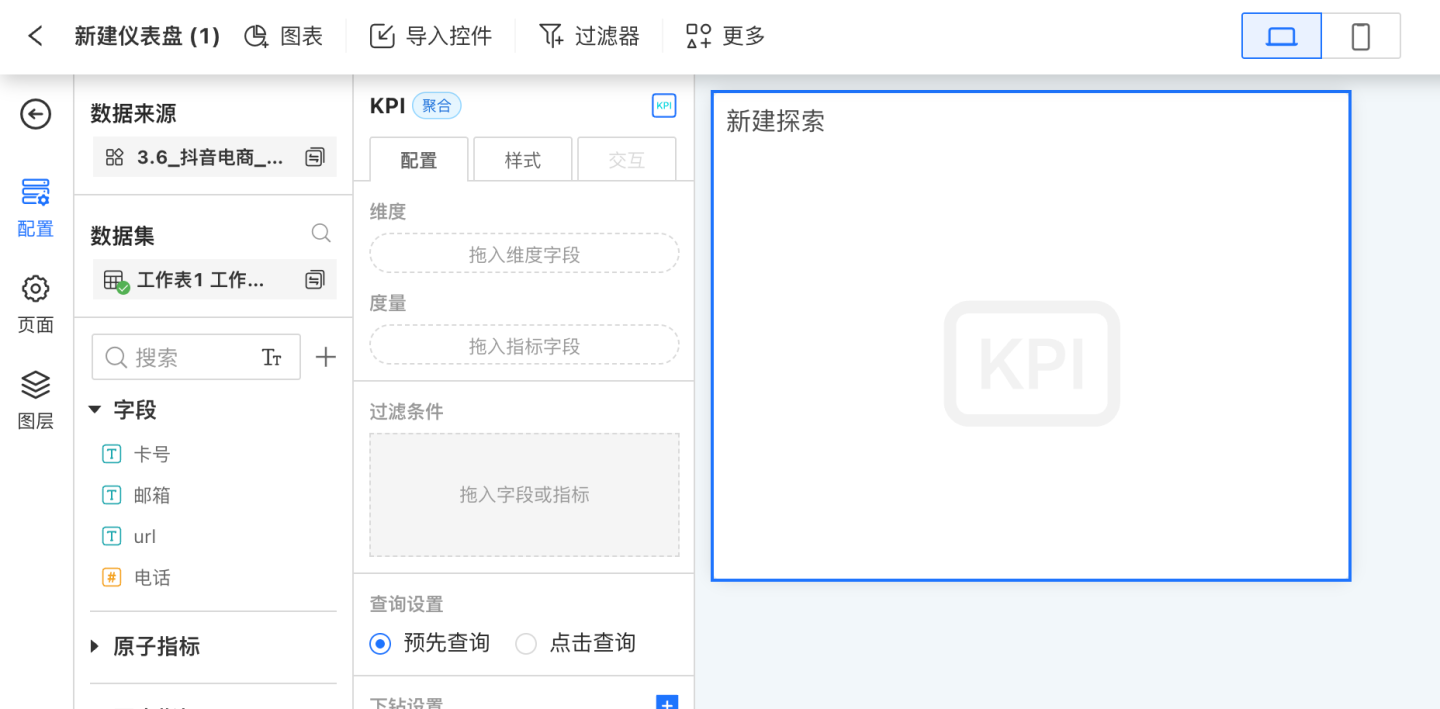
Create New Chart
After selecting the corresponding chart type to create a new chart, choose the data source from the
Data Sourcedropdown list in the sidebar. Here, you can select data packages from the dataset marketplace.
Use Template
Custom charts can be saved as templates. Click
Use Templateto select an existing chart template.
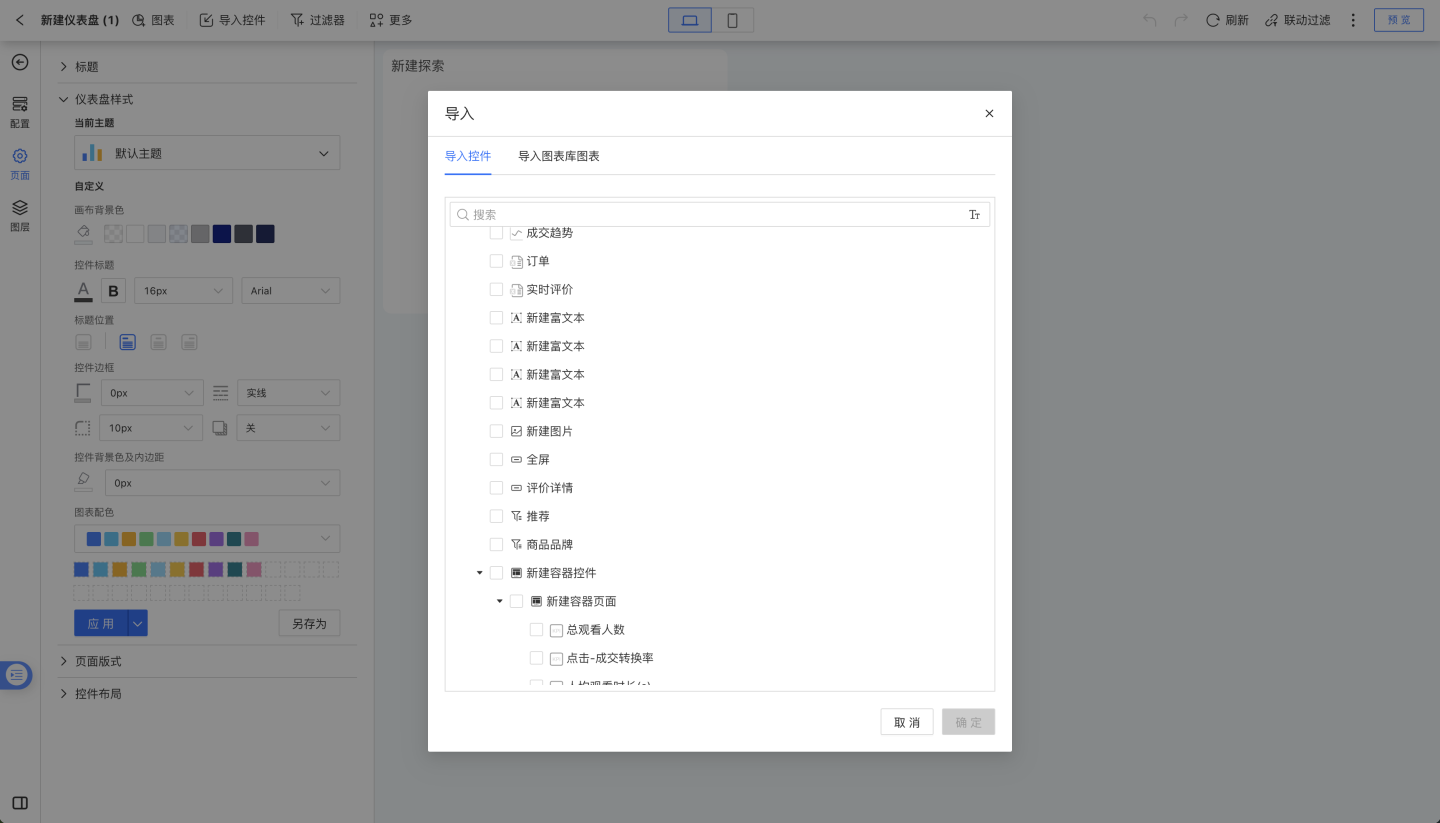
Import Controls
In the dashboard, you can import controls from other existing dashboards within the current app or from the chart library under the dataset marketplace. Importing controls supports importing charts, filters, and other controls. Clicking will bring up the import controls popup, which lists all dashboards in the app and the charts under each dashboard. Select the charts you want to import and click confirm to successfully import the charts. If there are too many charts in the current app, you can use the search function. The search supports searching by dashboard or chart name.
Filter
Click the Filter button to open the filter dropdown menu. Select the corresponding filter type to create a new filter in the dashboard. For detailed usage of filters, see Dashboard Filters.
![]()
More
Clicking the More button will bring up the additional menu, which includes:
- Container
- Button
- Rich Text
- Image
- Web Page
- Shape
- Square
- Triangle
- Arrow
- Prototype
- Icon
Clicking on any control type will create a corresponding control in the dashboard. Clicking on the icon will open the built-in icon popup. After selecting an icon and clicking confirm, the icon control will be successfully added. ![]()
![]()
Desktop and Mobile Preview Switch
Click the Desktop and Mobile Preview Switch button to toggle the preview mode of the current dashboard.
Top Right Corner
The menu in the top right corner of the dashboard is as follows, in order:
- Desktop and mobile preview toggle
- Undo, redo
- Refresh
- Linked filtering
- Collapsible three-dot menu
- Sample query
- Embed this app
- Embed this dashboard
- Dashboard PNG
- Dashboard PDF
- Dashboard data
- Play slideshow
- Full screen
- Preview
![]()
Undo, Redo
Click the Undo or Redo button to undo or redo the last operation.
Refresh
Click the Refresh button to refresh the current dashboard data.
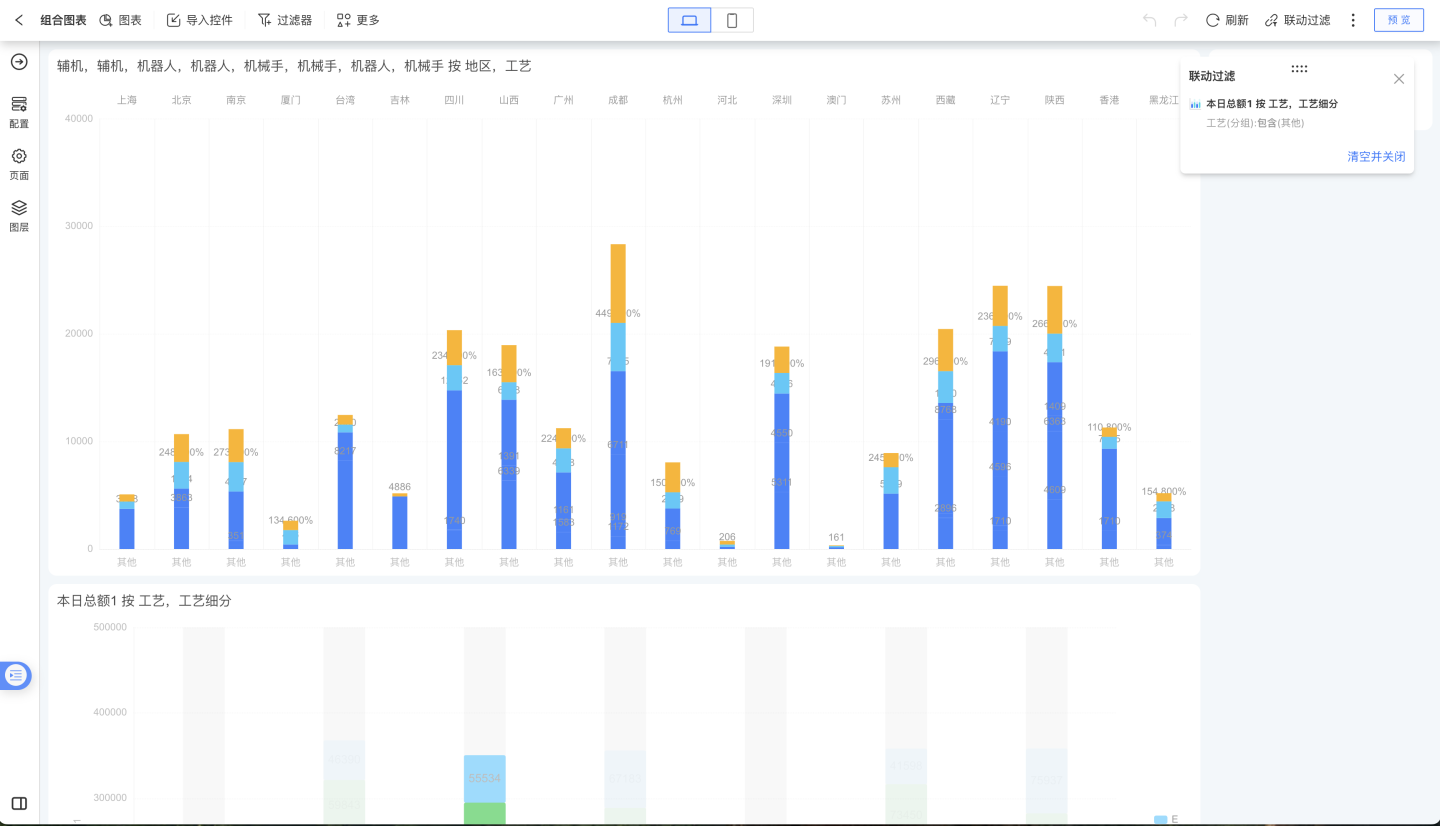
Linkage Filtering
While viewing charts, you can use a chart as a filter by clicking on a specific dimension group within the chart (e.g., a bar in a bar chart or a sector in a pie chart). Charts from the same dataset or charts with related datasets will update accordingly, displaying filtered results based on the selected group. Clicking the same group again will cancel the linkage effect.
Clicking the Linkage Filtering button enables the linkage filtering panel for the current dashboard, allowing you to view existing linkage filters.
As shown in the figure, after clicking "Documentary" in the "Arc Relationship Chart," all charts display only data related to documentaries.
Collapse Three-Dot Menu
In the menu at the top right corner of the dashboard, click Collapse Three-Dot Menu to reveal more features. These features are divided into 4 sections:
- Sampling Query: Perform sampling queries on data within the dashboard.
- Embed This App: Embed the current app into other apps.
- Embed This Dashboard: Embed the current dashboard into other dashboards.
- Dashboard PNG: Export the current dashboard as a PNG image.
- Dashboard PDF: Export the current dashboard as a PDF file.
- Dashboard Data: Export all chart data from the current dashboard as an Excel file.
- Slide Show: Play a slideshow of the current dashboard at the chart level.
- Full Screen: Enter full-screen mode to view the current dashboard.
Below is a detailed introduction to each feature:
Sampling Query
During the dashboard creation process, if the query statement for the corresponding dataset is too complex, it may result in prolonged dashboard loading times, affecting the creation experience. In this case, you can use the sampling query feature to quickly retrieve a portion of the dataset's data.
Embed This App
Click Embed This App to open the embed app popup, allowing you to embed the current dashboard into other external systems. The embed app only supports embedding via iframe. 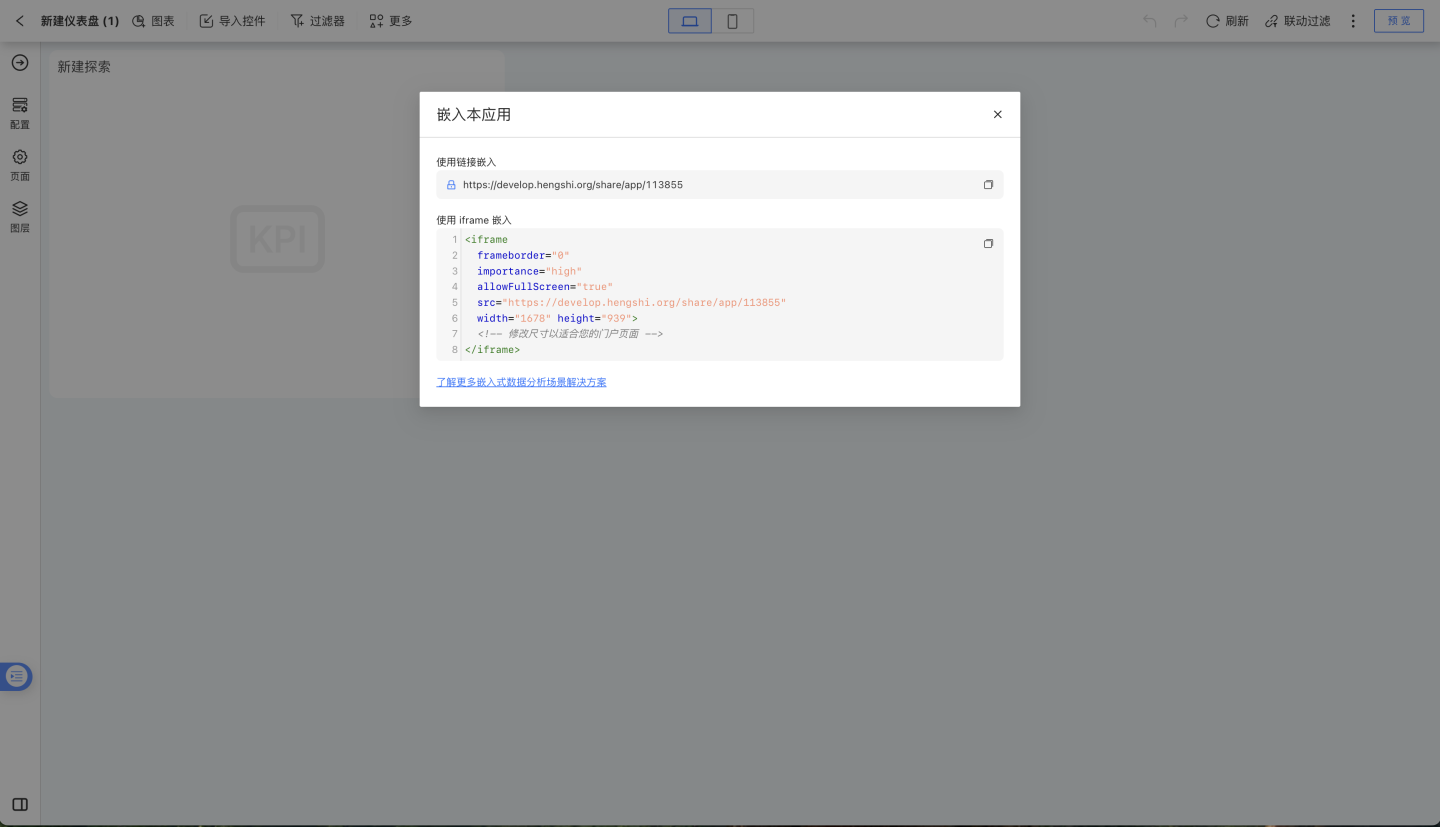
Embed This Dashboard
Click Embed This Dashboard to open the embed dashboard popup, allowing you to embed the current dashboard into other external systems. The embed dashboard feature provides two embedding methods: iframe and SDK. 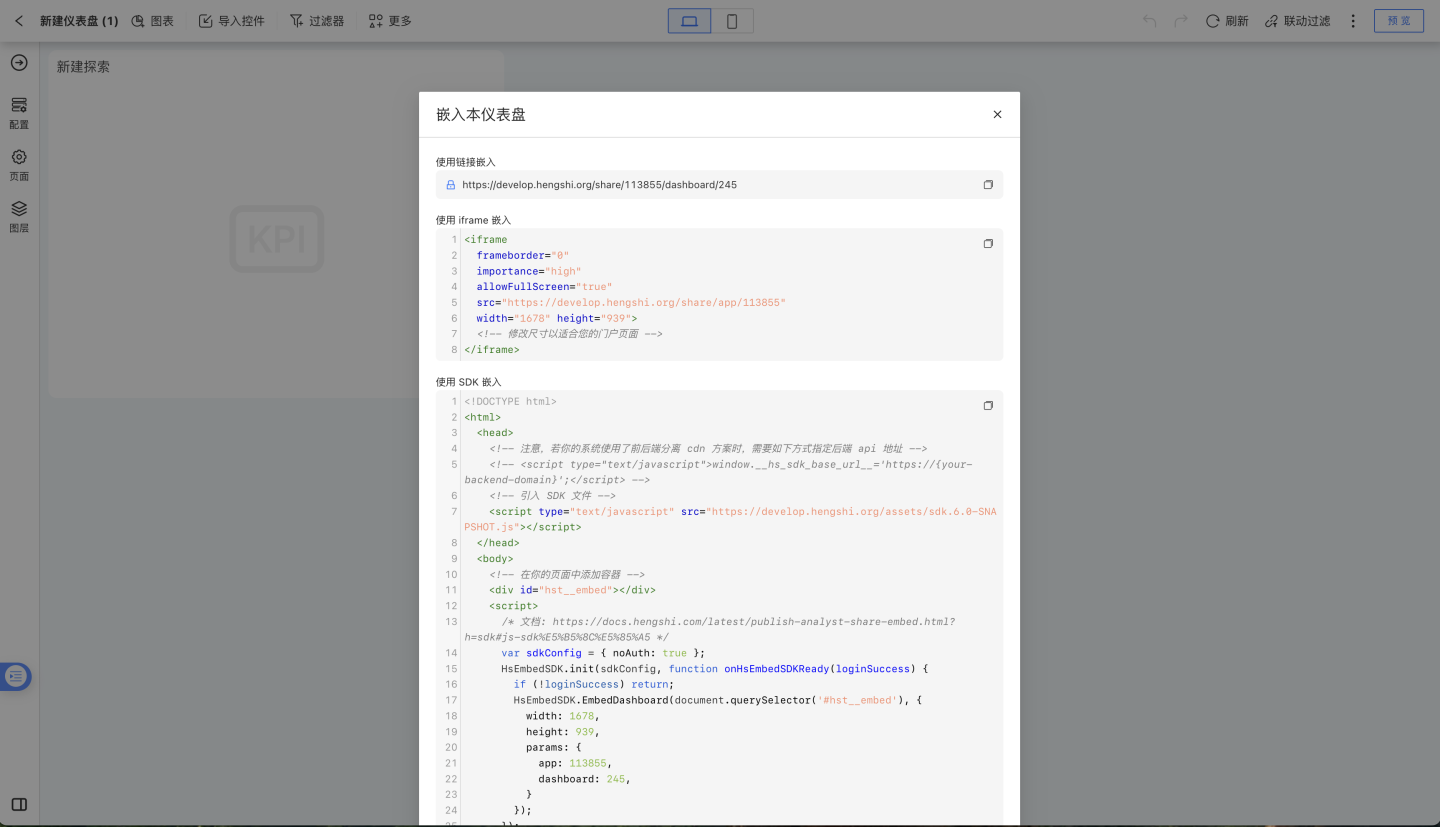
Dashboard Data
Click Dashboard Data to export the data of all charts in the current dashboard as an Excel file.
Play Slideshow
Click the Play Slideshow button to enter the chart slideshow interface. 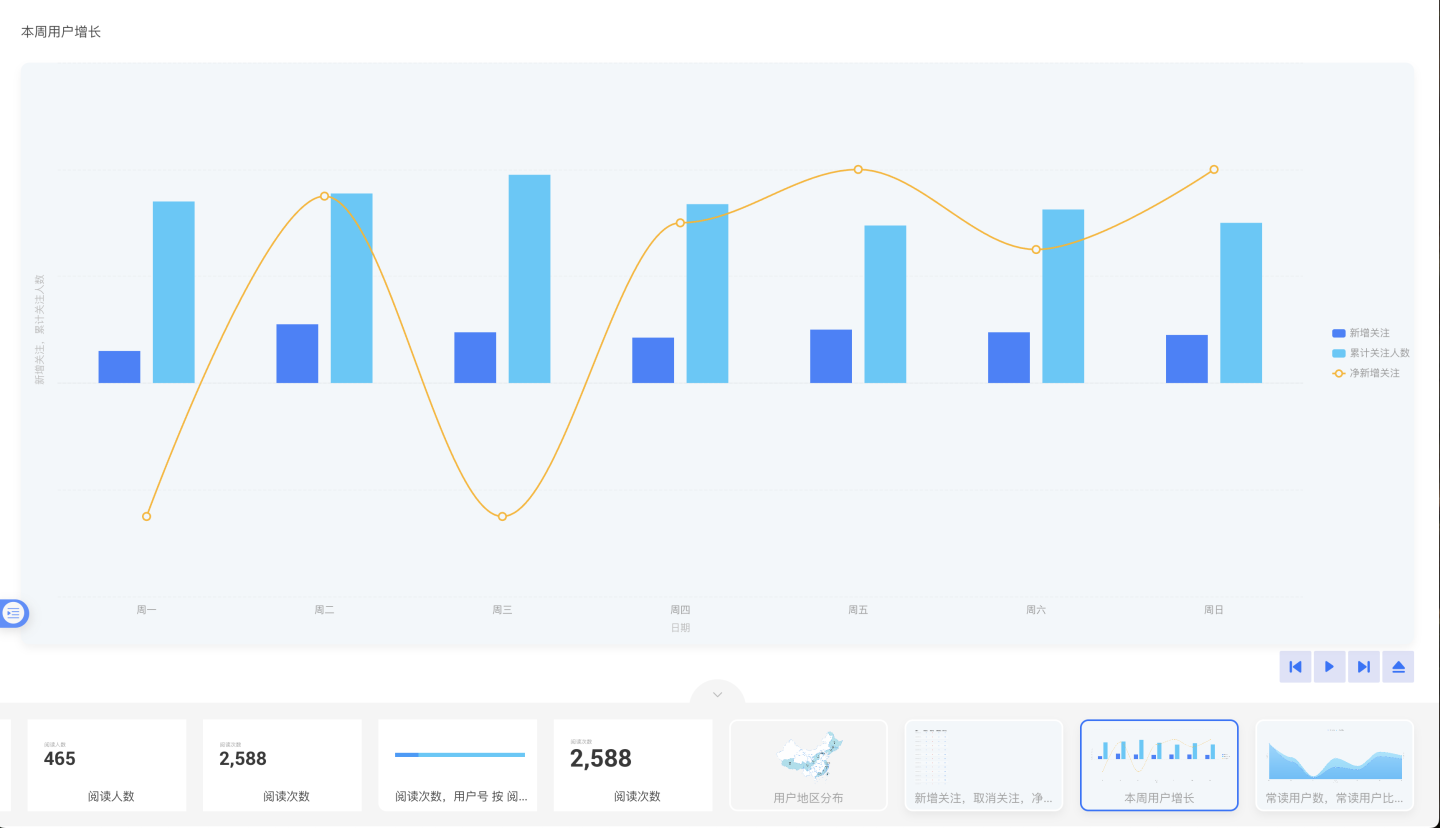
The menu in the lower right corner during slideshow playback includes:
In order:
- Previous Slide
- Play/Pause
- Next Slide
- Close Slideshow
Tip
Table data after rolling up/drilling down will be used during slideshow playback. The table data in the slideshow reflects the rolled-up/drilled-down state, and changes to the roll-up/drill-down status in the dashboard are not allowed during slideshow playback.
Full Screen
![]()
Display the entire dashboard in full screen to achieve a preview effect.
Preview
Click the Preview button to preview the current dashboard in the published state.
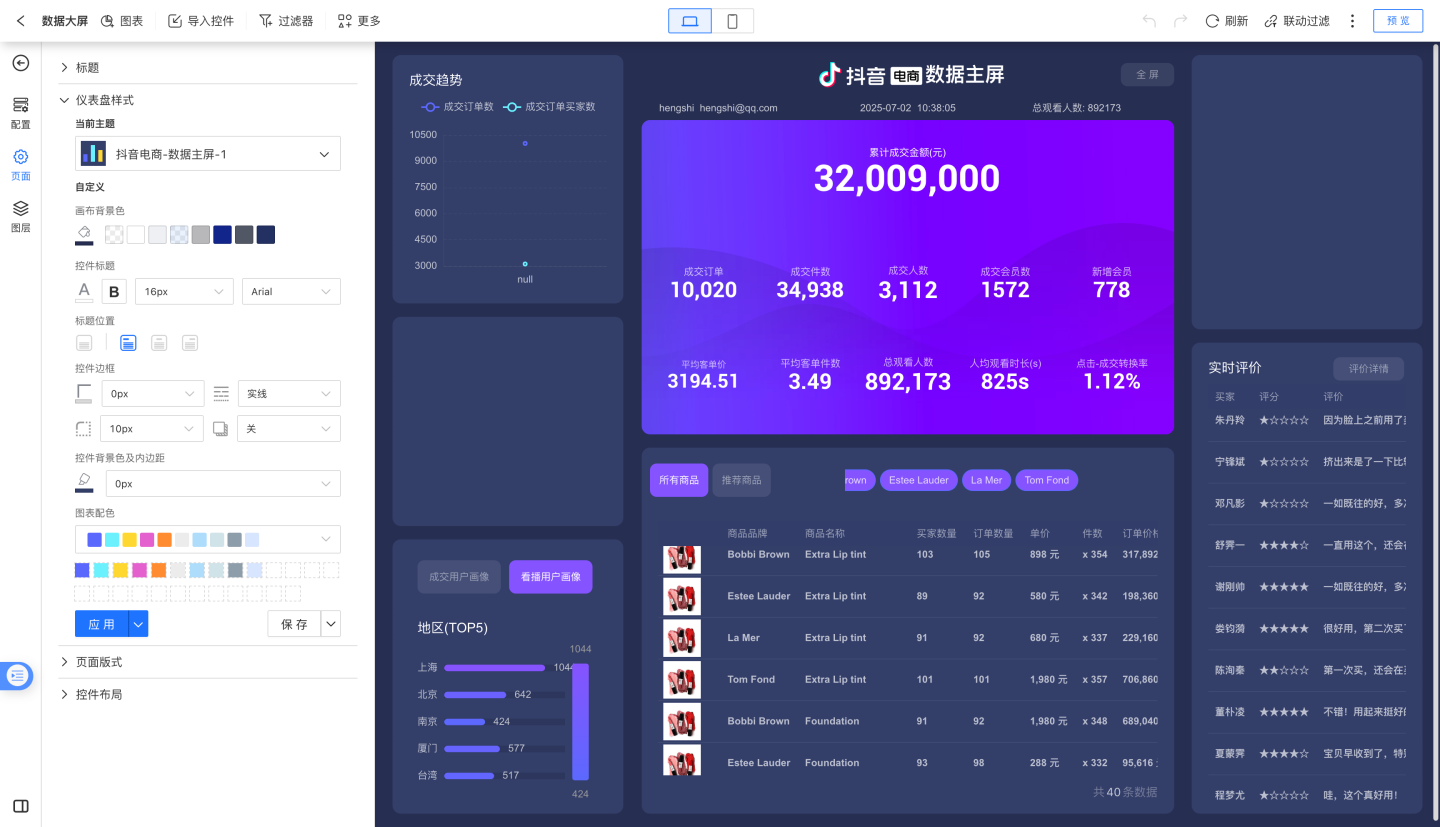
Page Settings
Dashboard page settings can be accessed by clicking on a blank area within the dashboard canvas to bring up the page settings panel on the left. You can configure some basic information for the dashboard, such as the title, theme, layout style, etc. 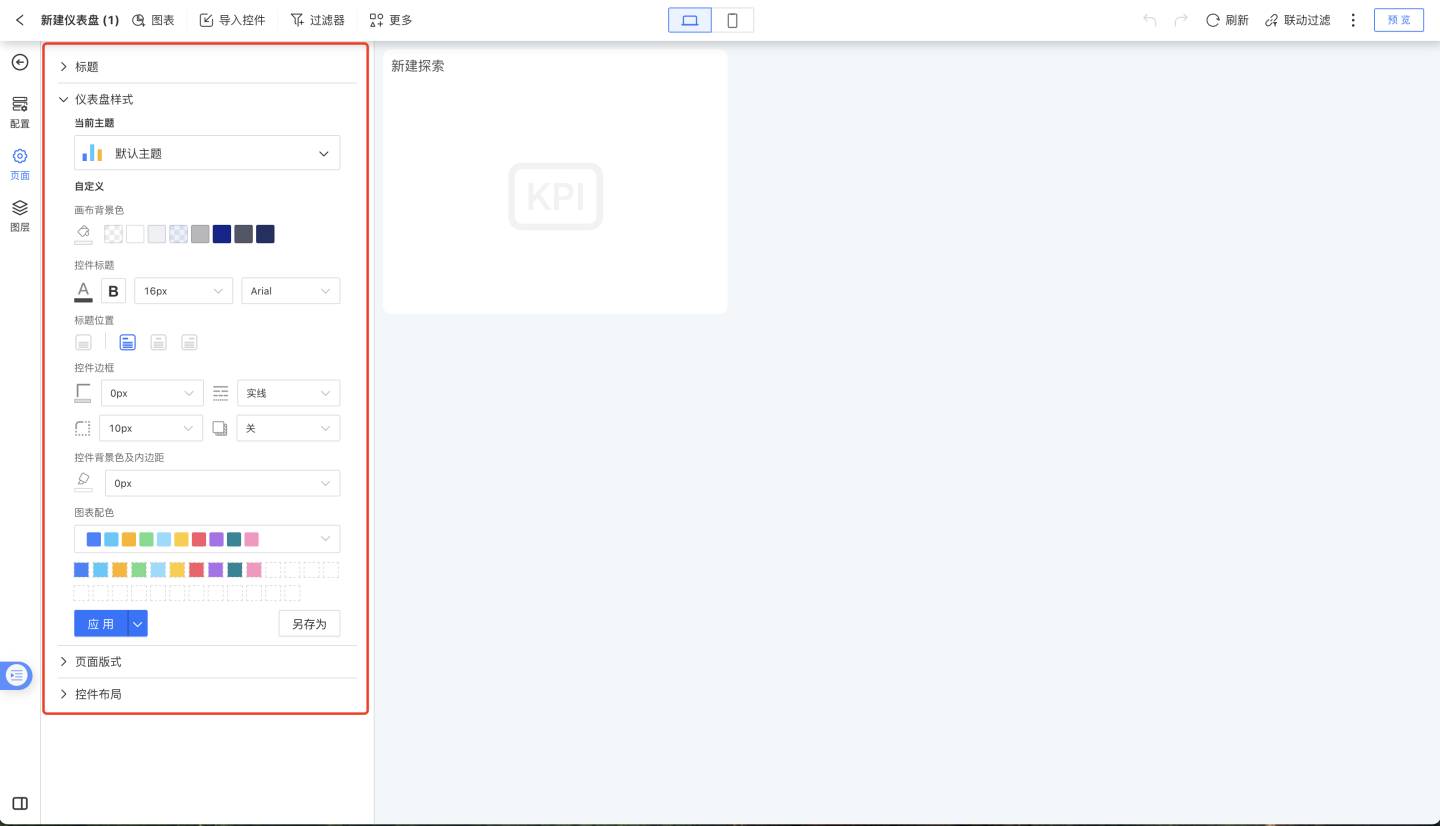
Chart Operations
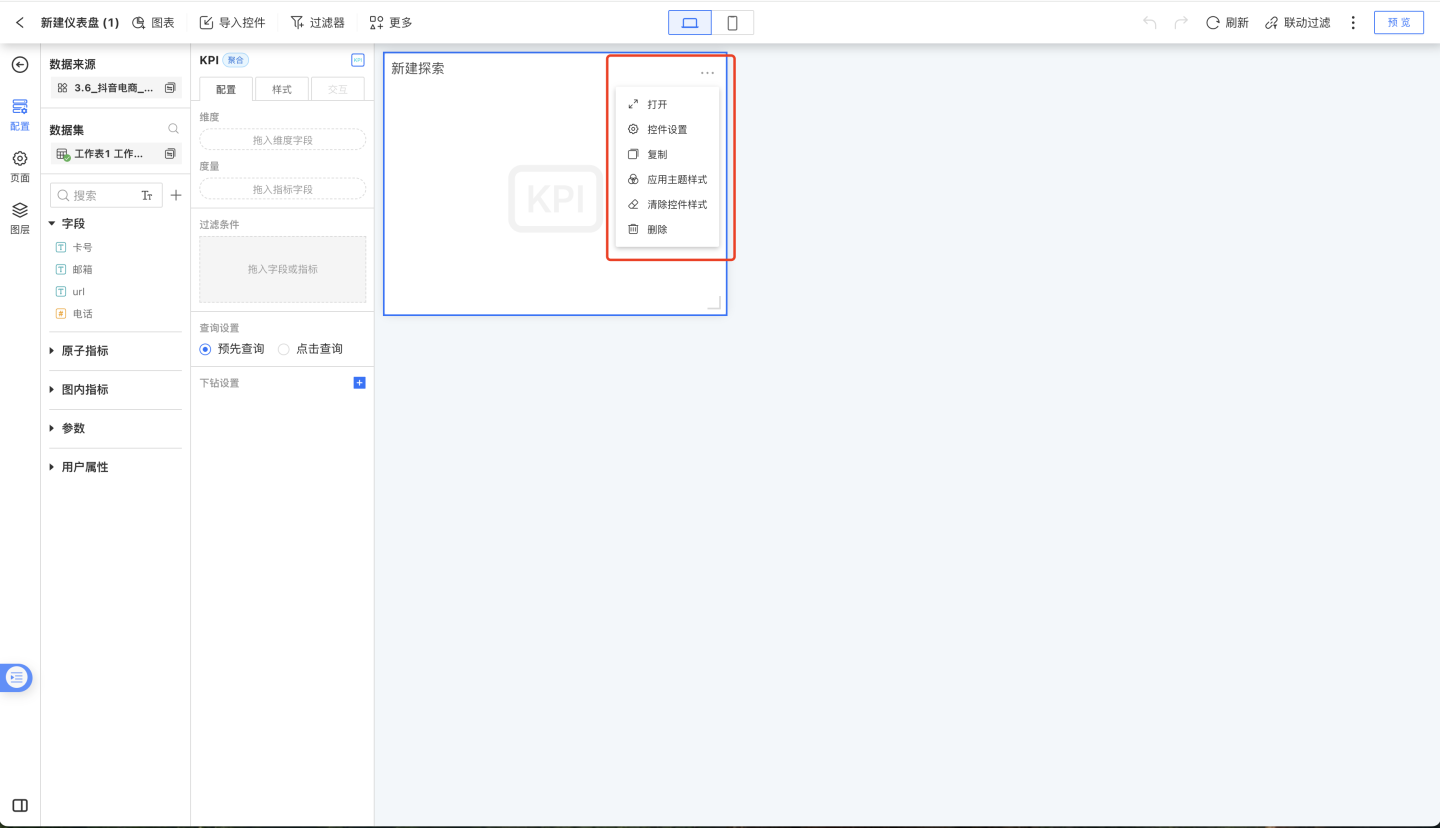
In the dashboard, when the mouse hovers over the chart thumbnail, you can view the menu on the chart, which includes:
- Open
- Control Settings
- Copy
- Apply Theme Style
- Clear Control Style
- Delete
Open
Enter the chart editing page.
Apply Theme Style
If the chart colors have been reset within the chart, the charts in the dashboard must click Apply Theme Style to display according to the set theme.
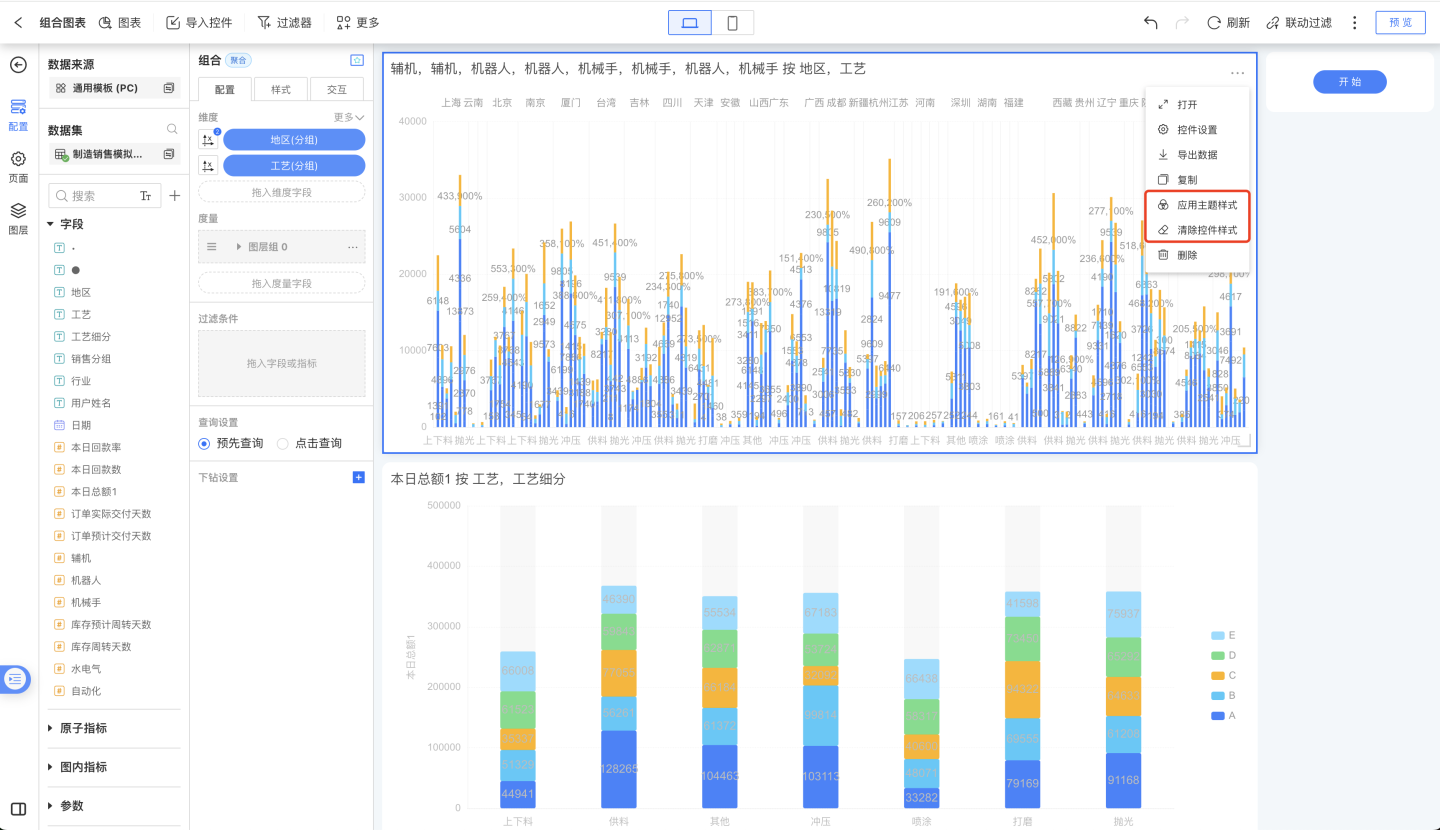
Clear Control Style
Click Clear Control Style to remove the custom style settings of the current chart and restore it to the default theme style.
Control Settings
Clicking on Control Settings in the chart configuration on the left will navigate to the control settings panel, allowing you to configure style interactions and other settings for the dashboard control container.
Click Interaction Response
This option defaults to Linked Filter and can be modified to Drill Down, Linked Filter + Drill Down, No Response, and Redirect.
Linked Filtering
When Linked Filtering is checked, clicking on a data item in the chart enables linked filtering for that chart. For more details, see Chart Linking.
Drill Down
When the chart's click interaction response is set to Drill Down, clicking on a data item in the chart will display the chart according to the configured drill-down path. Charts without a configured drill-down path will not respond.
Linked Filtering + Drill Down
When the chart's click interaction response is set to Linked Filtering + Drill Down, clicking on a data item in the chart will cause the chart with a configured drill-down path to drill down according to the set path while simultaneously performing linked filtering with other charts. Charts without a configured drill-down path will only perform linked filtering.
No Response
When the click interaction response of the chart is set to No Response, clicking on the data items in the chart will result in no reaction.
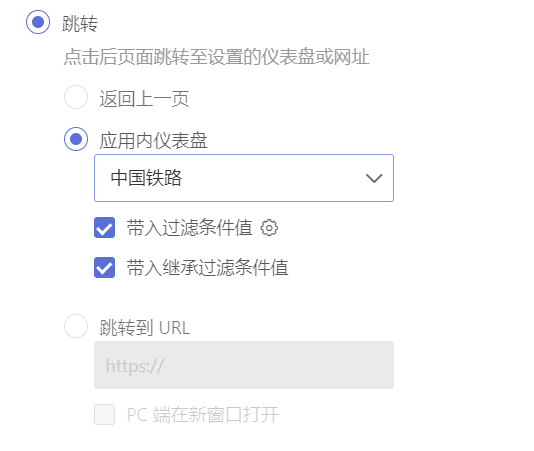
Navigation
Supports three types of navigation:
- Return to the previous page.
- Navigate within the app to a dashboard. If the target dashboard is hidden or deleted, the navigation operation will not be executed.
- Pass filter condition values.
- Chart-type components support passing their own dimension values and related filter condition values.
- Components such as graphics, shapes, buttons, and rich text support passing page filter condition values.
- Custom filter condition values can be set.
- Chart-type components support passing their own dimension values and related filter condition values.
- Pass inherited filter condition values.
- Pass filter condition values.
- Navigate to a specified URL. On the PC side, navigation supports opening a new window.
After setting, clicking on the chart will navigate according to the specified settings.
Linked Filtering Related Charts/Linked Filtering Specified Charts
In the chart's control settings, you can set the linked filtering related charts and linked filtering specified charts. By default, the chart's linked filtering will automatically connect to other charts.
- Linked Filtering Related Charts: Select the linked filtering related charts for the current chart. When clicking on a data item in the chart, other charts with data relationships will update accordingly.
- Linked Filtering Specified Charts: Select the linked filtering specified charts for the current chart. When clicking on a data item in the chart, the specified charts will update accordingly.
Delete
Click the Delete button on the chart to remove the chart.
Dashboard Display Terminals
Dashboards support multi-terminal displays, including PC, mobile, and large screens, as well as embedded scenarios. Individual charts within dashboards can also be displayed in embedded scenarios.