Chart
SENSE charts bring together a variety of visualization methods and provide a rich set of tools and convenient interactions, helping data professionals to instantly explore, analyze, and process data, and to more efficiently discover hidden information within the data.
This section will introduce the interactions and tools of the SENSE chart interface: 
Creating Charts
Within a created dataset, you can select the type of chart you need based on your requirements. According to the requirements of different chart categories, select the dimension and measure fields, and the system will automatically generate the chart. HENGSHI SENSE supports sharing charts and collaborative applications among colleagues. For charts under a specific app, you can use them directly or modify them as needed.
Left Data Panel
Data
Select a created dataset to use its data for creating the required chart. Datasets with established relationships will be connected by lines. 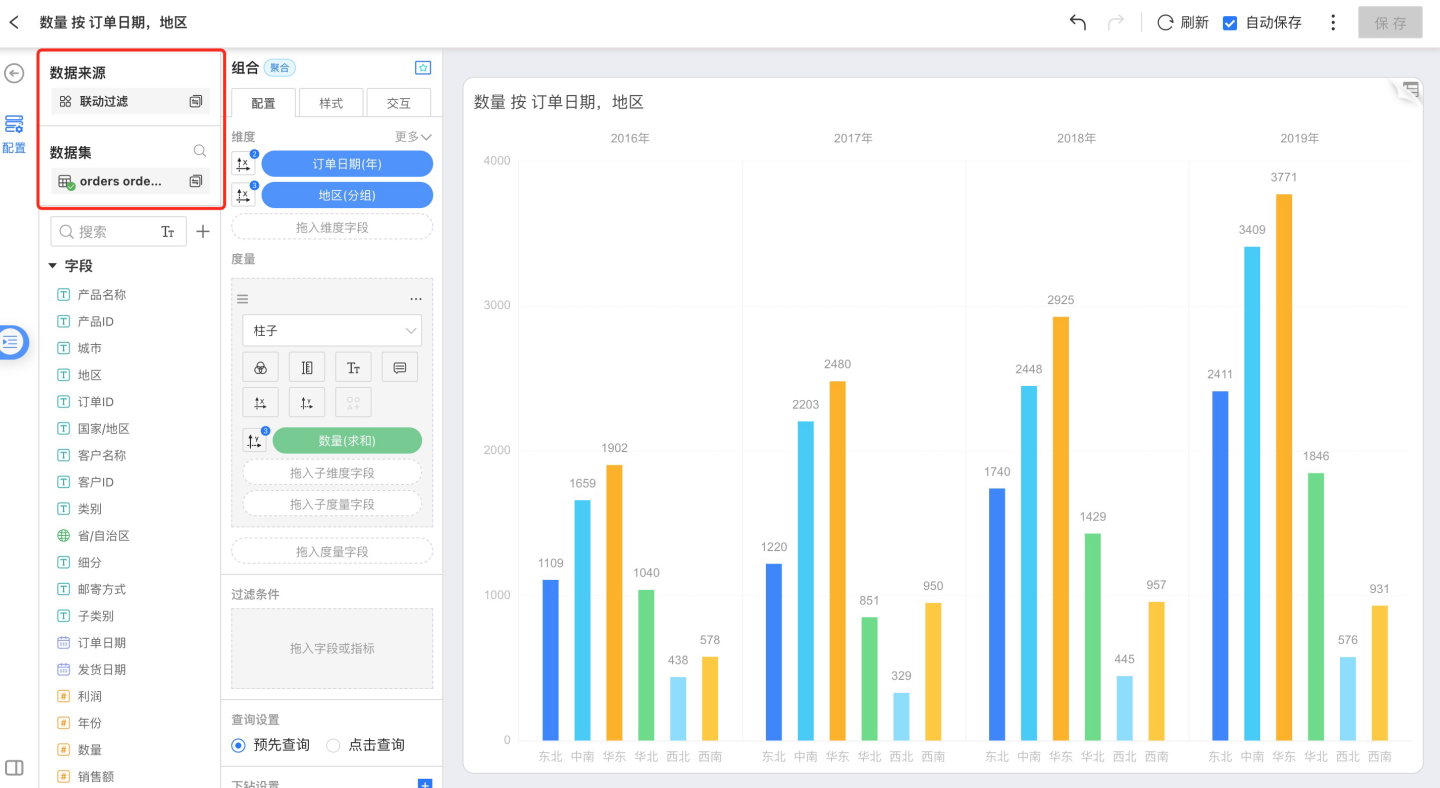
Click the Search icon on the right side of the dataset to go directly to the management page of that dataset. 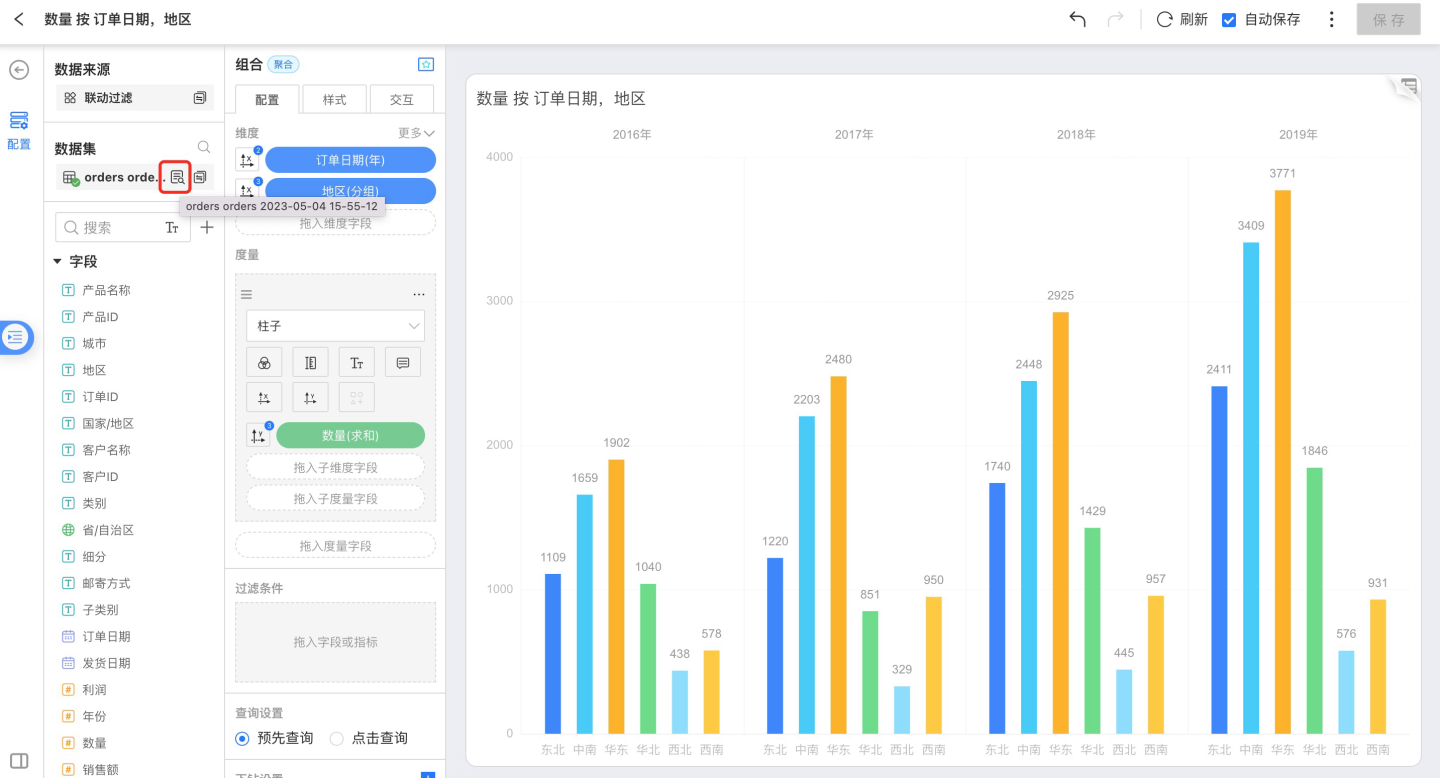
Fields and Metrics
Fields: All original and newly added fields in the current dataset. If a field has grouping information, the grouping will also be displayed in a tree structure in the field list, making it easier to quickly locate fields.
Calculated Metrics: All metrics newly added based on this dataset. The grouping information for metrics will also be displayed in the metrics list.
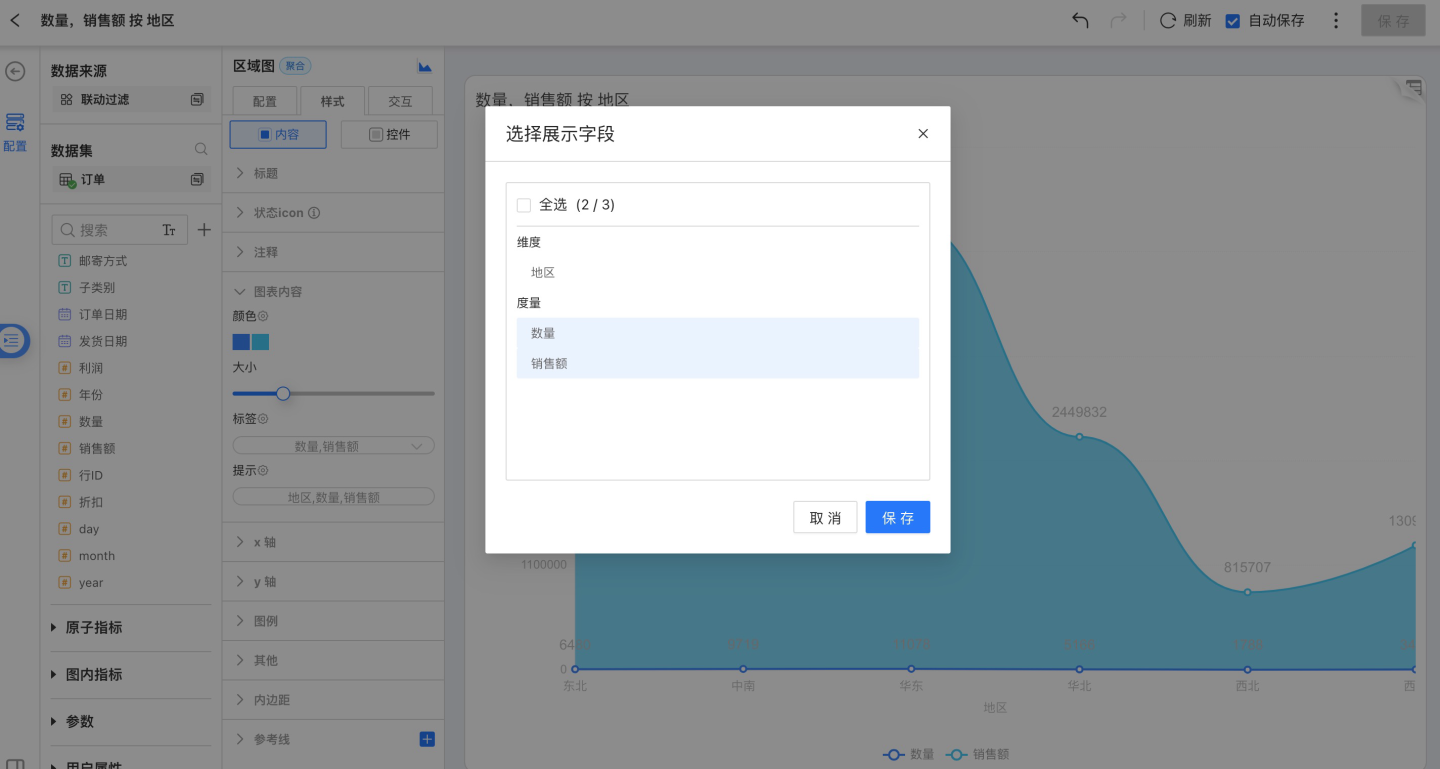
In-Chart Metrics: Dimensions and measure fields within the chart.
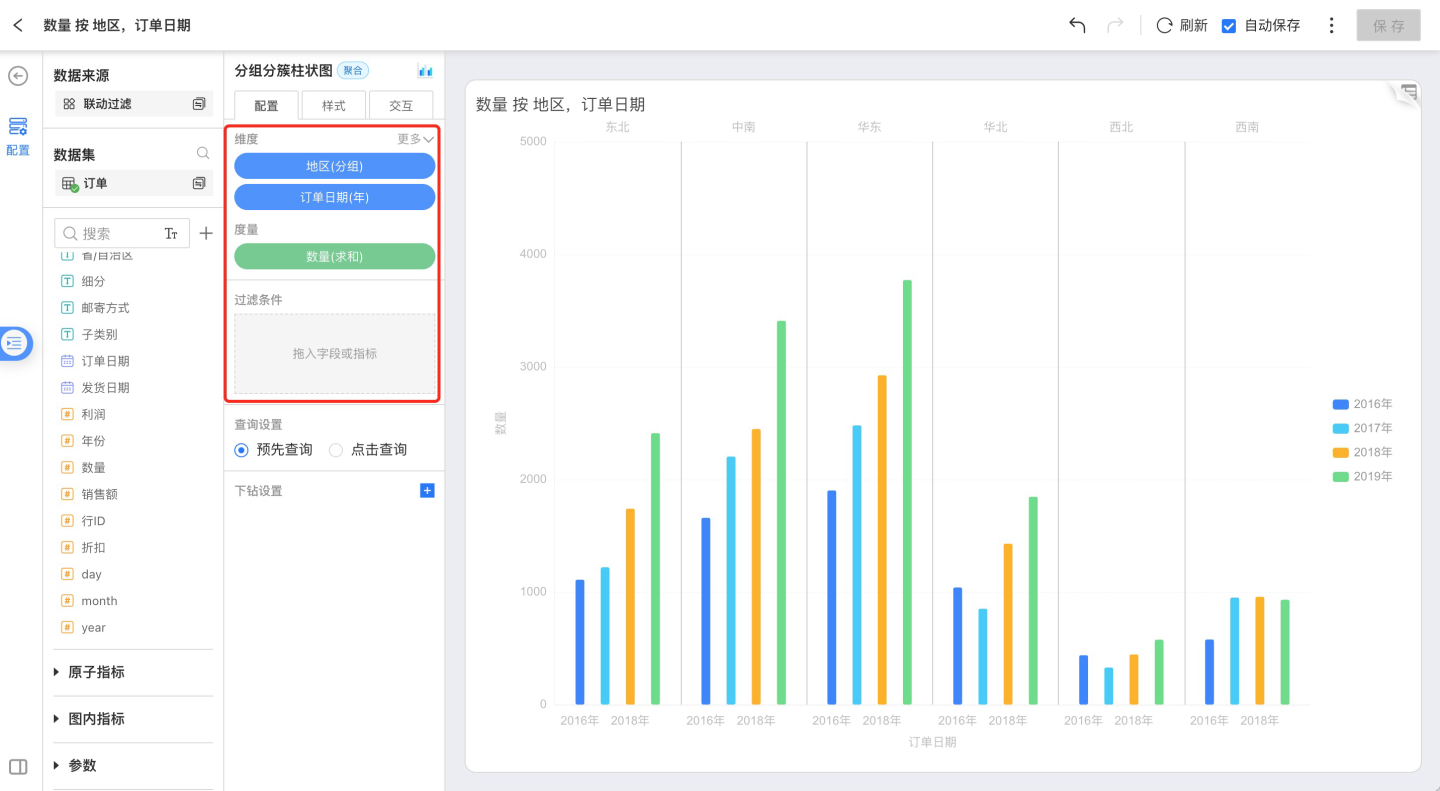
Drag fields into the Dimensions and Measures sections in the configuration. 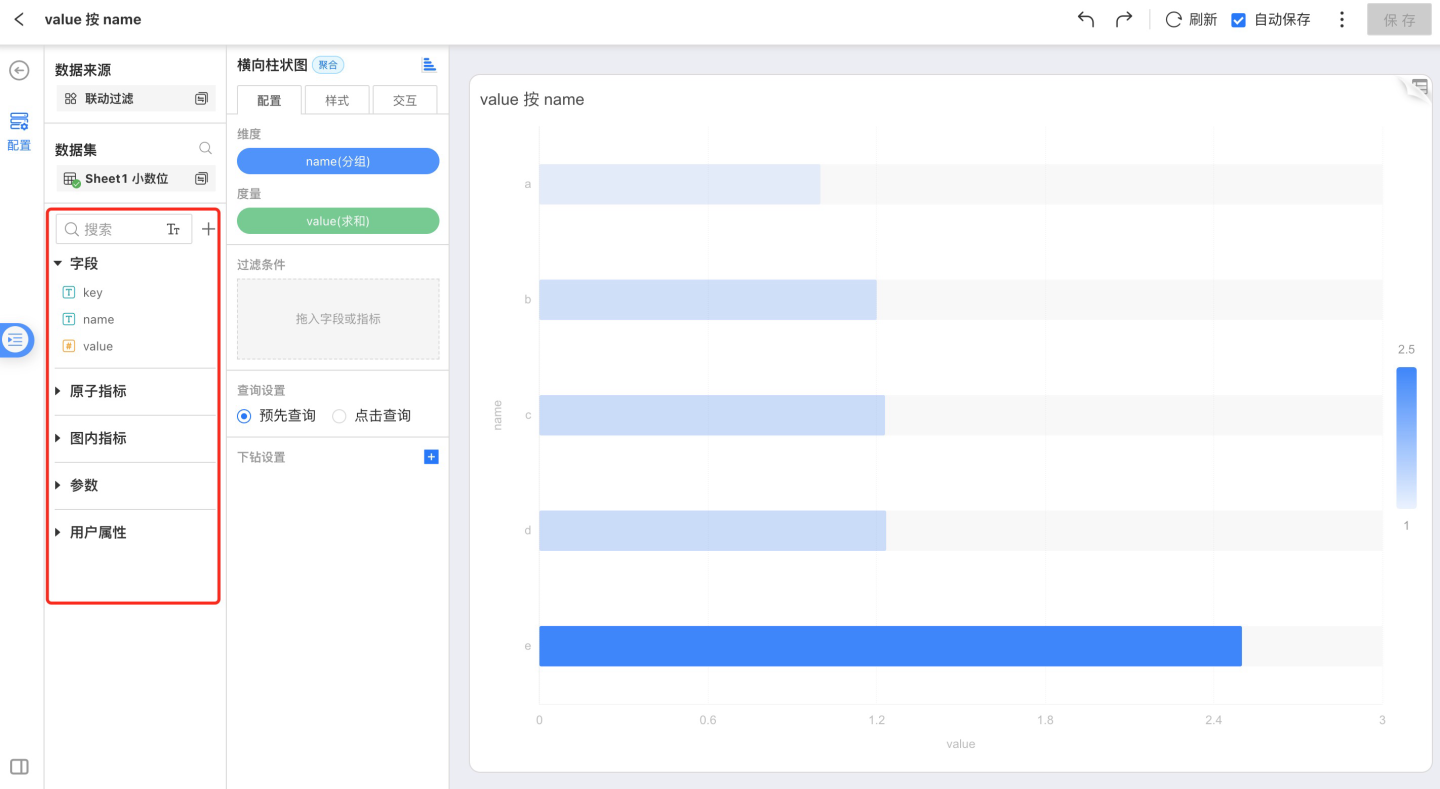
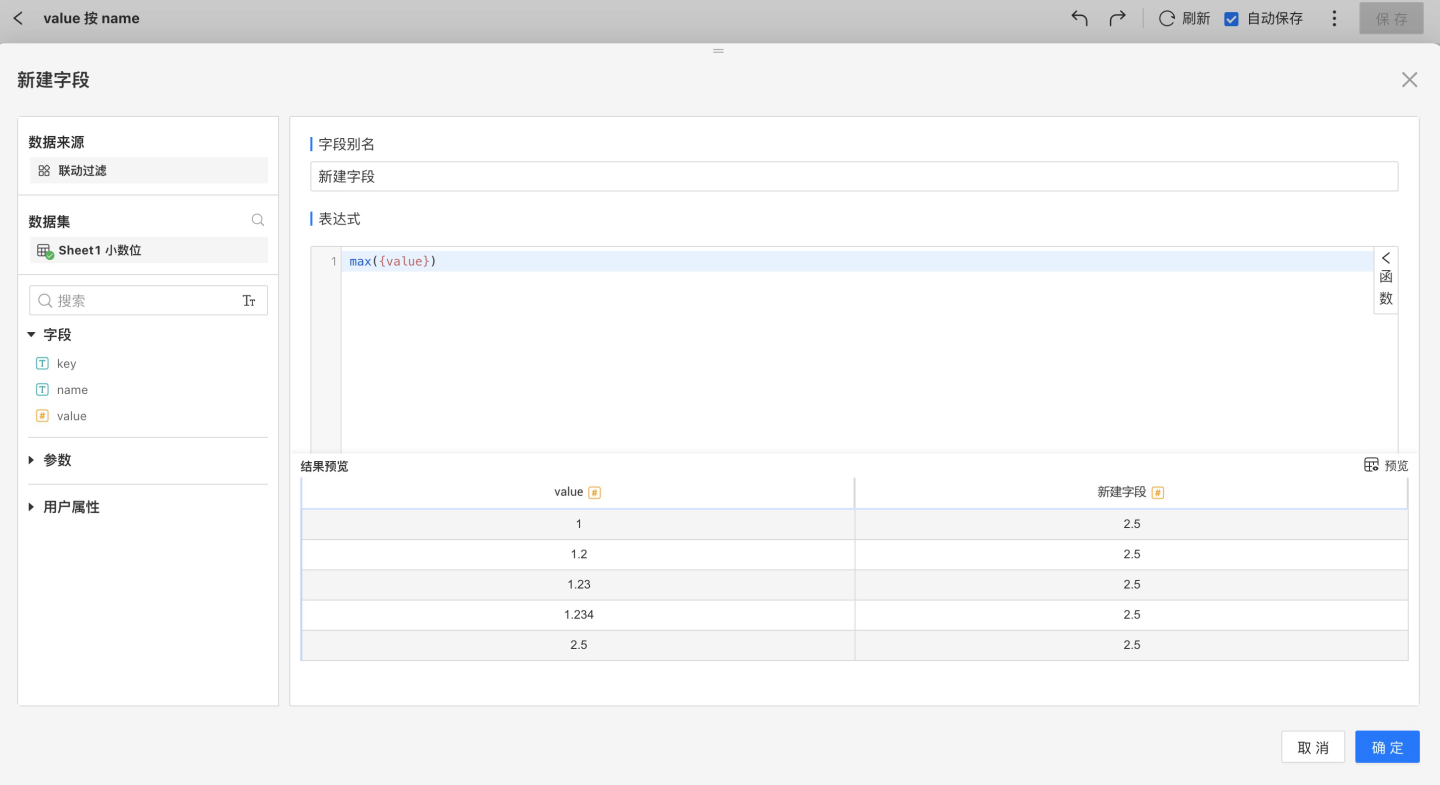
Create New Field
You can add text, date, or numeric fields through column value calculation, advanced expressions, or column value grouping. 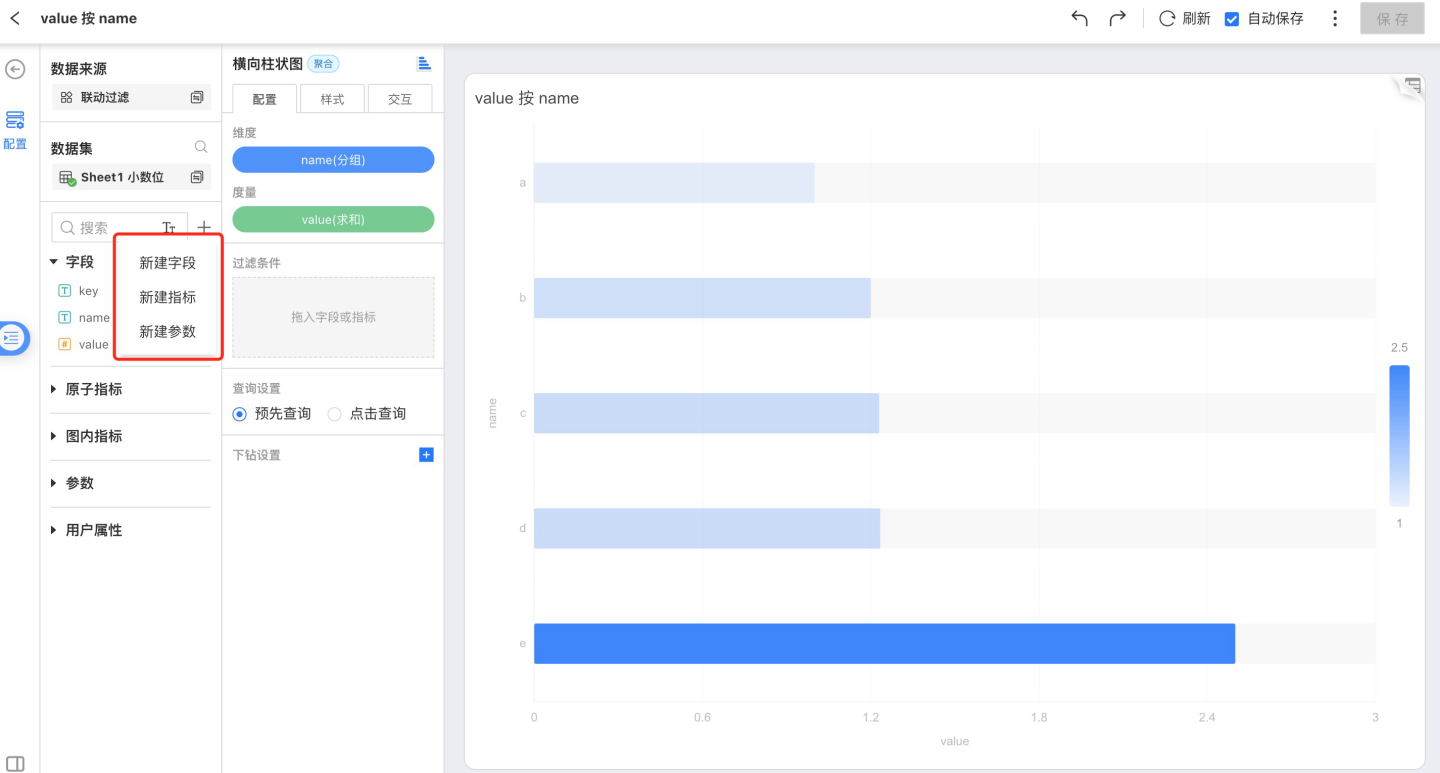
Create a New Calculated Metric
You can add text, date, or numeric fields through column value calculation, advanced expressions, or column value grouping. Adding non-aggregated metrics is not allowed. 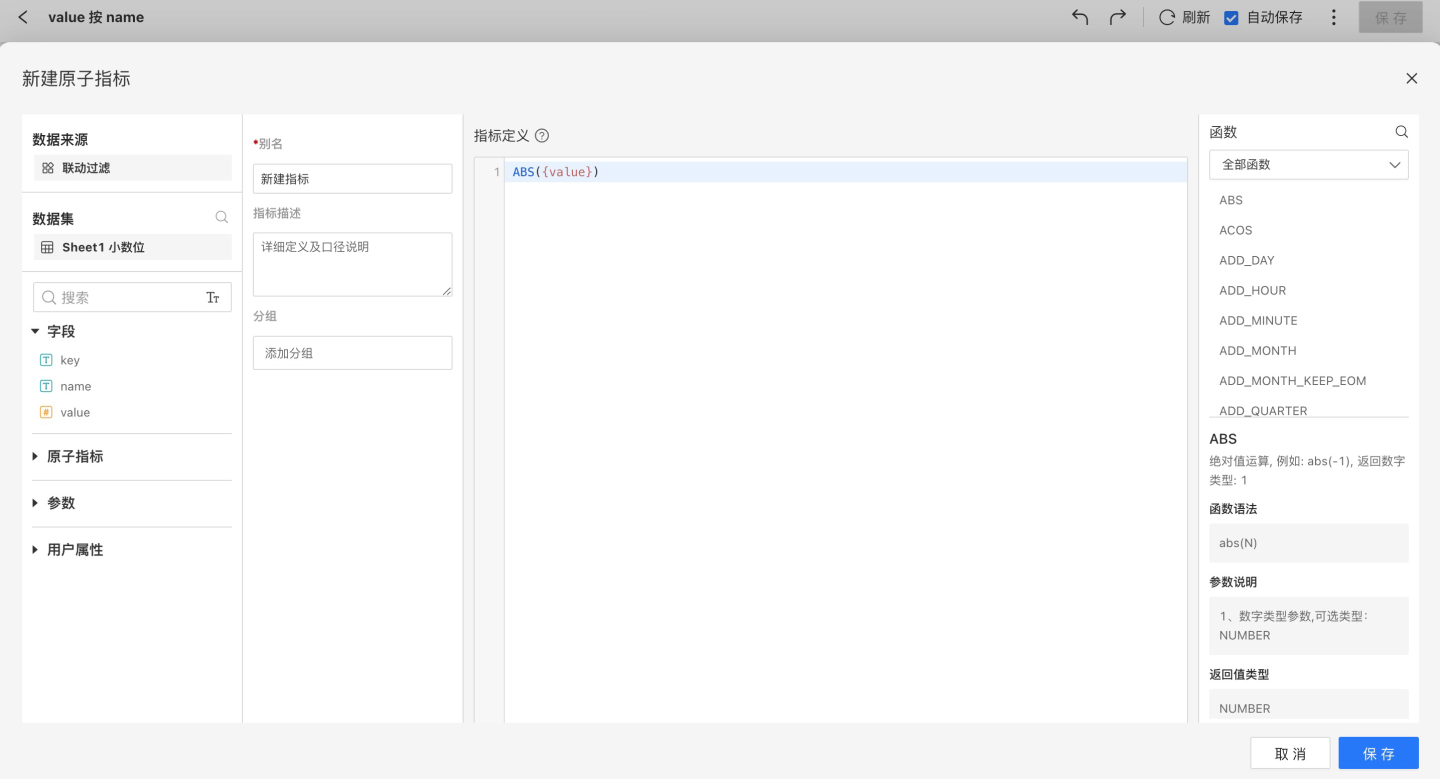
Create Parameter
You can add parameters of text, number, date, or time types to enable parameterized control of the app. 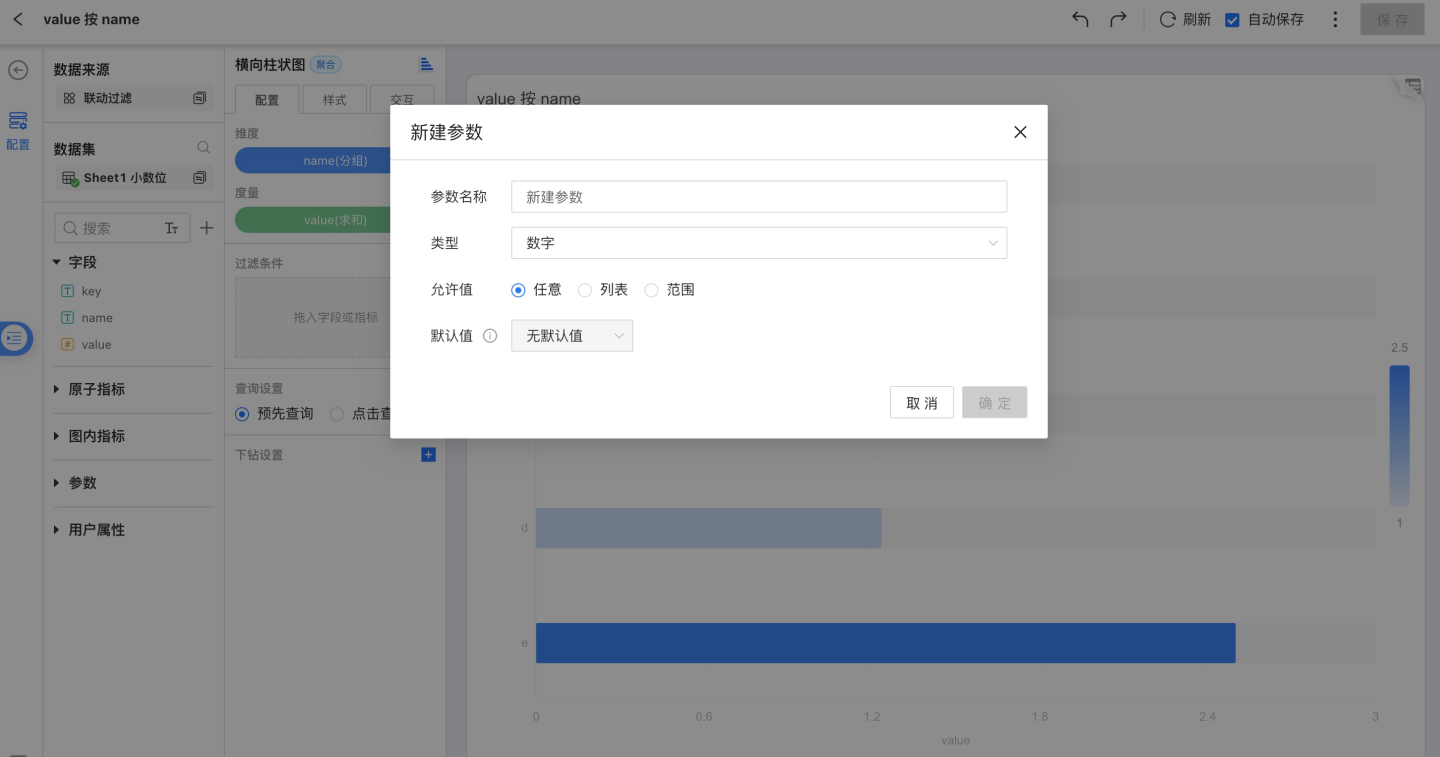
Top Right Toolbar
For details, see Common Chart Operations
Middle Toolbar
Switch Chart
Users can switch between different chart types as needed. Colored icons allow direct switching without the need for reconfiguration. When switching to a gray icon, the chart's dimensions and measures will not be retained, and users will need to reconfigure the measures and dimensions themselves. 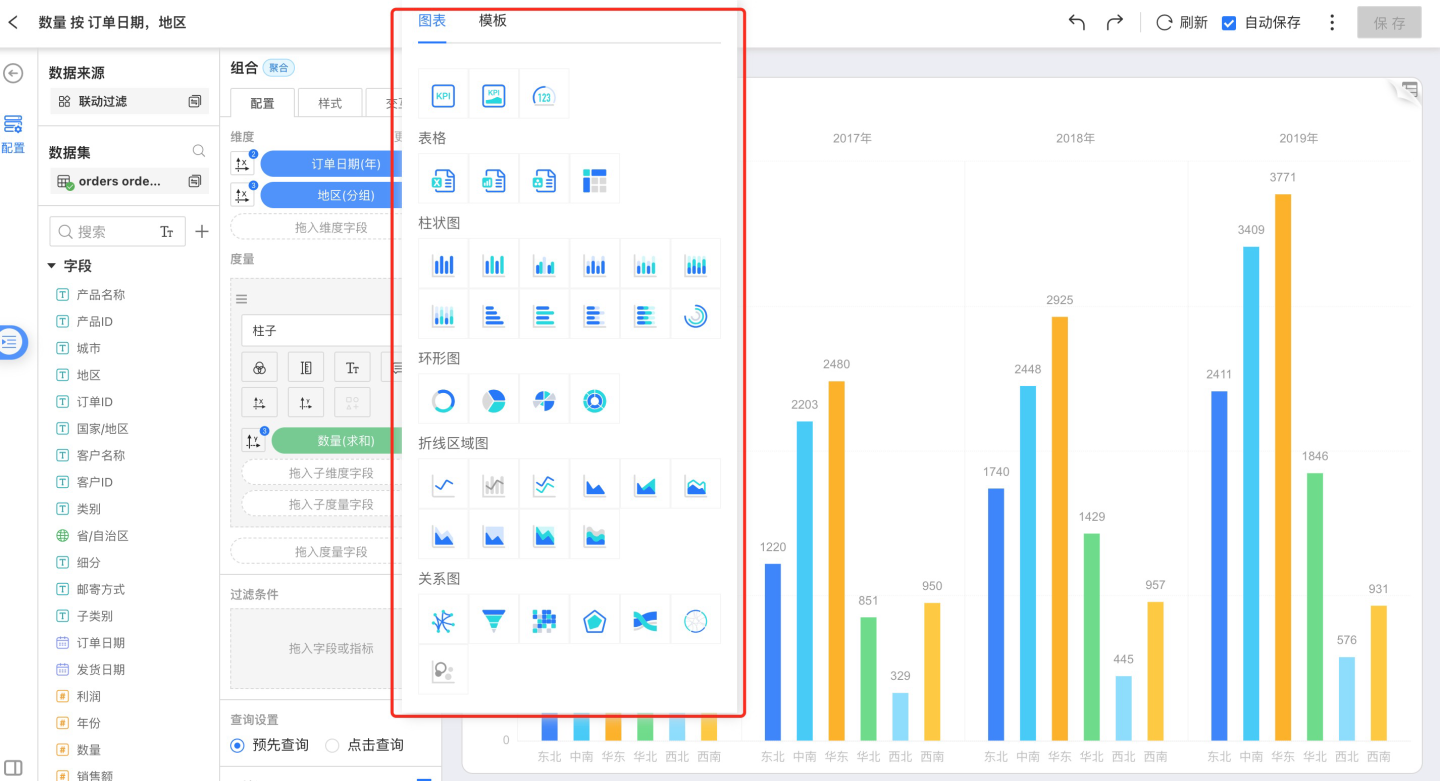
Configuration
Select Configuration from the middle navigation bar to make the following configurations as needed to optimize the complete chart.
- Dimension
- Measure
- Filter
Dimension Tools
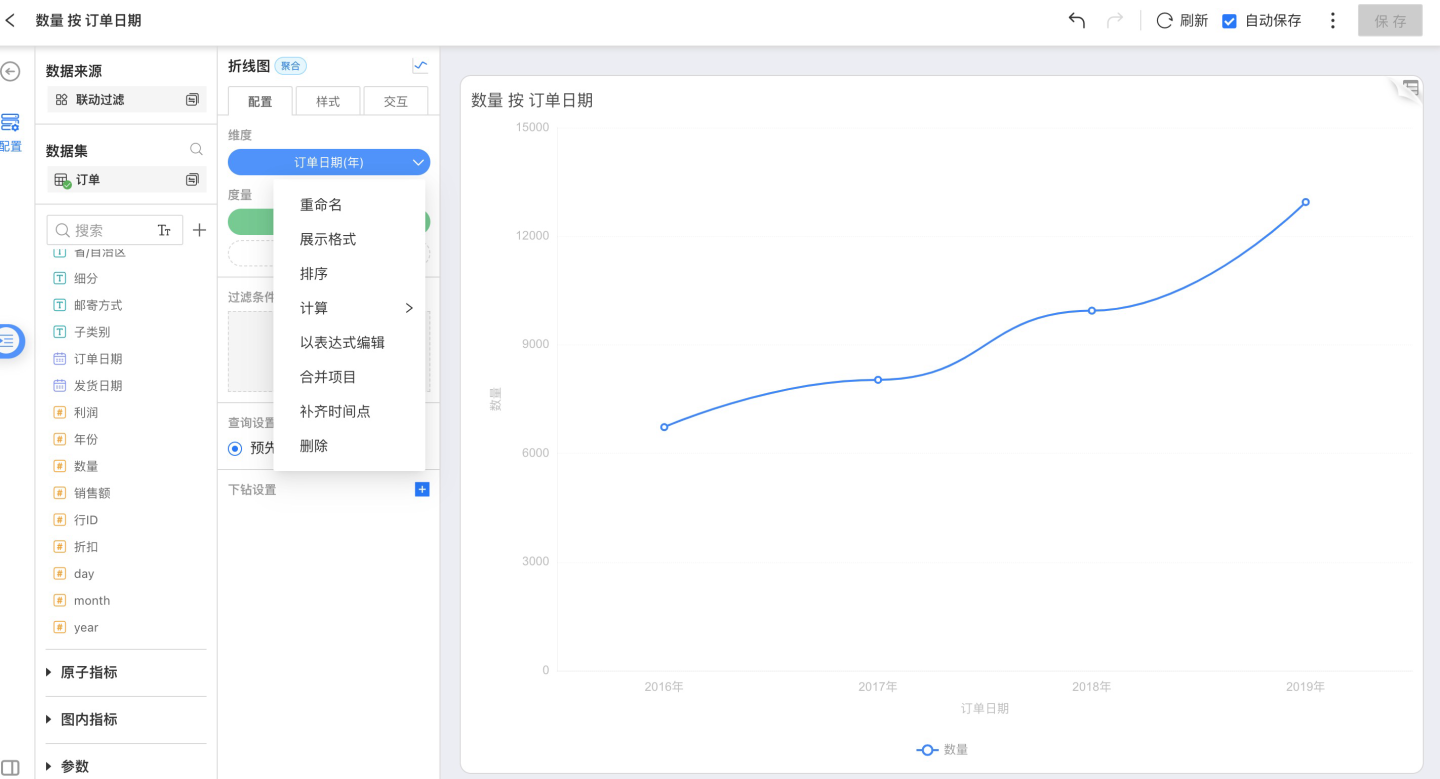
Dimension tools include:
- Rename: Modify the dimension name to make the chart content more relevant to the business scenario.
- Display Format
- Sorting
- Calculation: Dimension aggregation method.
- Edit as Expression
- Merge Items: Merge items with a very small proportion.
- Fill Time Points: When selecting a time dimension, the option to fill time points will appear.
- Delete: Remove the current dimension.
Display Format
The display format for numeric types is as follows. You can customize the number display format: 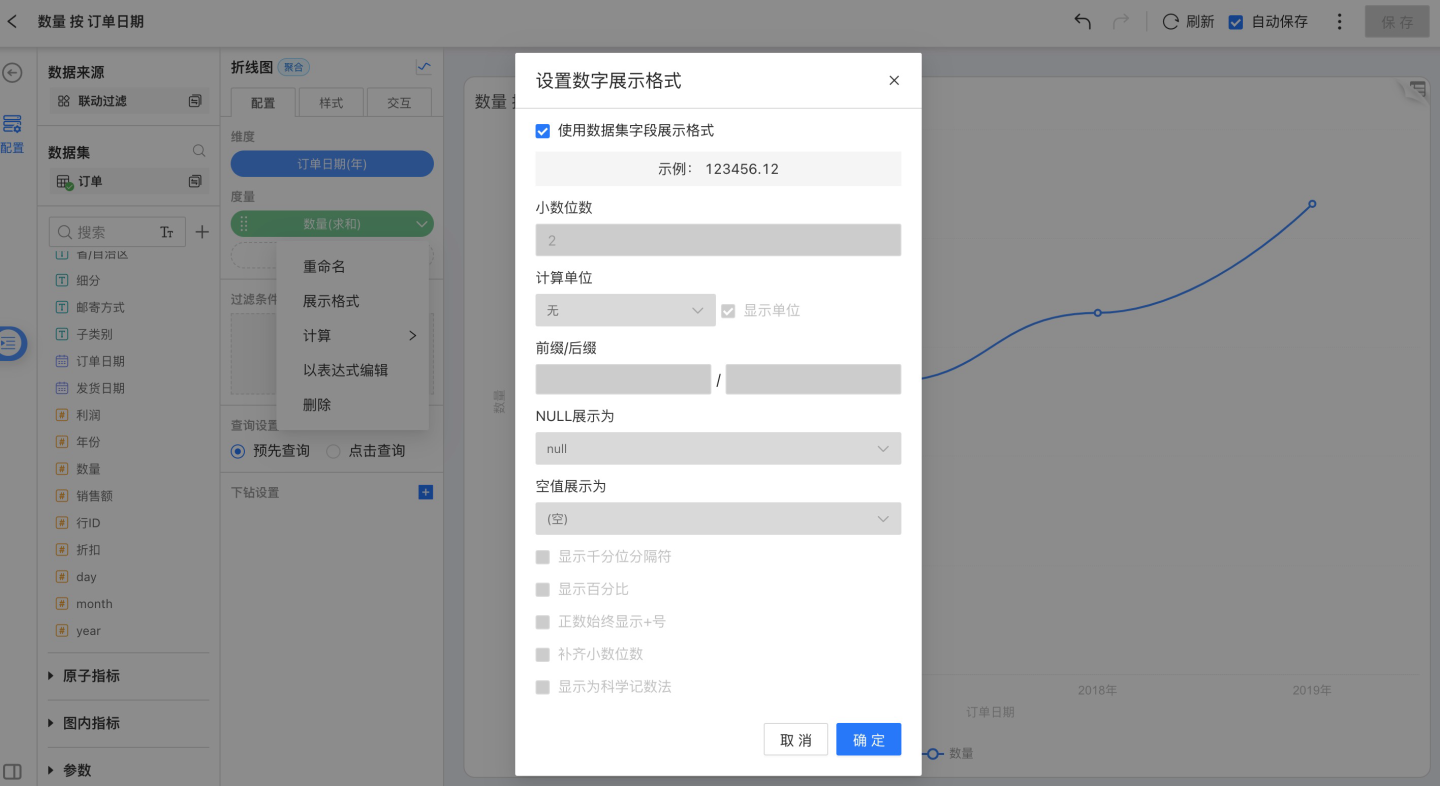
- Use dataset field display format: Displays according to the field display format set in the dataset.
- Decimal places: By default, 2 decimal places are shown. You can customize the number of decimal places.
- Number unit: By default, no unit is displayed. You can customize the number unit: Auto, Hundred Million, Ten Million, Million, Ten Thousand, Thousand, Hundred, M, K.
- Prefix/Suffix: By default, none is displayed. You can customize the prefix/suffix.
- NULL value display: Replace NULL values with specified content for display.
- Empty value display: Replace empty values with specified content for display.
- Show thousands separator: Not selected by default. Users can customize according to their needs.
- Show percentage: Not selected by default. Users can customize according to their needs.
- Always show "+" for positive numbers
- Pad decimal places
- Show scientific notation: Not selected by default. Users can customize according to their needs.
The display format for date types is as follows. You can customize the date display format: 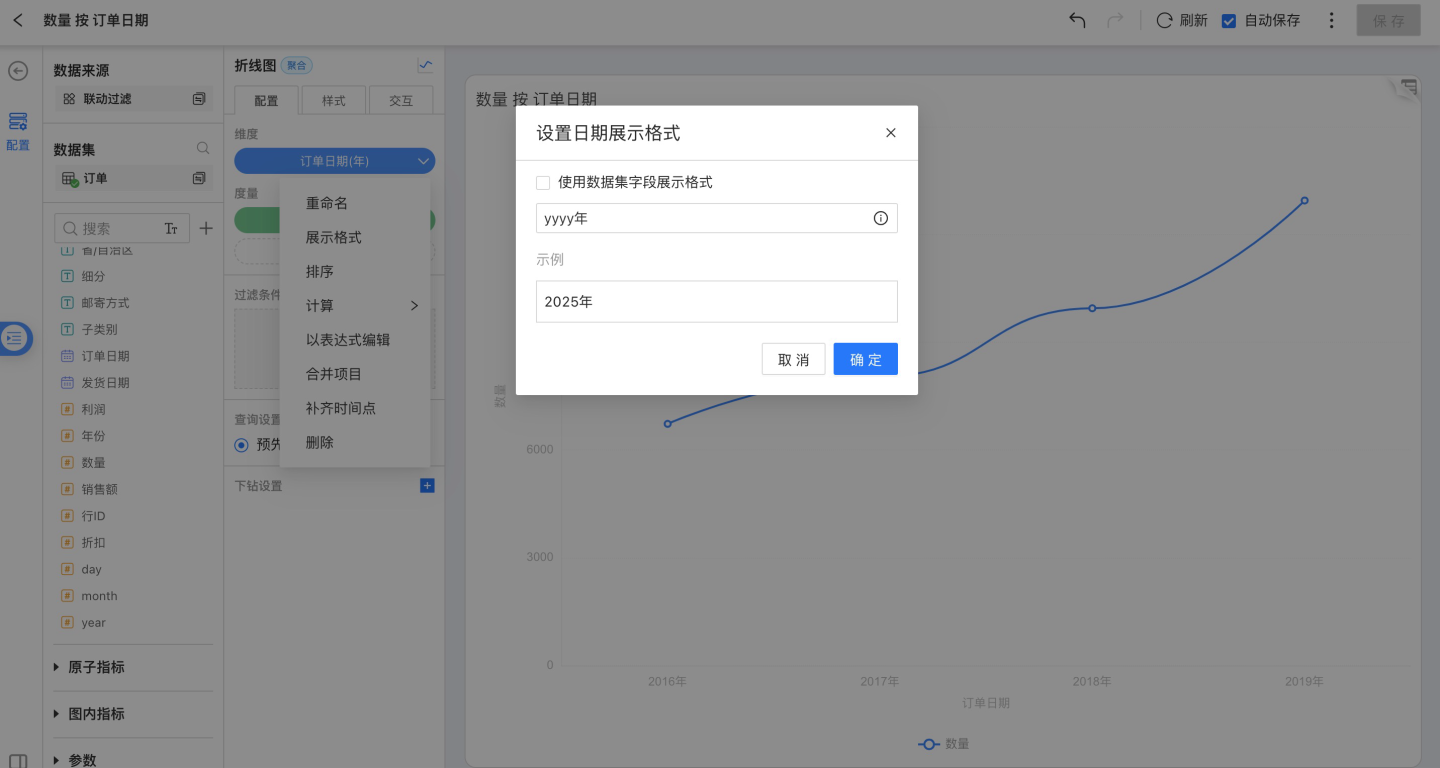
Sorting
Dimension sorting options include: data source sorting, alphabetical, by field, and manual sorting.
Click the dropdown menu on the right side of the dimension field, and select "Sort" from the pop-up menu. 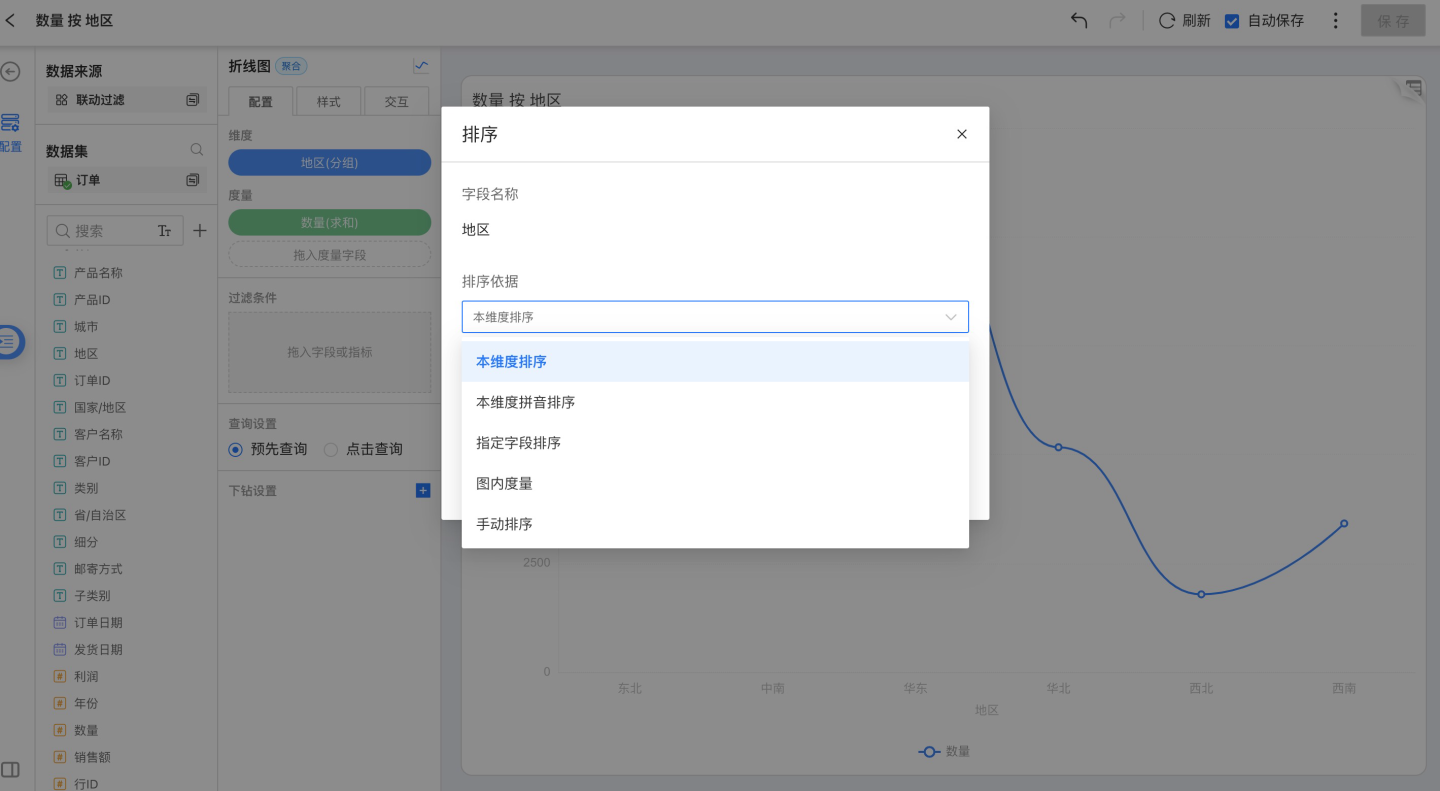
Sort by This Dimension: Sorts based on the Unicode values of this dimension.
Sort by Pinyin: Sorts the dimension in A-Z order according to Pinyin; currently, alphabetical sorting is supported for the following six types: Oracle, MySQL, Sqlserver, PostgreSQL, GreenPlum, and Engine.
Date and numeric type dimension fields do not support alphabetical sorting.
Sort by Specified Field: You can select a field from the same dataset or a related dataset, specify an aggregation method, and sort the dimension based on the aggregated results.
Sort by Measure in Chart: You can select a measure field from the same chart and sort the dimension based on the aggregated results of the measure field.
Manual Sorting: You can manually adjust the order of dimension groups.
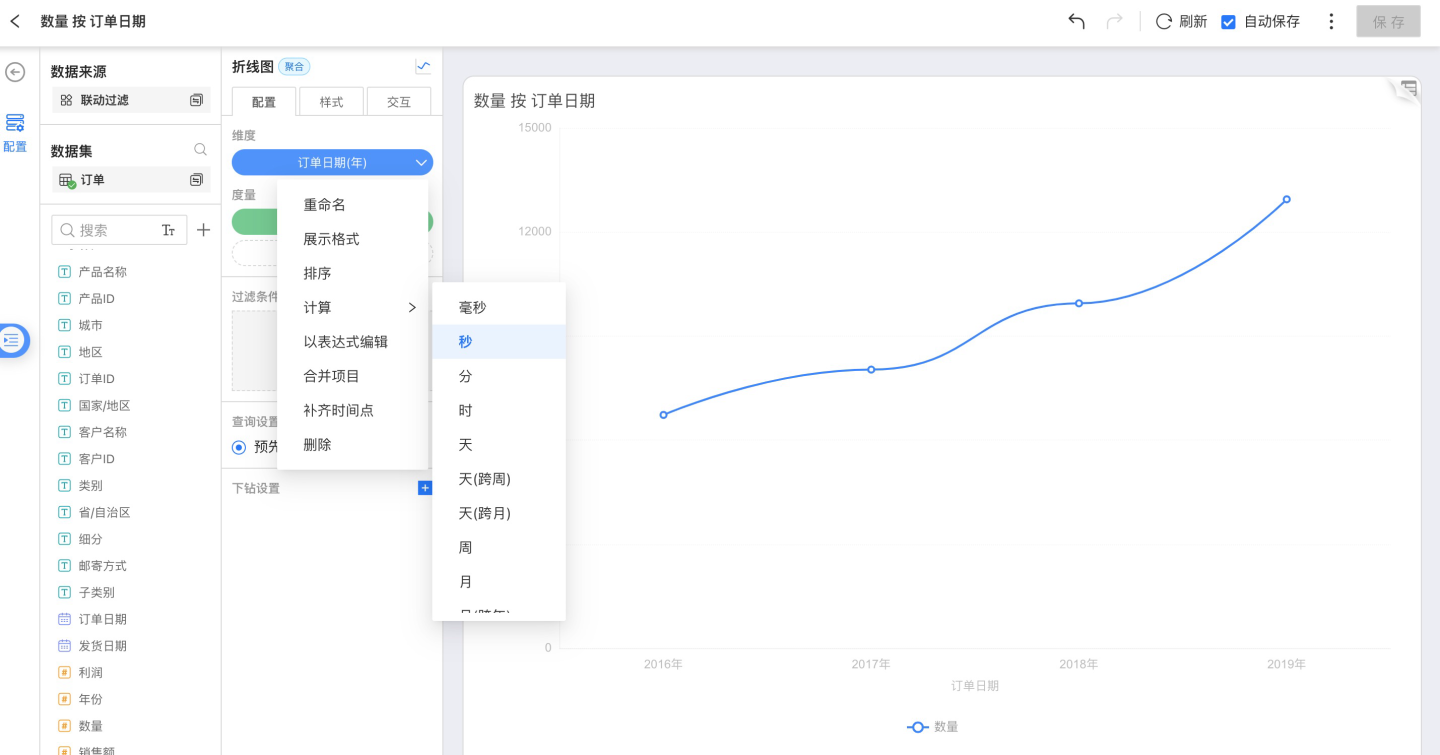
Calculation
The aggregation method for non-time dimensions is grouping, while the aggregation methods for time dimensions are:
- Millisecond
- Second
- Minute
- Hour
- Day
- Day (across weeks)
- Day (across months)
- Week
- Month
- Month (across years)
- Quarter
- Quarter (across years)
- Year
Merge Items
Charts with dimensions (except maps) support merging items into "Others". When focusing only on items with a higher proportion during grouped data display, items with a smaller proportion can be merged into "Others", making the displayed chart more concise and clear.
The merged group also supports operations such as drill-down, view details, and linked filtering. 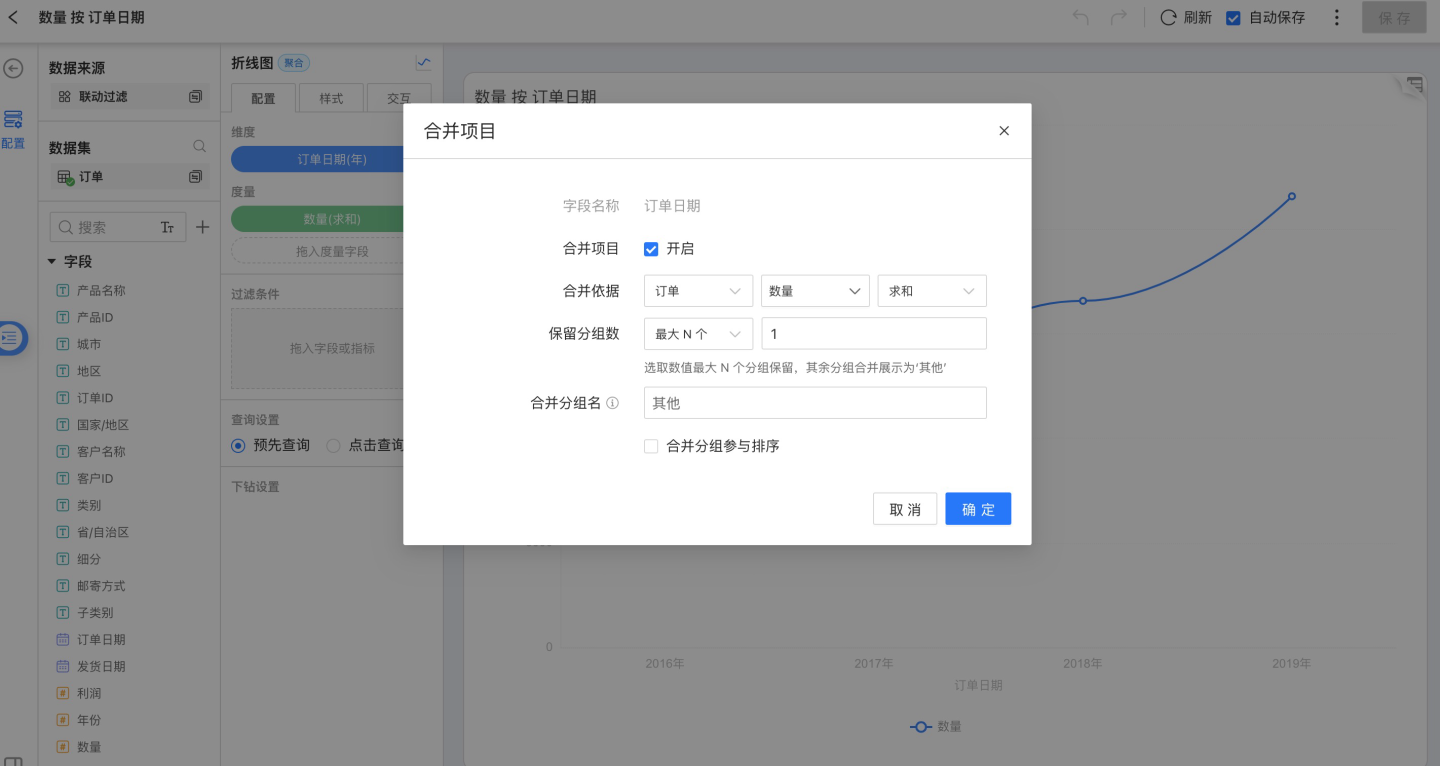
Time Point Completion
Currently, the following chart types support time point completion:
- Line Chart
- Grouped Line Chart
- Line and Bar Combo Chart
- Area Chart
- Grouped Area Chart
- Stacked Area Chart
- Stream Area Chart
- Grouped Stacked Area Chart
- 100% Stacked Area Chart
- 100% Grouped Stacked Area Chart
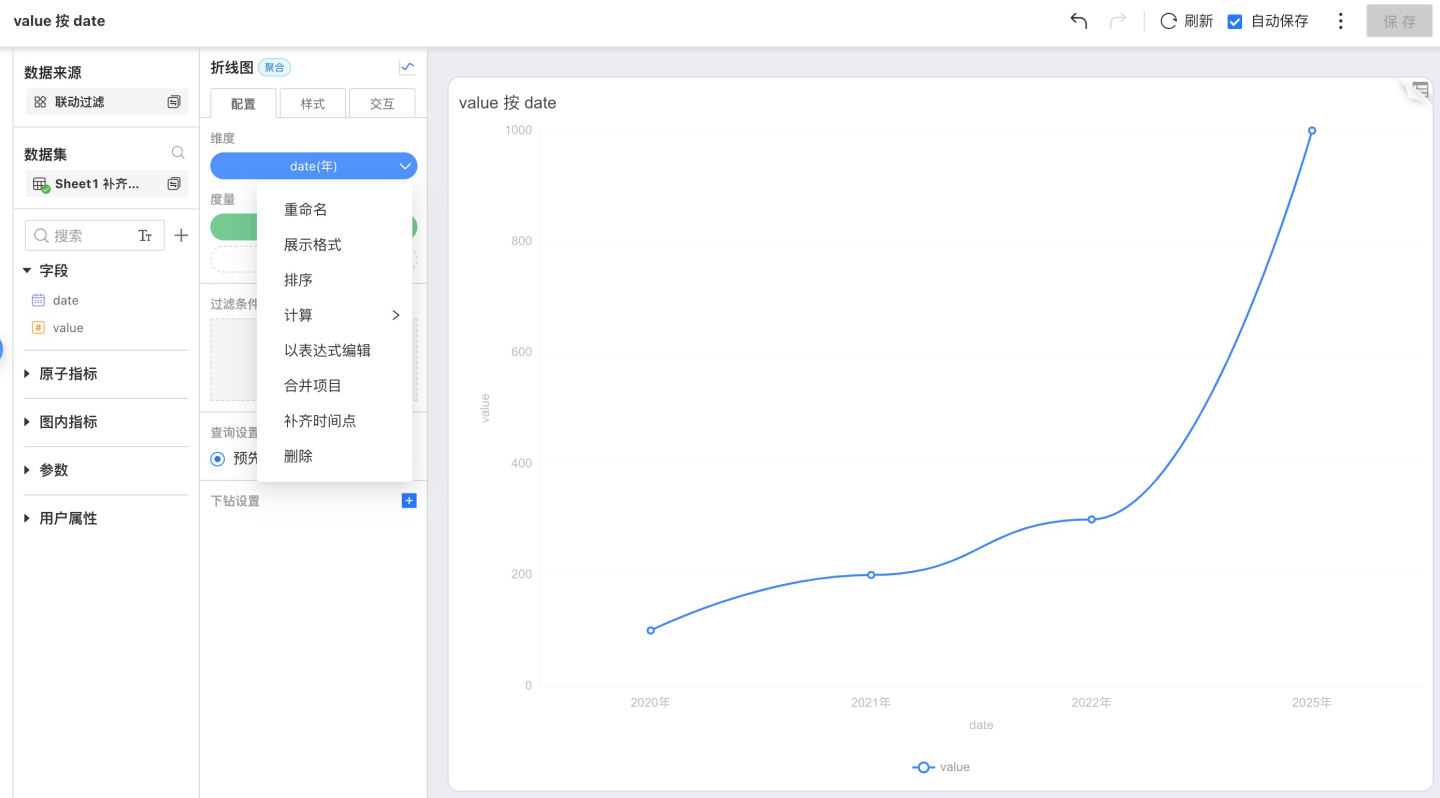
Charts with time point completion are shown below: 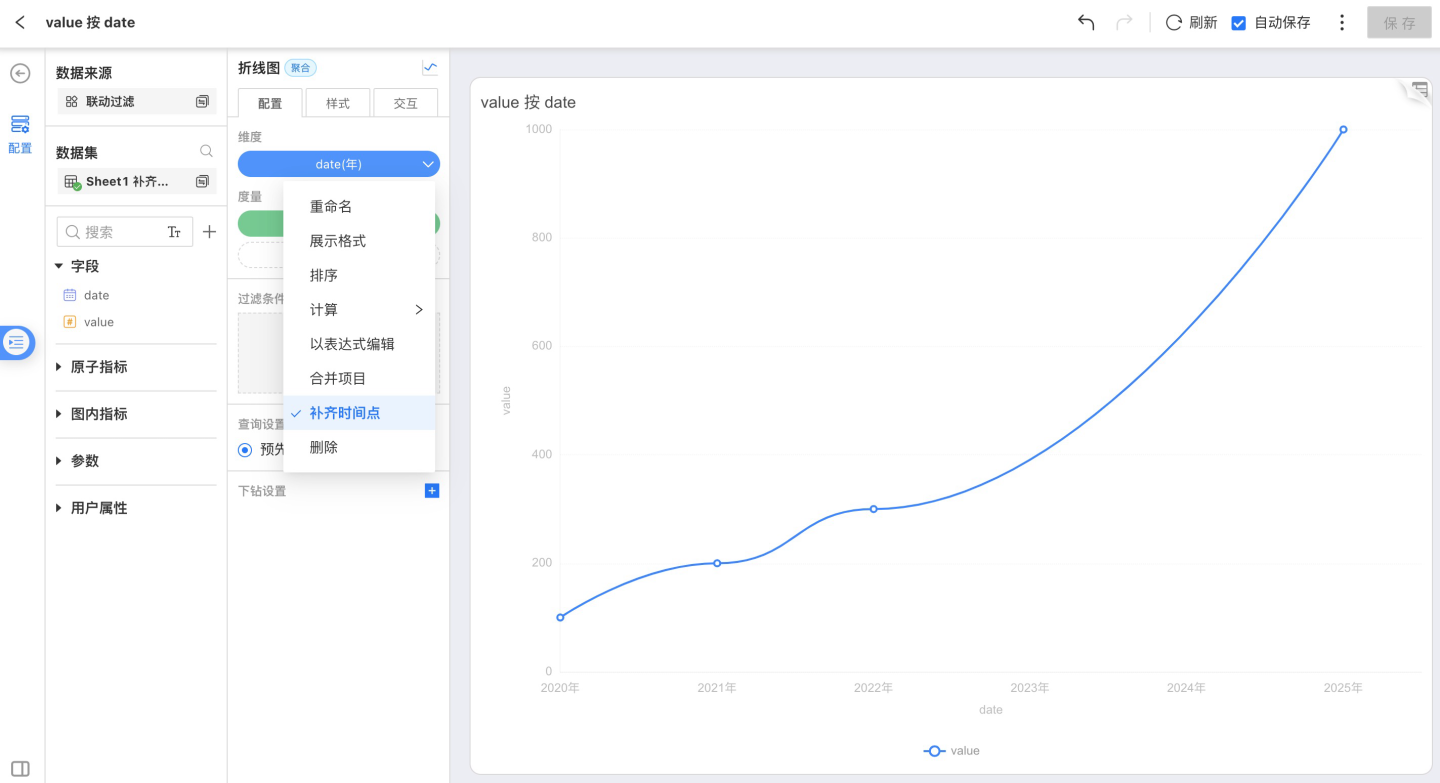
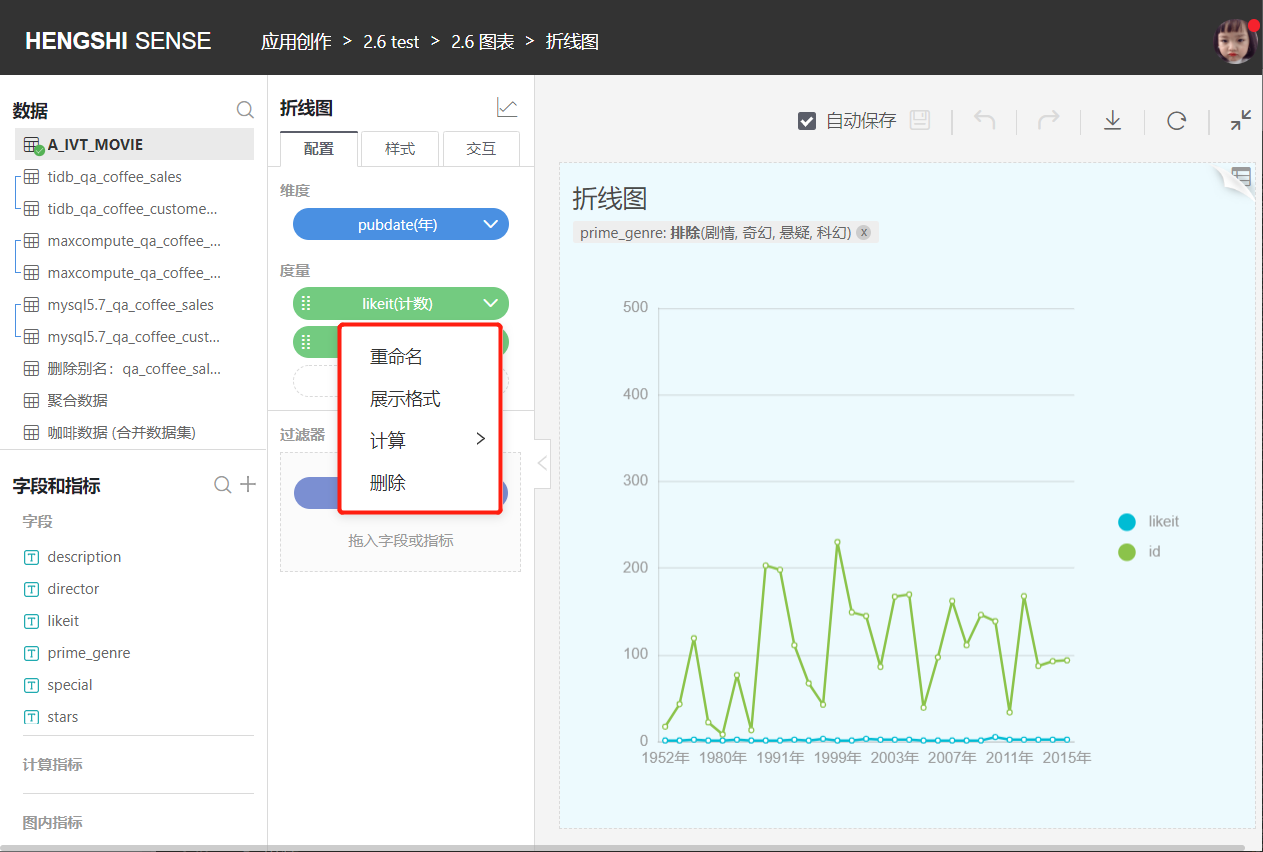
Metric Tools
Metric tools include:
- Rename: Modify the metric name to make the chart content more relevant to the business scenario.
- Display Format
- Calculation: Metric aggregation method.
- Delete: Remove the current metric.
Display Format
Non-date fields are displayed in numeric format; date fields are displayed in date format.
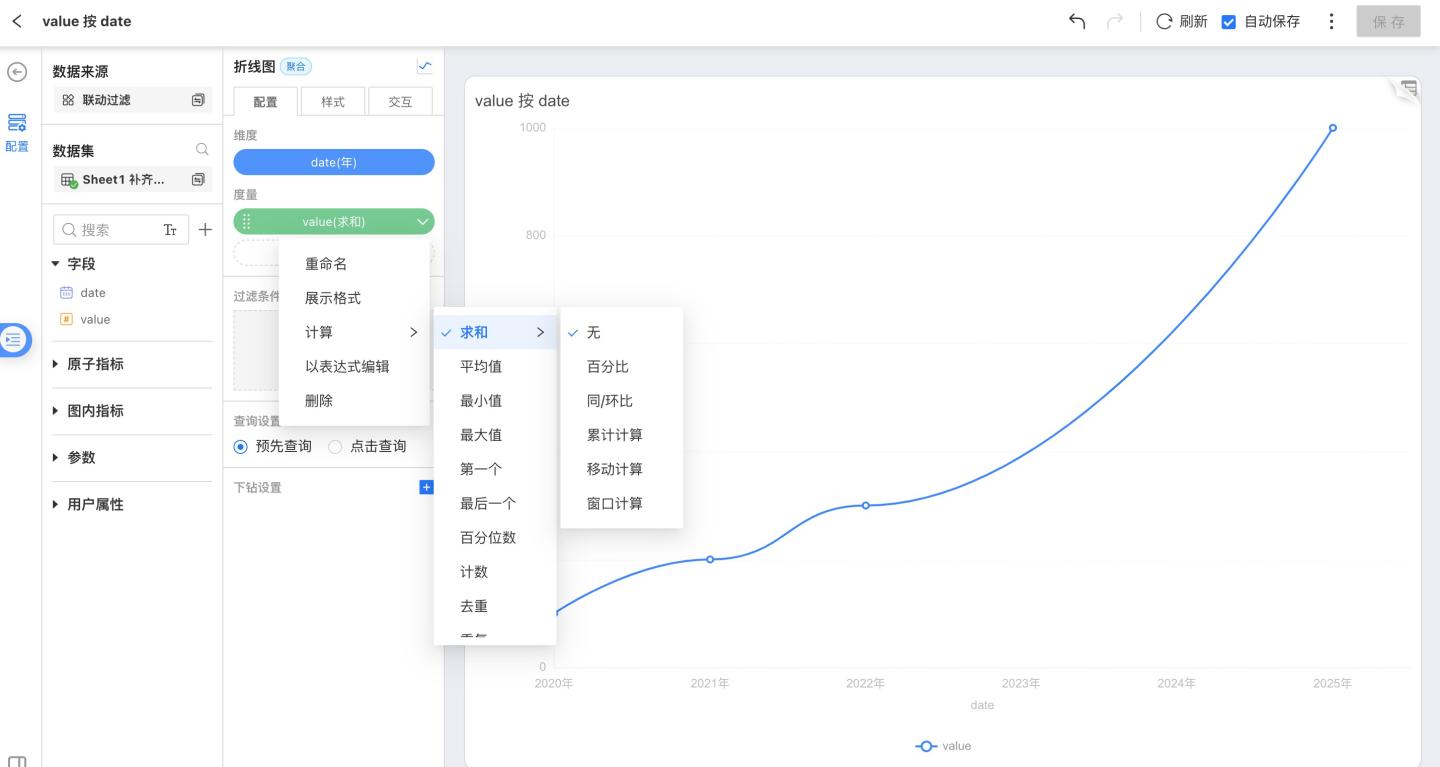
Calculation
Aggregation methods for numeric metrics include:
- Sum
- Average
- Minimum
- Maximum
- Percentile
- Count
- Distinct
- Duplicate
- Retention
- Active
Aggregation methods for non-numeric metrics include:
- Count
- Distinct
- Duplicate
- Retention
- Active
Filter
Drag fields from the Fields and Metrics section on the left into the Configuration -> Filter area of the chart to add filter conditions to the chart.
Fields and Metrics include Raw Fields, In-Chart Metrics, and Calculated Metrics, which are categorized by field type. You can select and add filter conditions as needed.
- For text type fields, you can choose
Exclude/Includefor filtering. - For numeric type fields, you can choose
Range/Comparisonfor filtering. - For date type fields, you can choose
Time Period/By Year/By Quarter/By Month/Rangefor filtering. - For all types, you can also enter expressions in the
Expressionfield for filtering. Supported Functions for Expressions
Tip
Filter expressions do not allow mixing aggregate and non-aggregate expressions.
Drag fields into Configuration -> Filter: 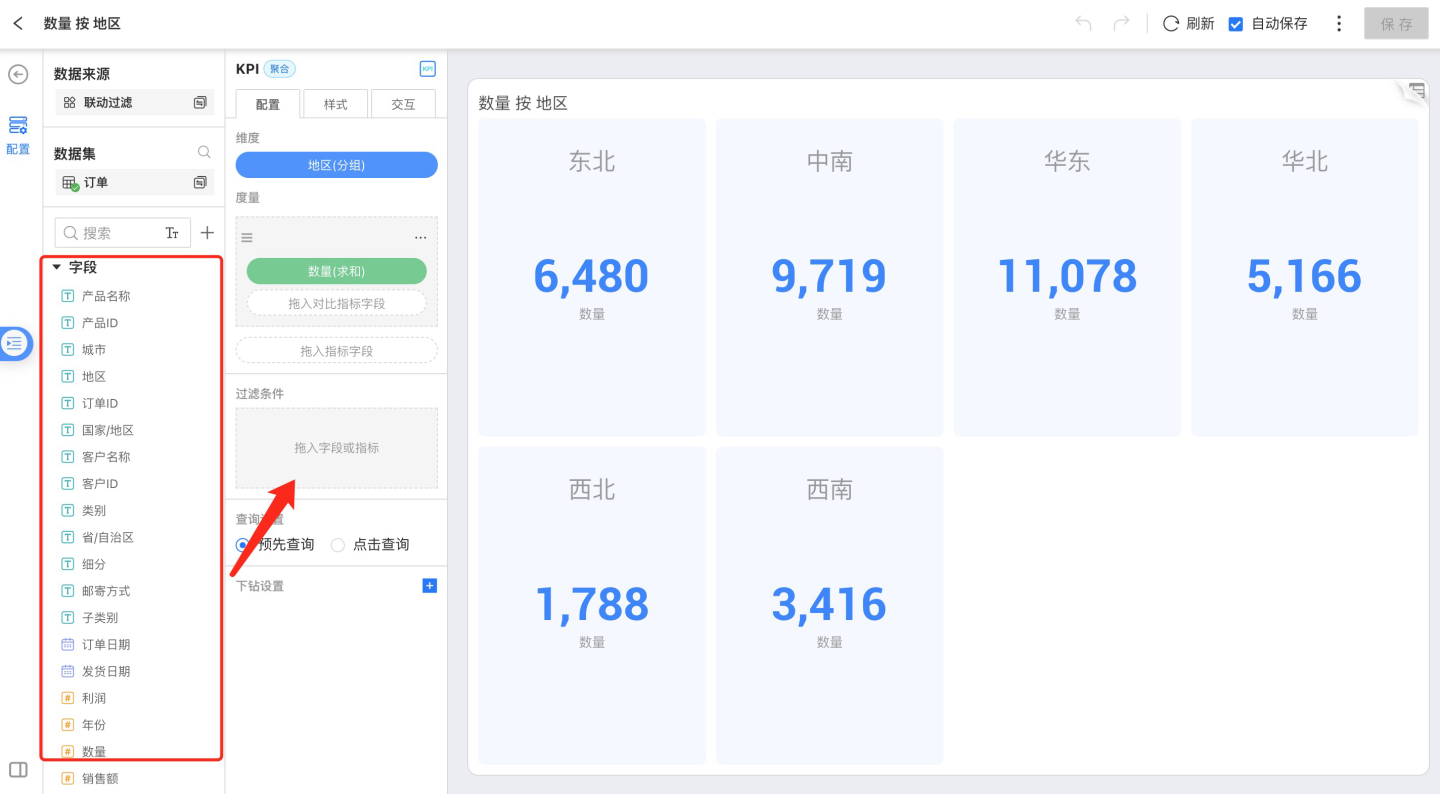
Text type field filtering: 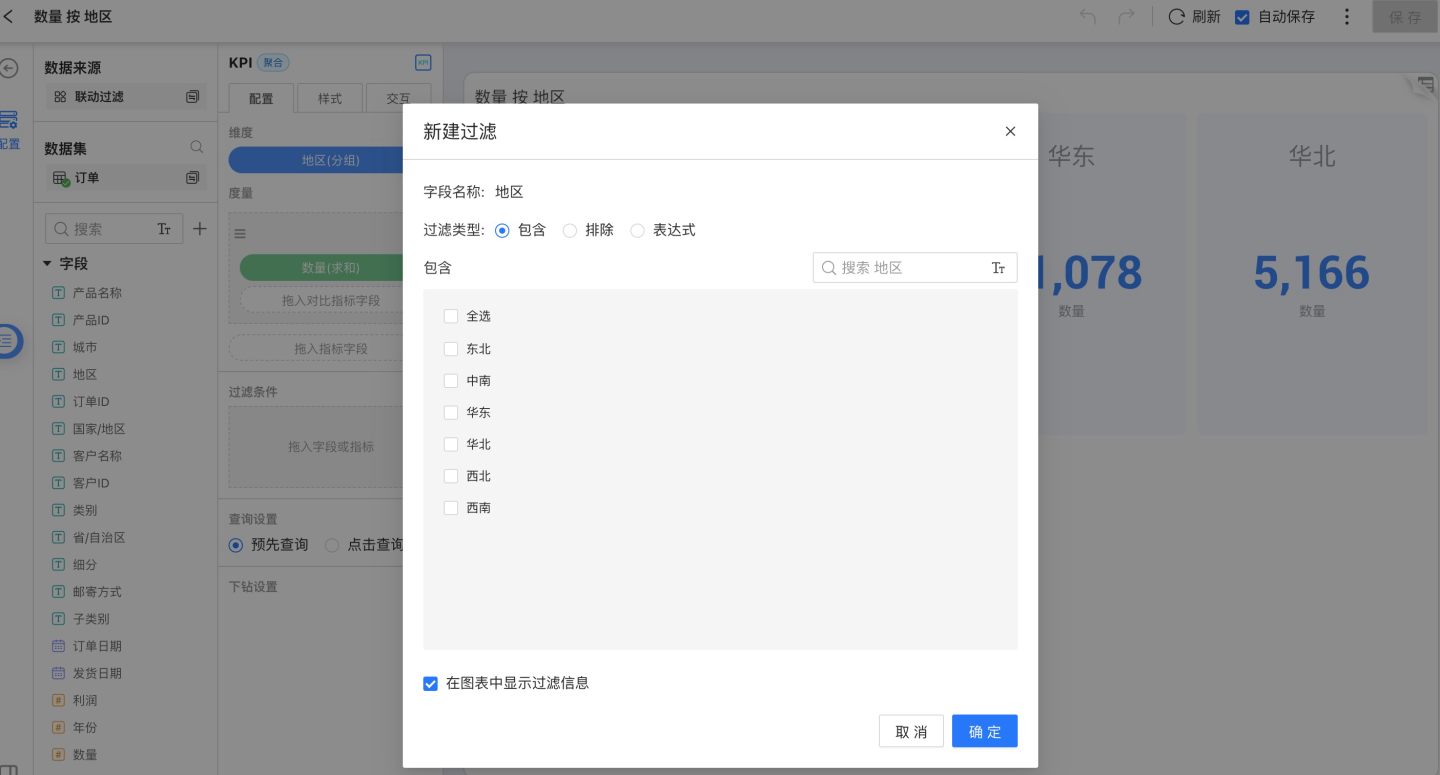
Numeric type field filtering: 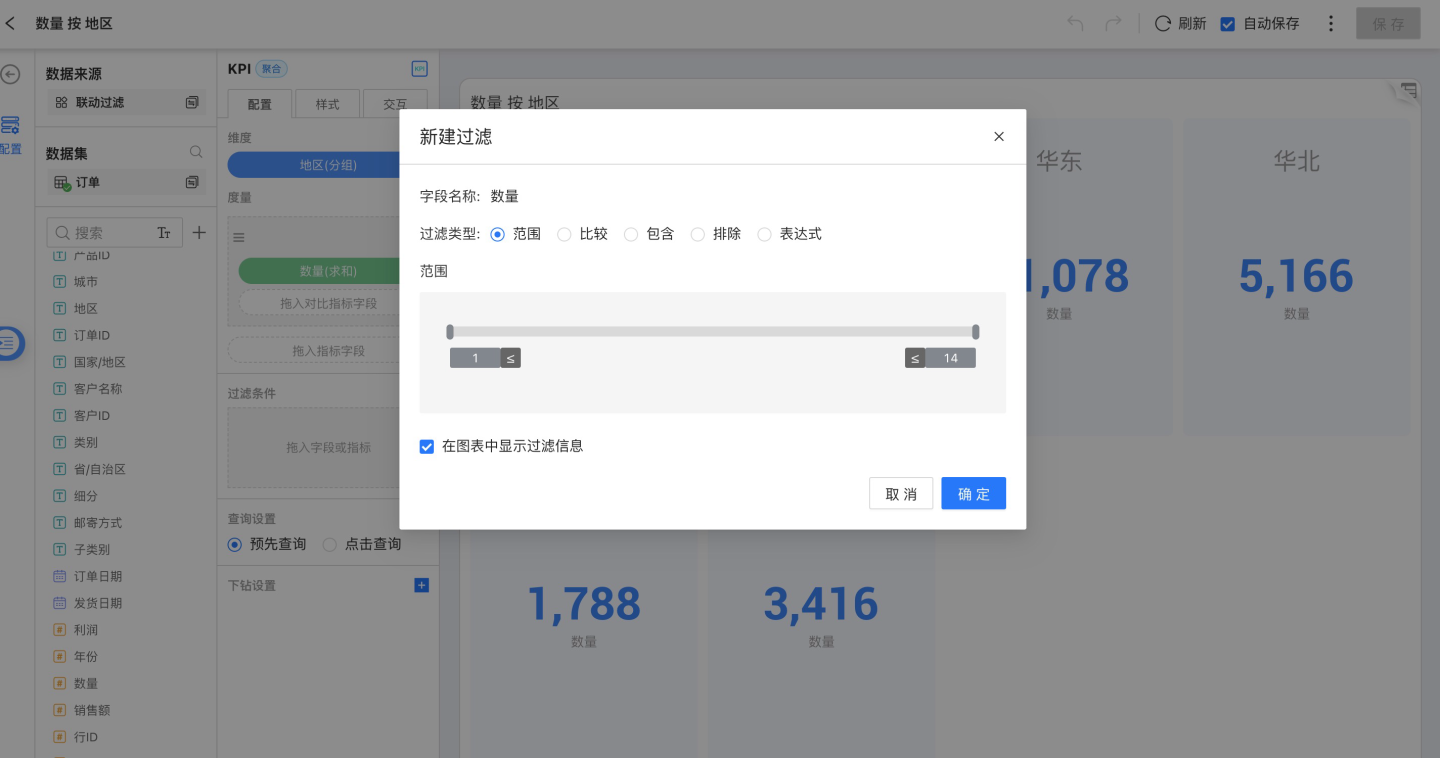
Date type field filtering: 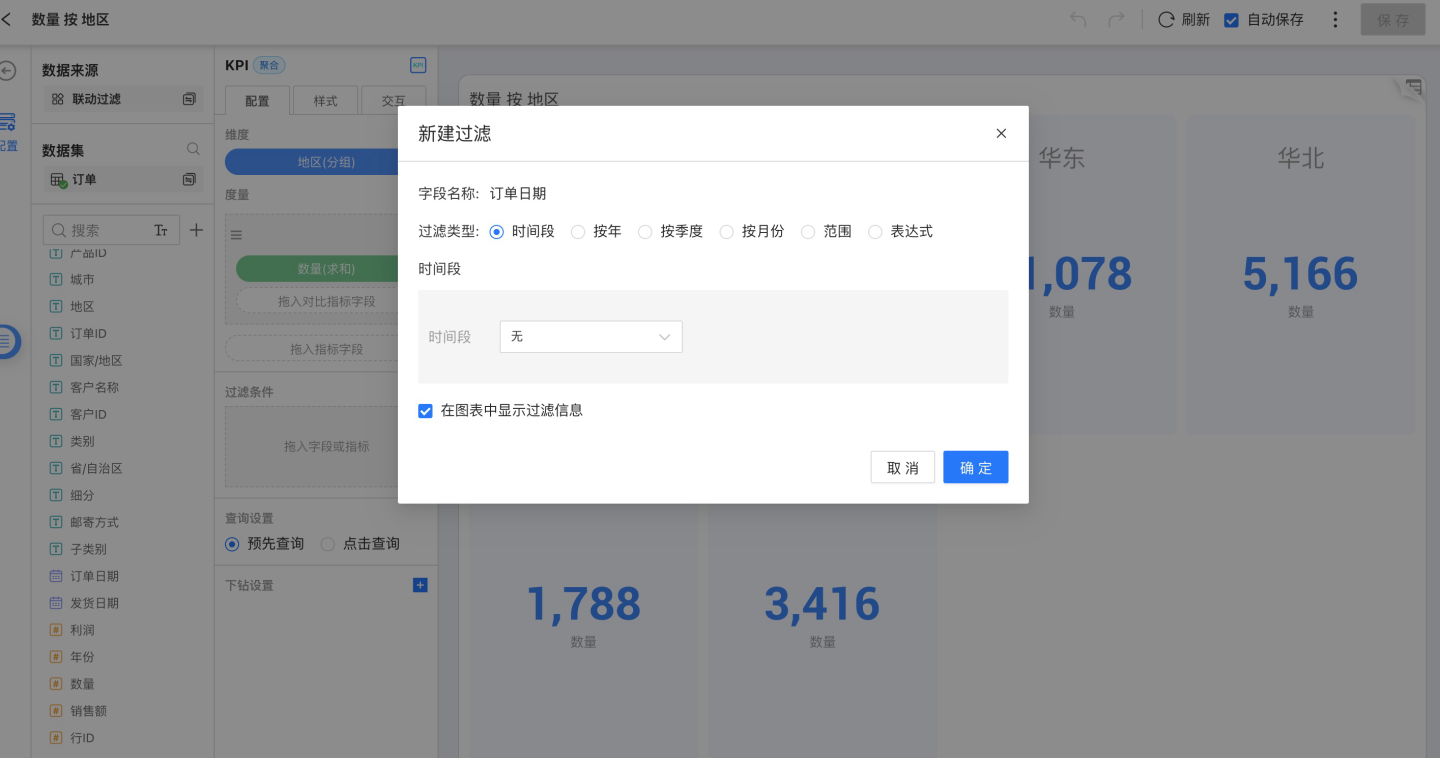
Expression filtering: 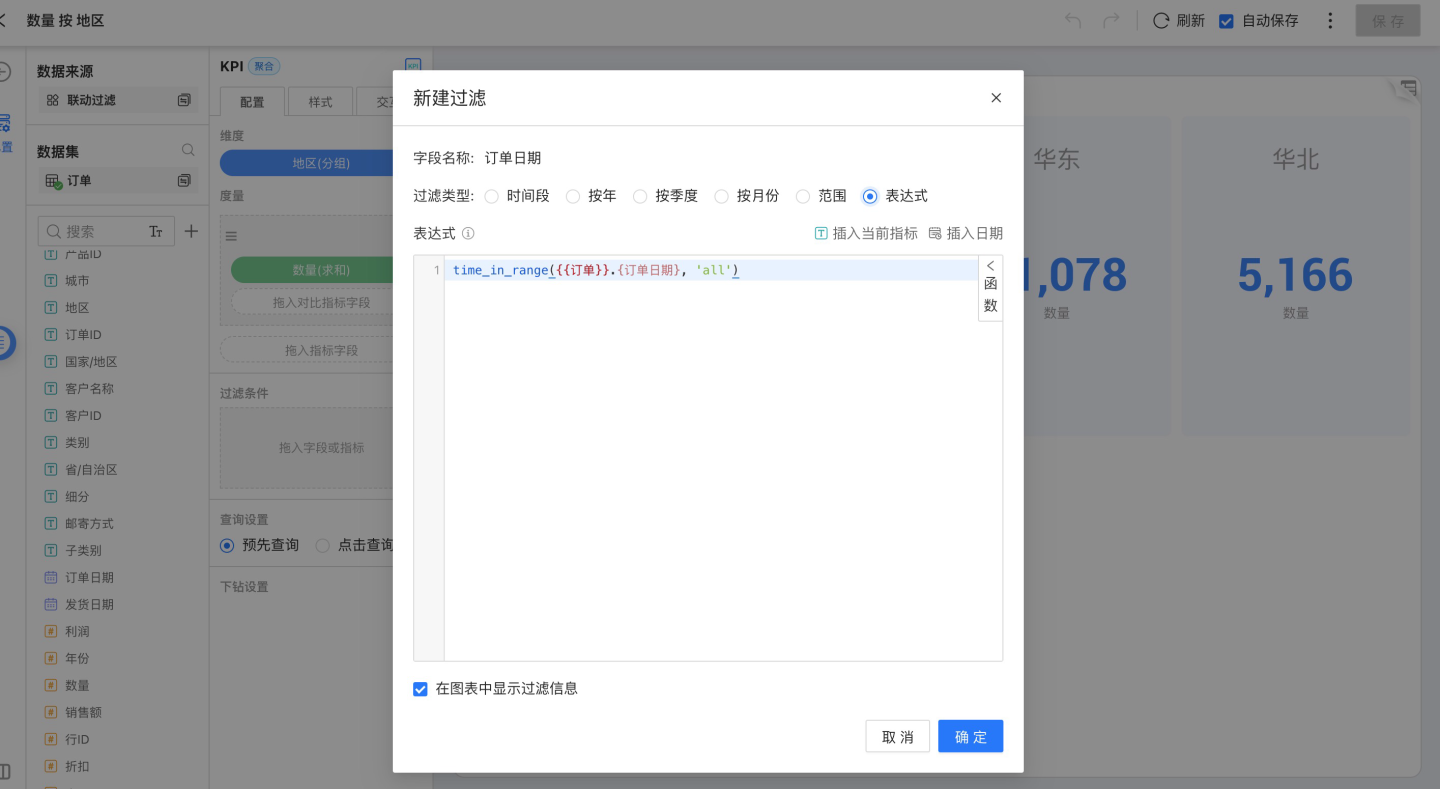
You can choose whether to display filter information during filtering 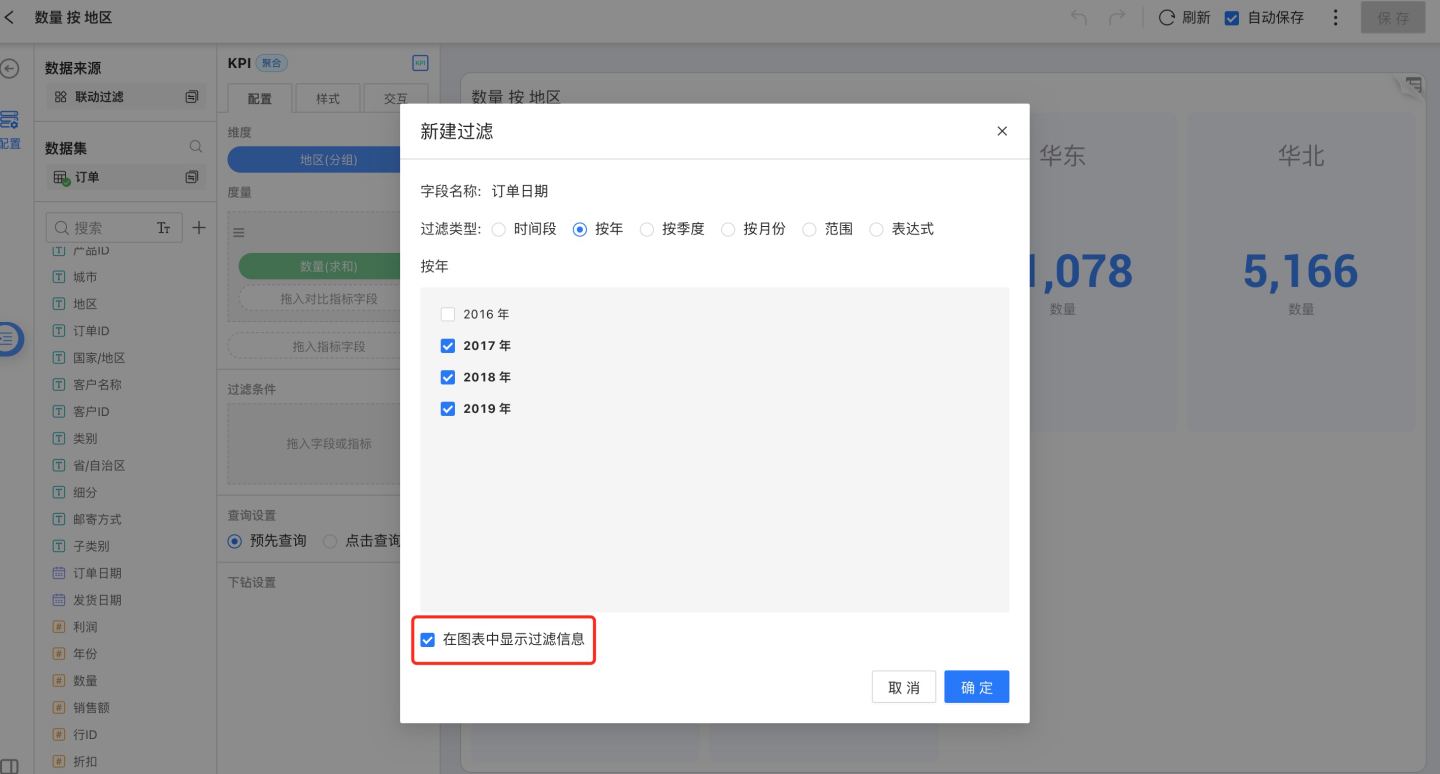
If you choose to display filter information, the filter conditions will be shown below the chart name 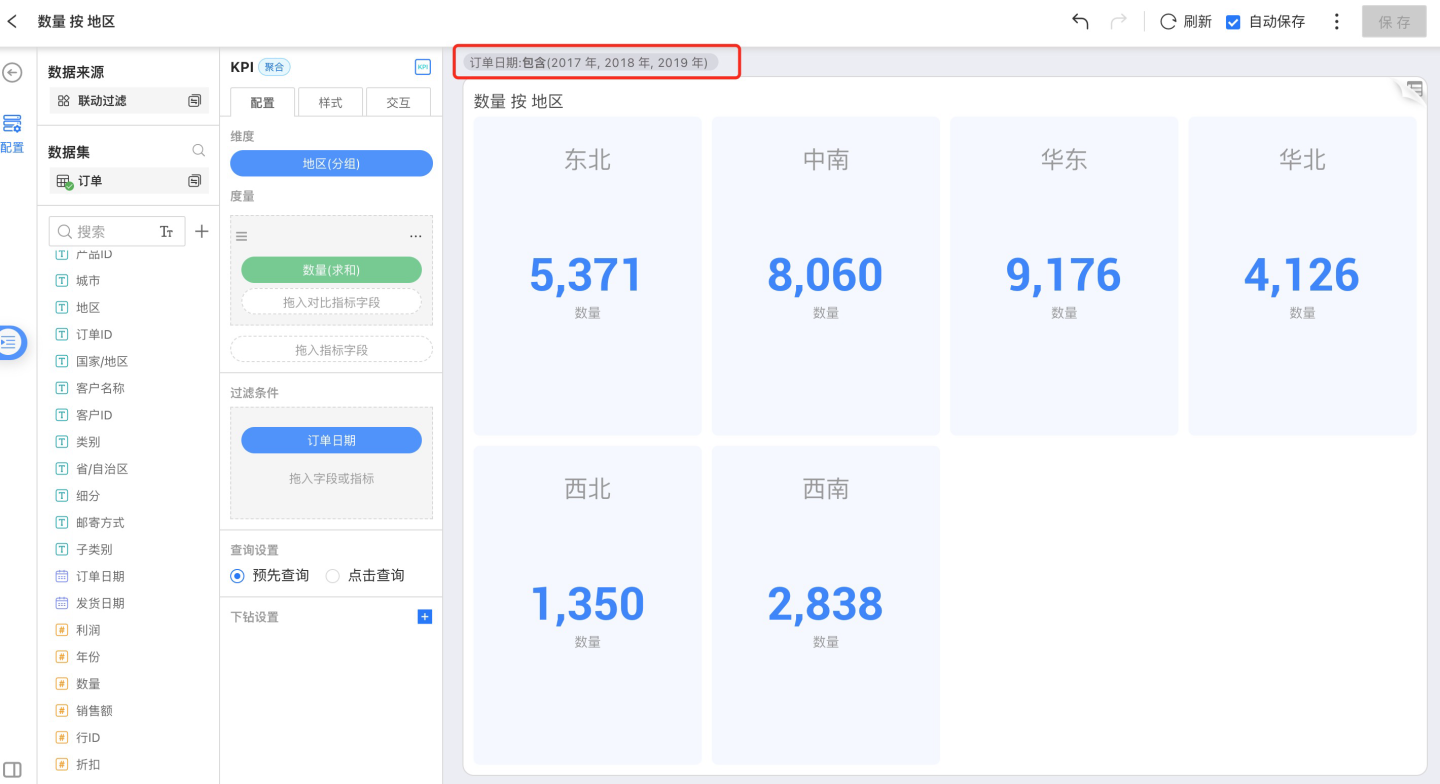
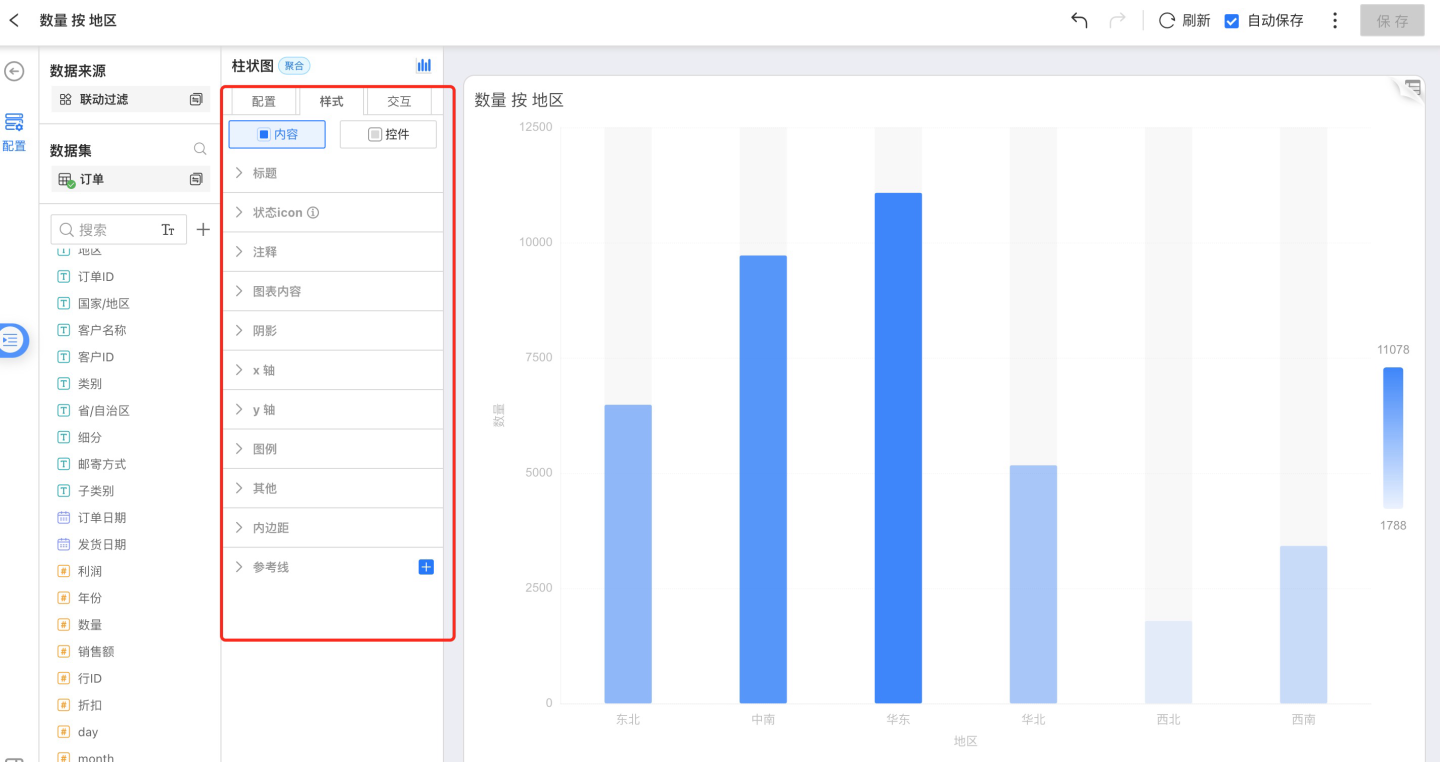
Style
Style includes the following sections:
- Title
- Chart Content
- Shadow
- X Axis
- Y Axis
- Legend
- Reference Line
- Padding
Title
You can customize the name of the chart.
Status Icon
You can set the display status of icons on charts within the dashboard, supporting both hover display and fixed display.
Annotation
- Chart annotation: Rich text, editable as needed
- Field annotation: Notes and business meaning of field metrics defined in the dataset
Chart Content
Chart content includes the following sections:
- Color: You can change the chart color scheme. You can select a predefined color palette or customize the color for each dimension group individually.
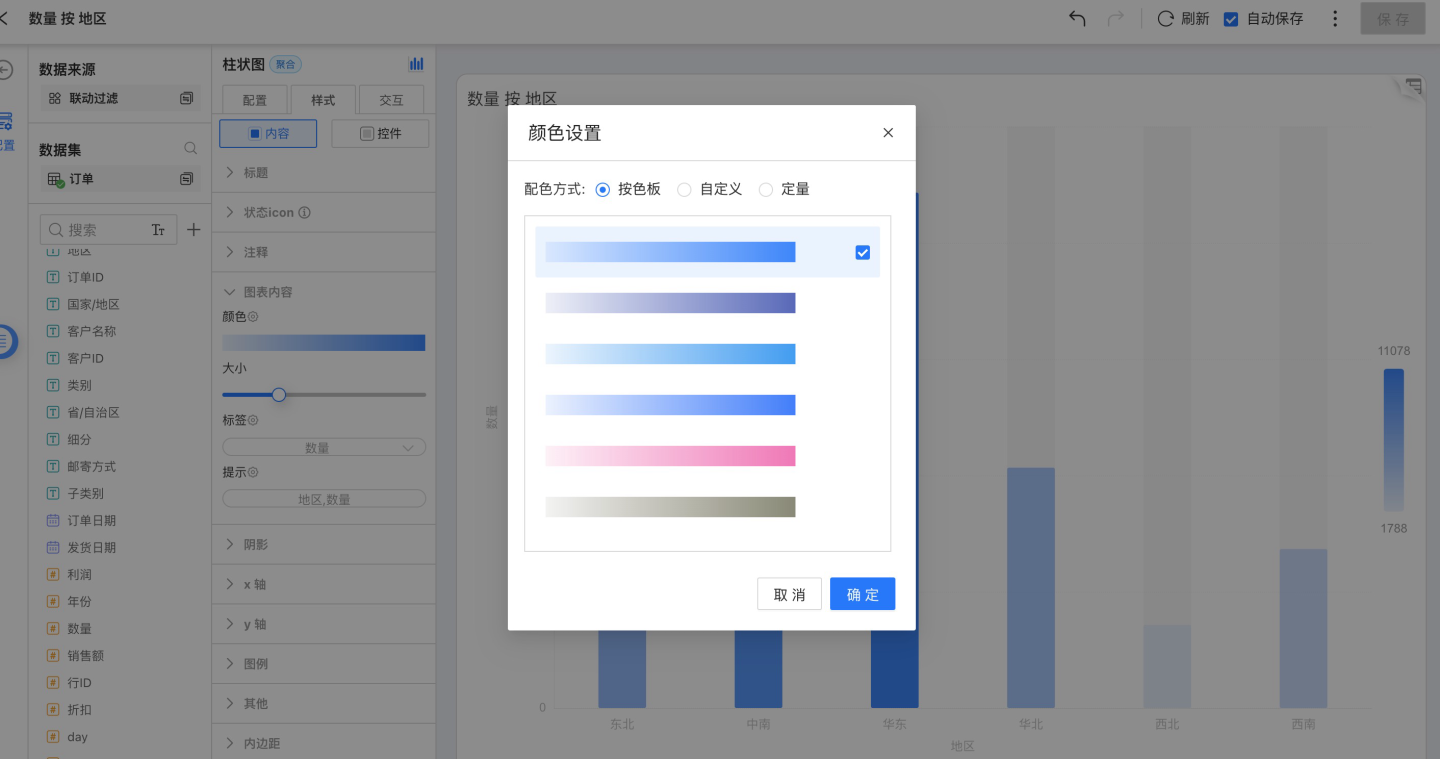
At the bottom of the color settings, there is a Show Gradient toggle switch. For all non-gradient color bar charts and area charts, you can enable gradient coloring. 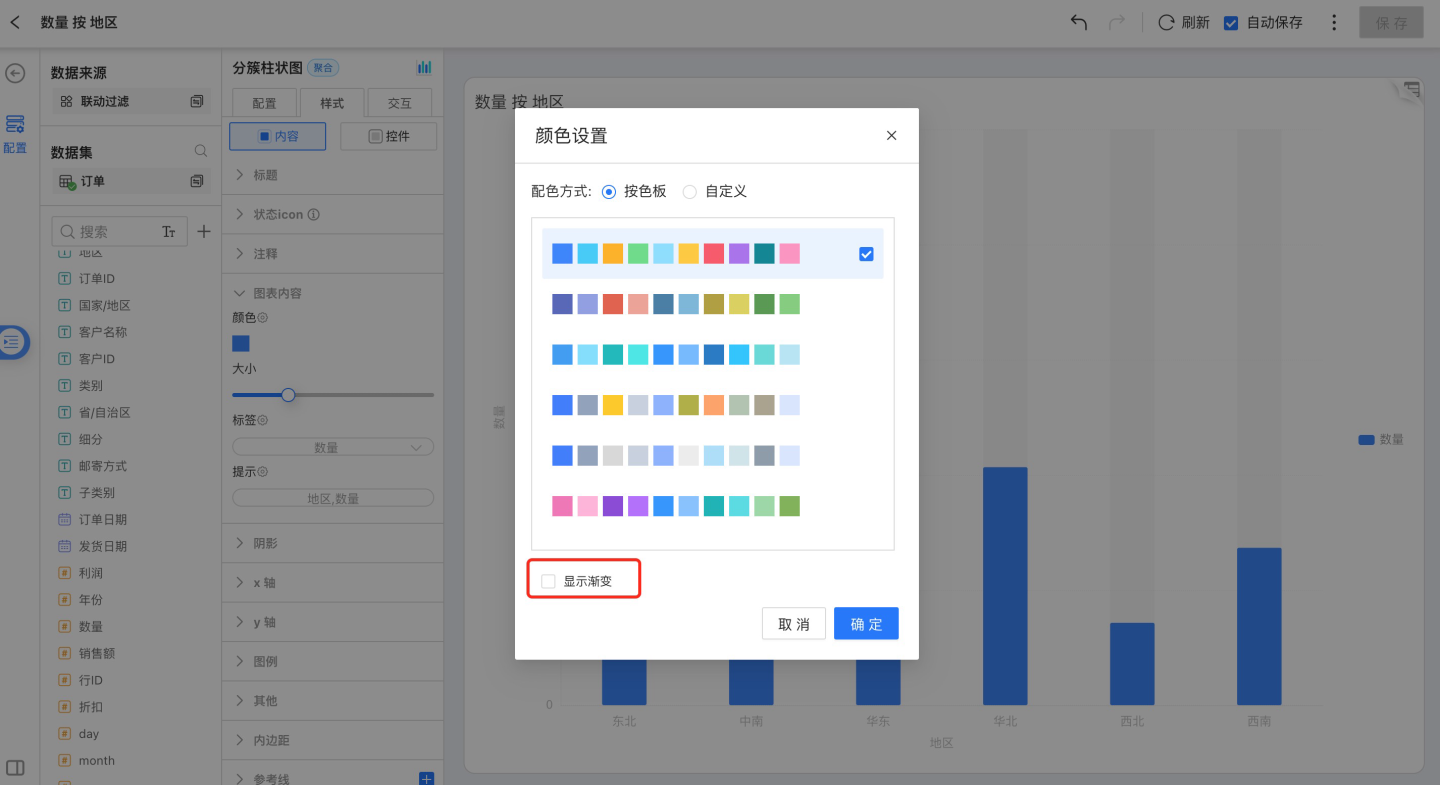
Size: You can adjust the chart size.
Label: Chart labels can display metric values, dimension groups, and other information. You can modify the label's font, color, weight, text angle, position, and offset.
Tooltip: Tooltips can display metric values and dimension groups. You can modify the tooltip's font, color, weight, border color, border thickness, shape, background color, and more.
Shadow
Only charts under the Bar Group can have shadows enabled. Click Style -> Shadow to set whether to display the shadow and to configure the shadow color. 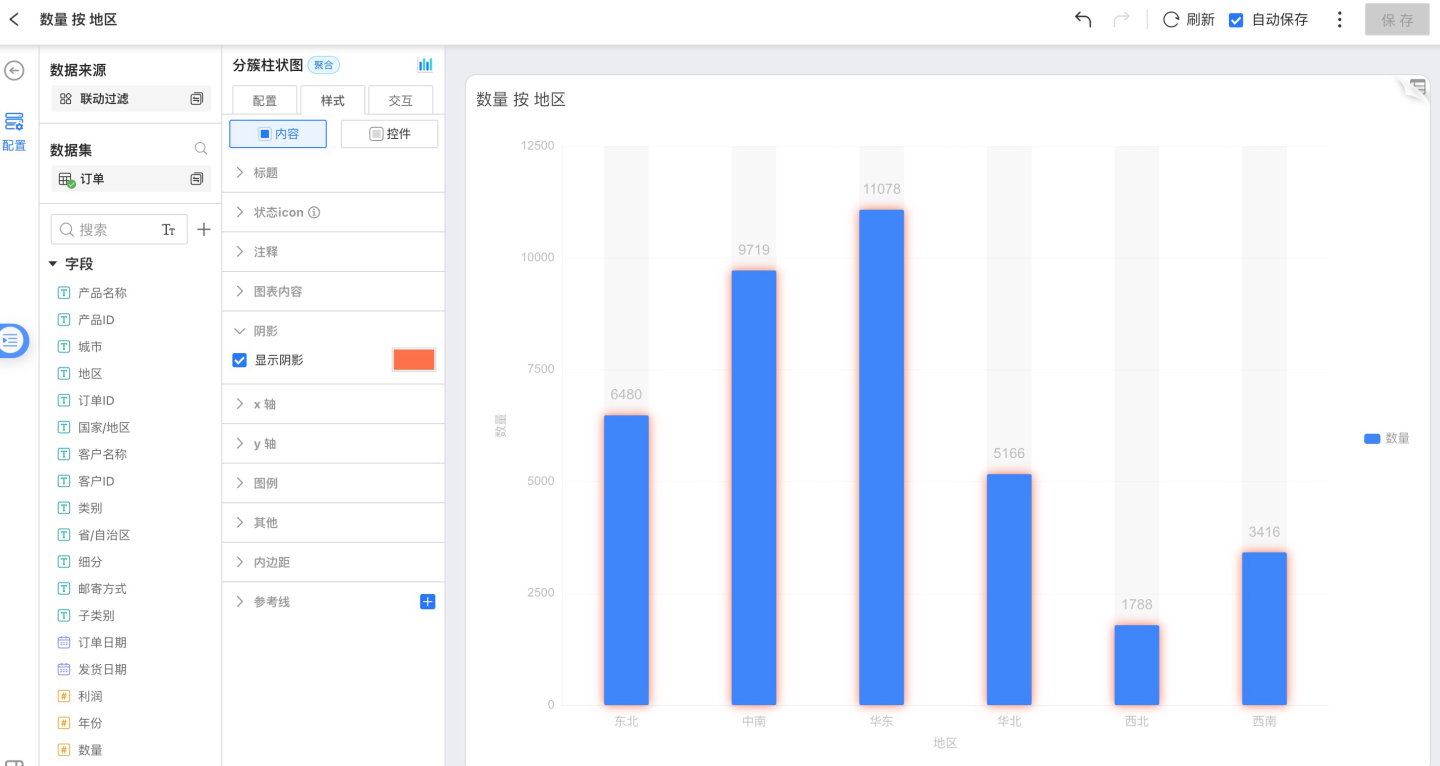
X-Axis
You can adjust the font color, size, text angle, axis style, and choose to display the axis and tick labels. 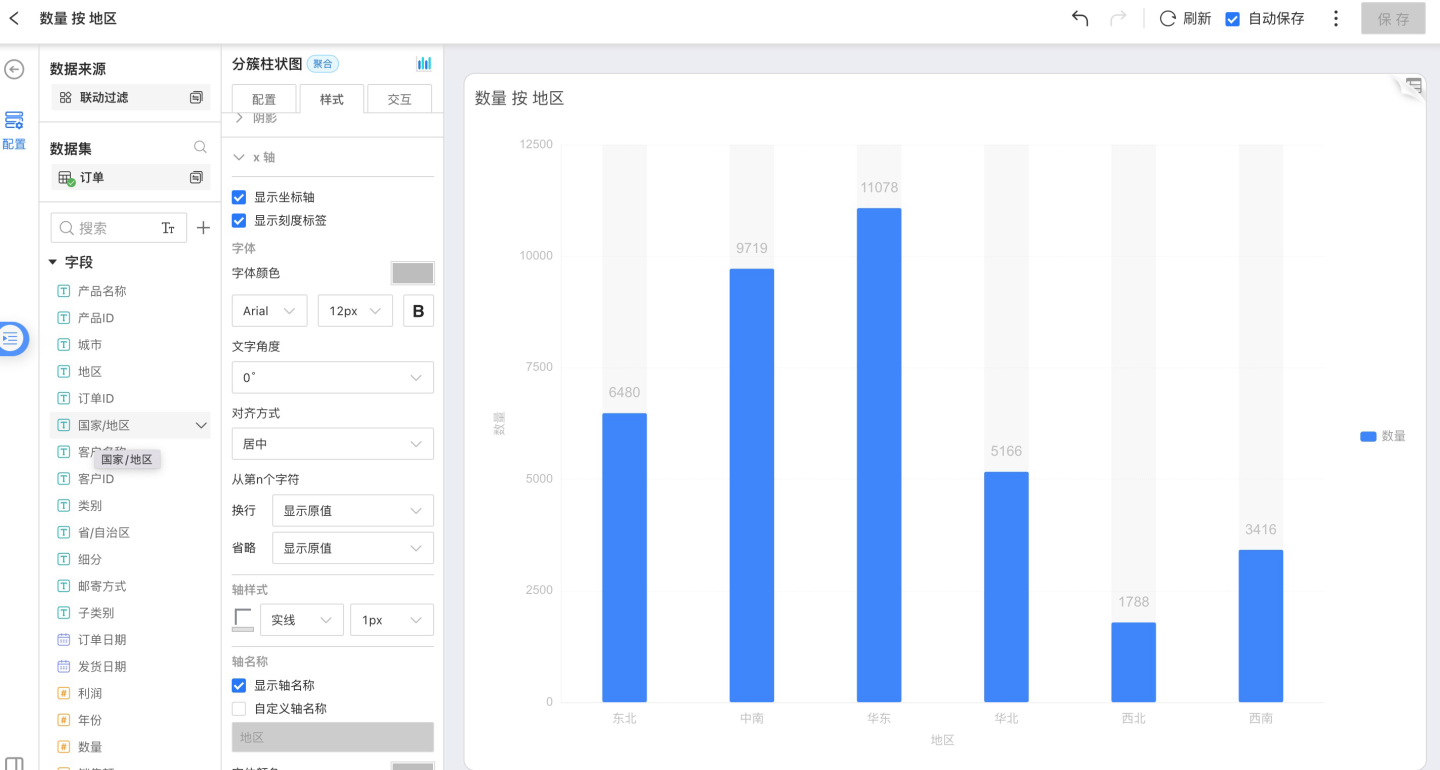
Y Axis
You can adjust the font color, size, text angle, axis style, display the axis and tick labels, adjust the tick range, and tick lines. 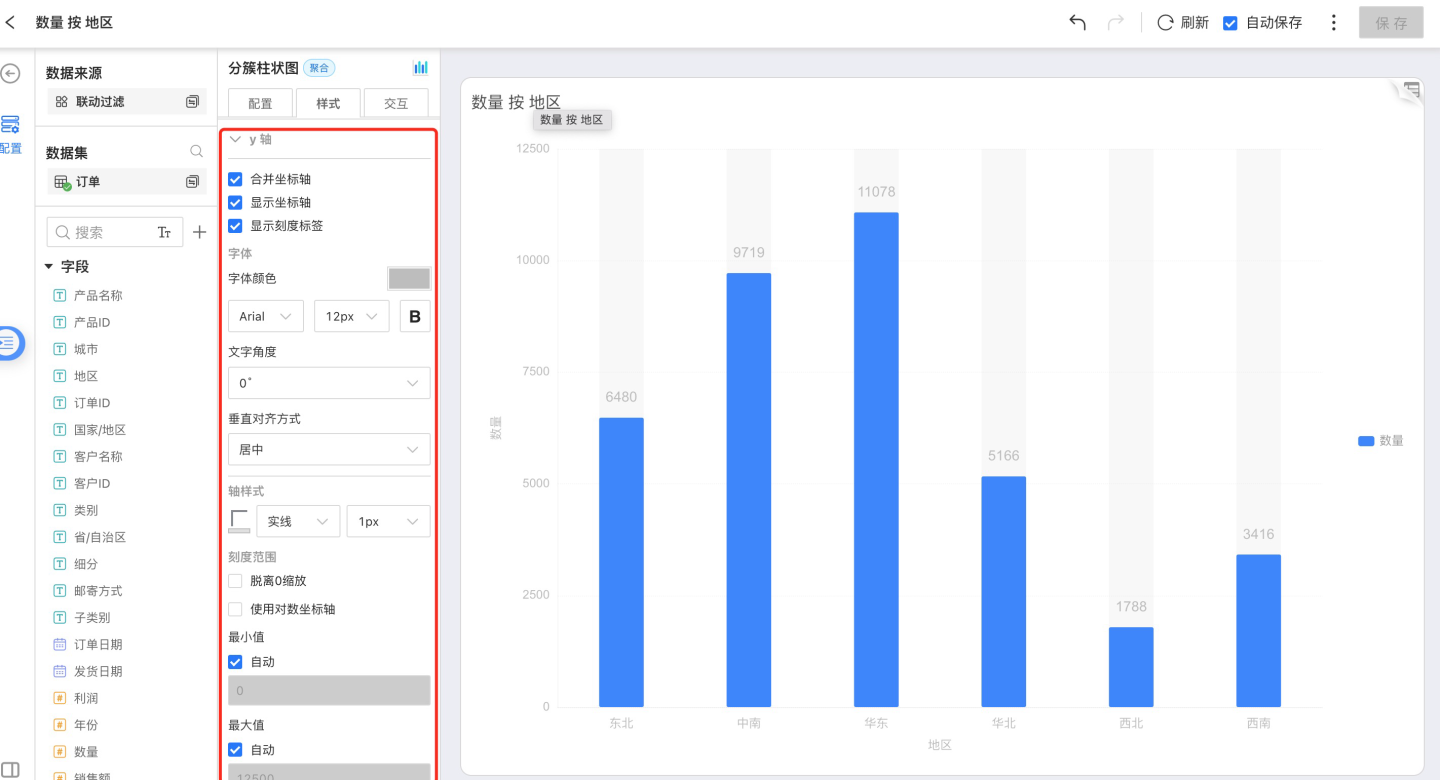
Display Legend
You can choose whether to display the legend and set its position to the left, right, or top. You can also modify the legend's font, color, size, and whether it is bold. 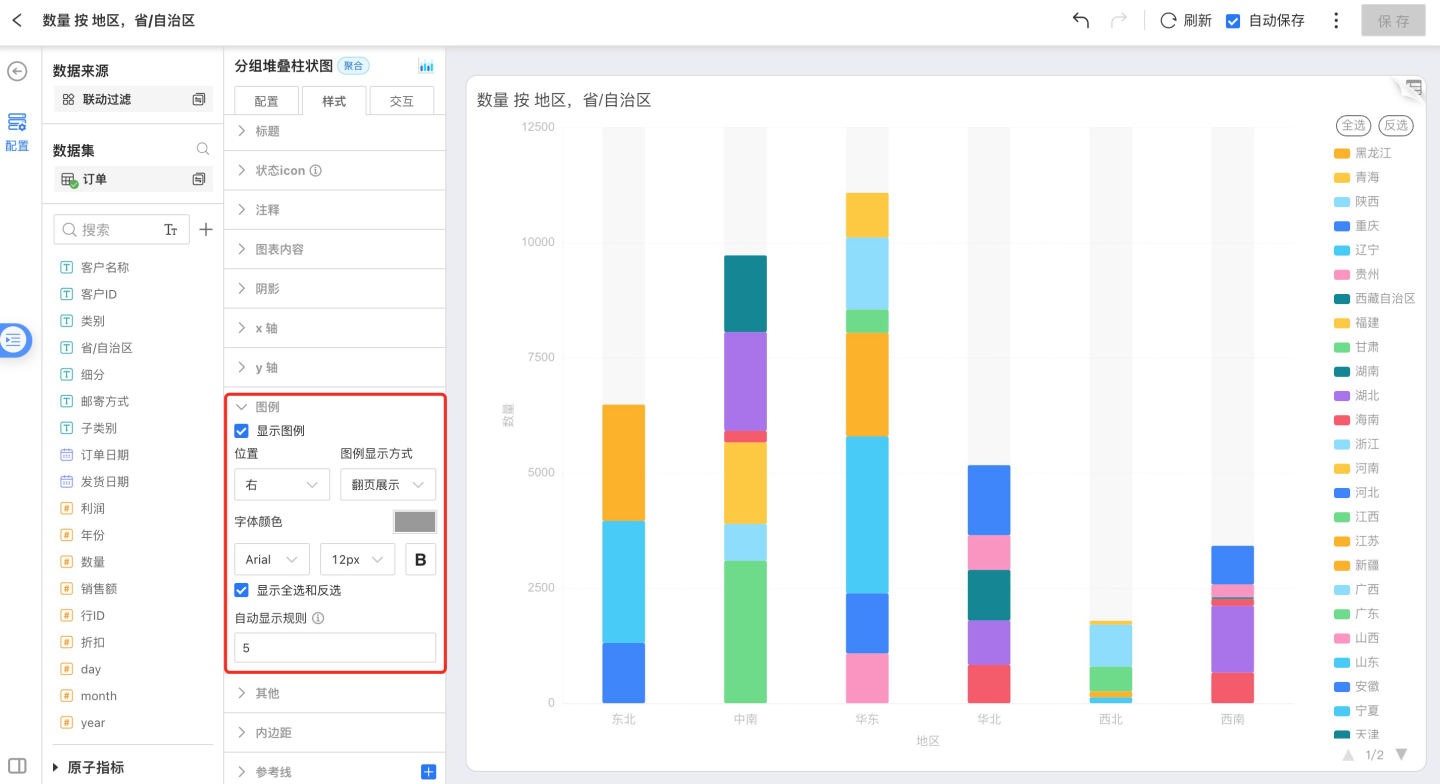
Supports displaying "Select All" and "Deselect All" options. When the display toggle is enabled and the number of legends is greater than or equal to the set auto-display rule, the "Select All" and "Deselect All" buttons will be shown.
Reference Line
For more details, see Reference Line.
Padding
Padding can control the position of the chart within the entire page.
Interaction
Interaction includes the following sections:
- Limit Rows
- Auto Refresh
- Value Range Roaming
- Time Roaming
- Click Interaction Behavior in Chart
- Drill-down Settings
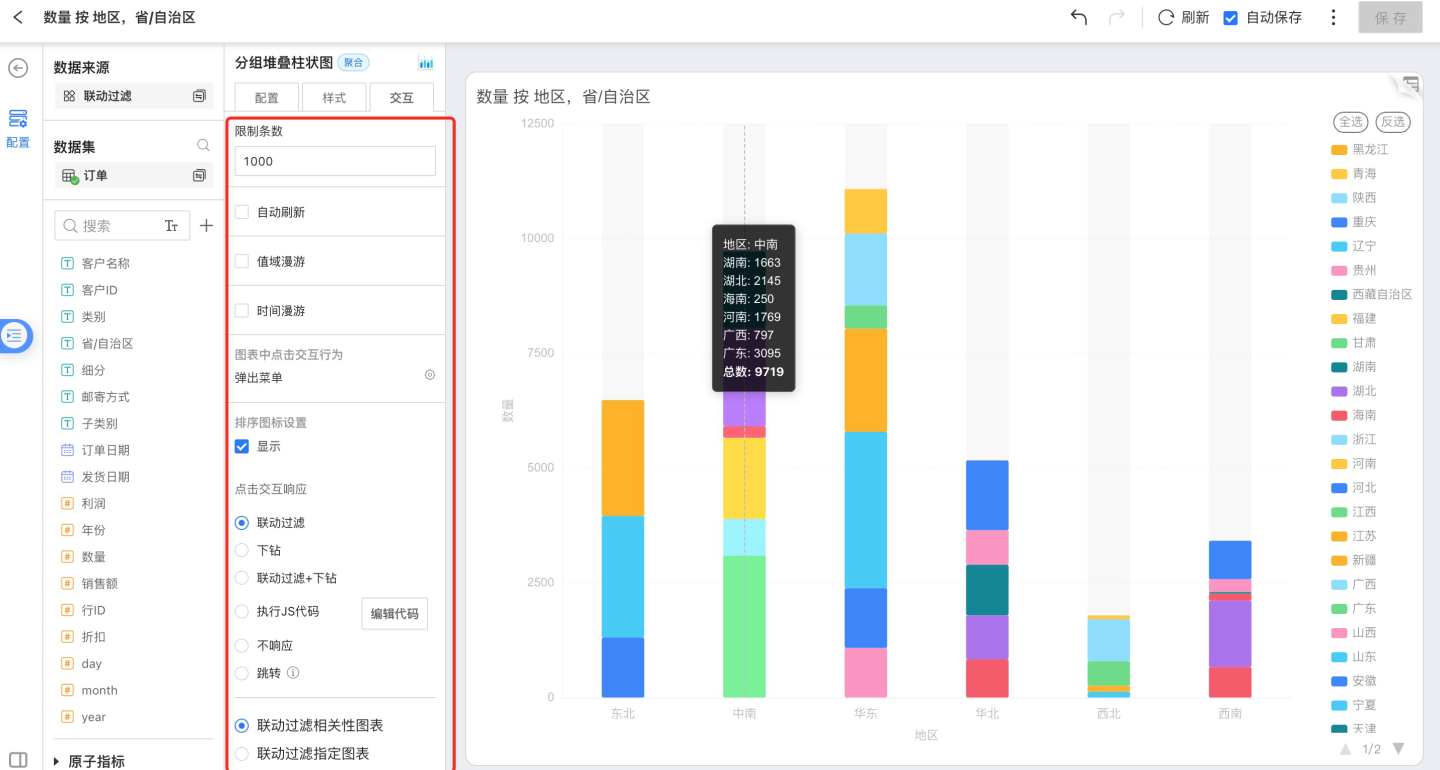
Limit Number of Rows
Users can set the number of data rows displayed in the chart via Interaction -> Limit Number of Rows, with a default value of 1000 rows.
Please note
Setting this value too high may slow down both the database and the browser.
Auto Refresh
Similar to the Refresh feature of dashboards, the auto refresh function allows chart data to be updated automatically at regular intervals. After enabling the auto refresh feature, you can set the update interval, and the auto refresh time value supports customization.
Charts with auto refresh enabled will also refresh automatically within dashboards. 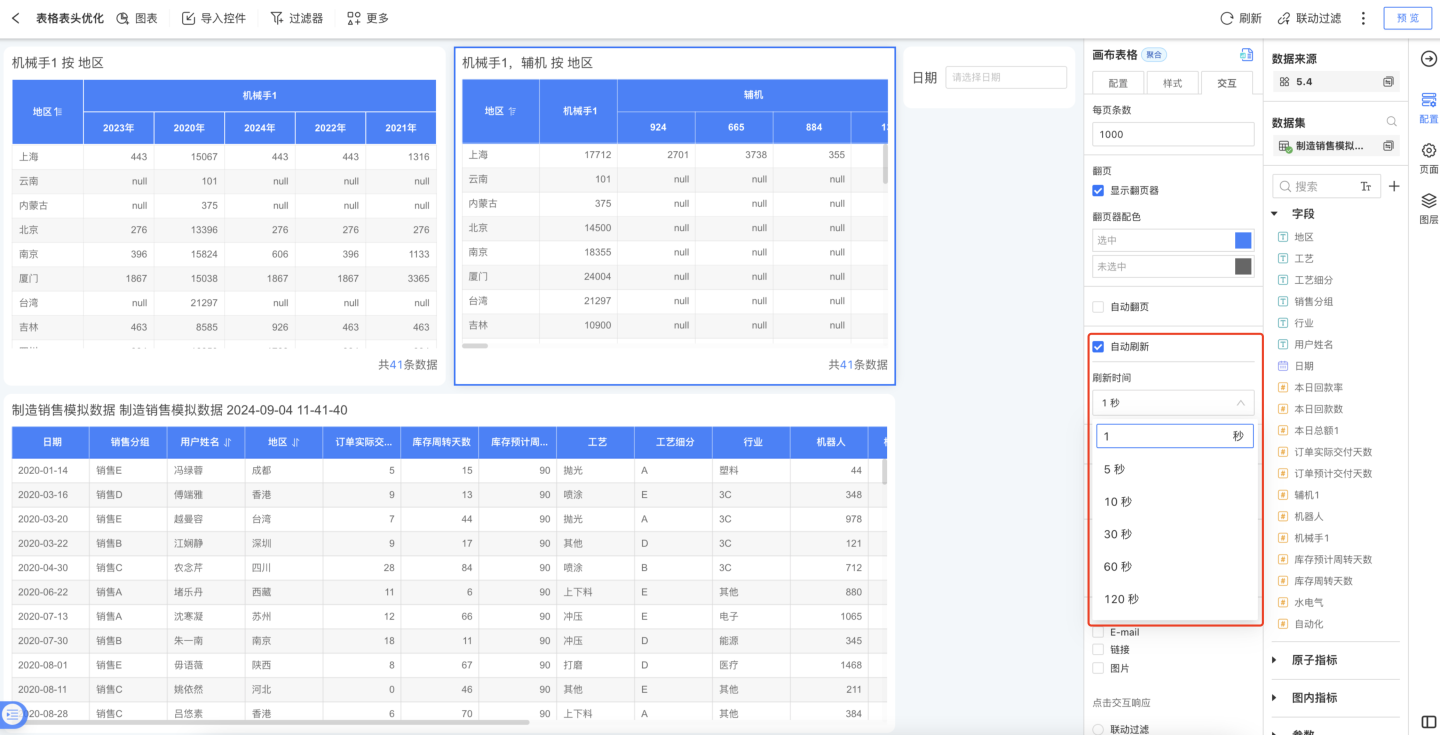
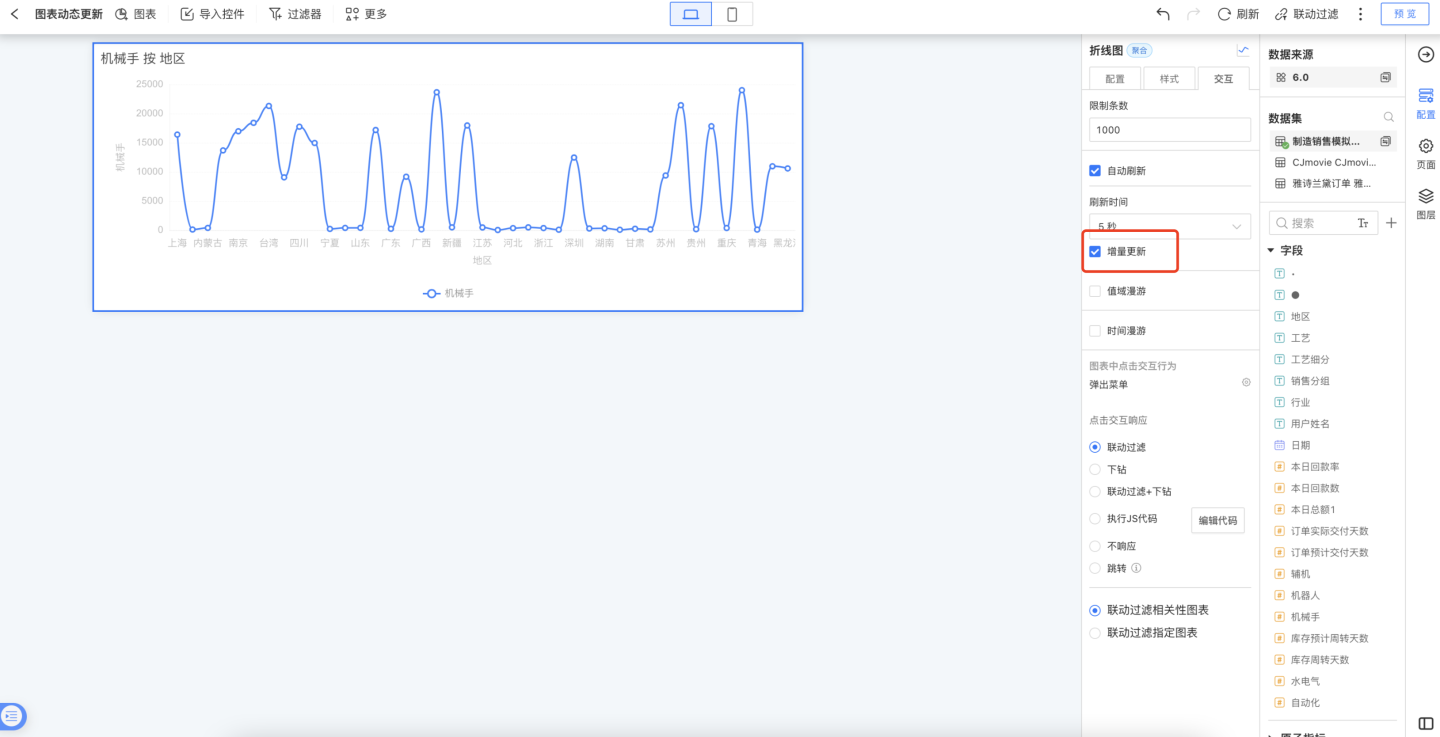
If a data analyst wants to create a dashboard where charts dynamically update based on real-time data—displaying dynamic effects like an electrocardiogram on a large screen—they can enable the Auto Refresh -> Incremental Update feature.
Supported chart types for incremental updates: Gauge, all Bar chart types, all Donut chart types, all Line/Area chart types, all Relationship chart types, Simple Map, and Combo chart.
Data Zoom
When Data Zoom is enabled, a slider will appear on the dimension axis, allowing you to adjust the currently displayed dimensions by dragging the slider. Each dimension will be proportionally re-displayed in the chart. As shown in the figure, the gray scroll bar below the dimension axis: 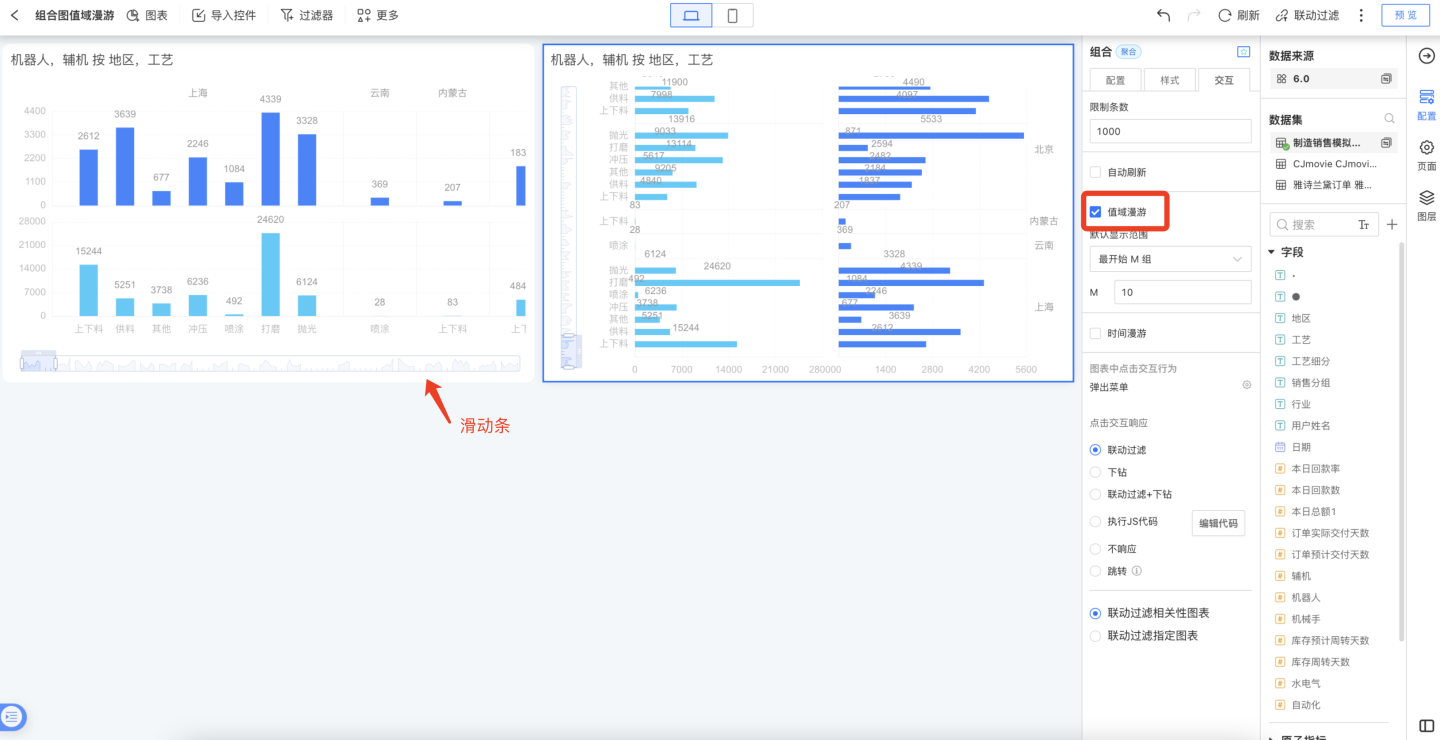
When some charts have a large number of data groups (such as bar charts), but you do not want to display all groups by default, you can configure the default display range for Data Zoom. There are four options available: "All", "First M Groups", "Last N Groups", and "Custom", which can meet various configuration scenarios. 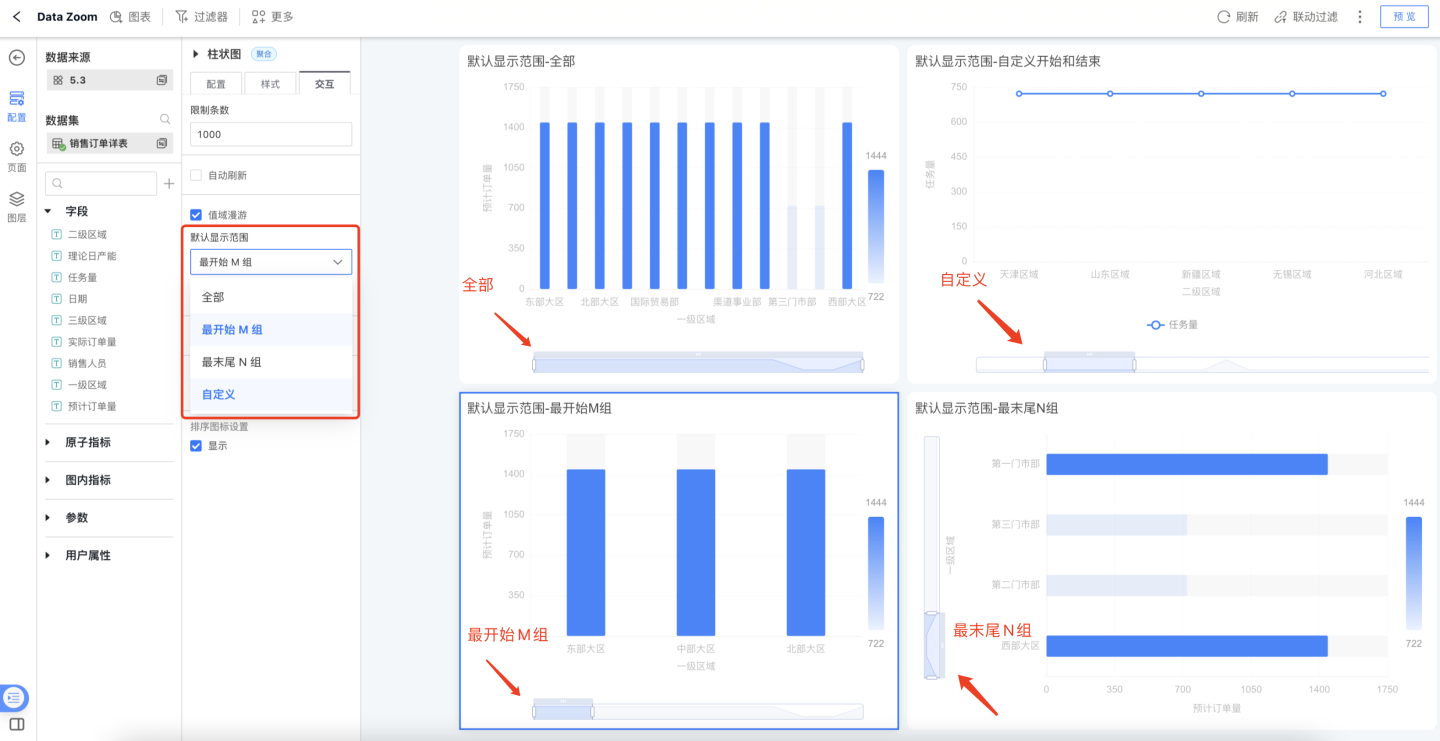
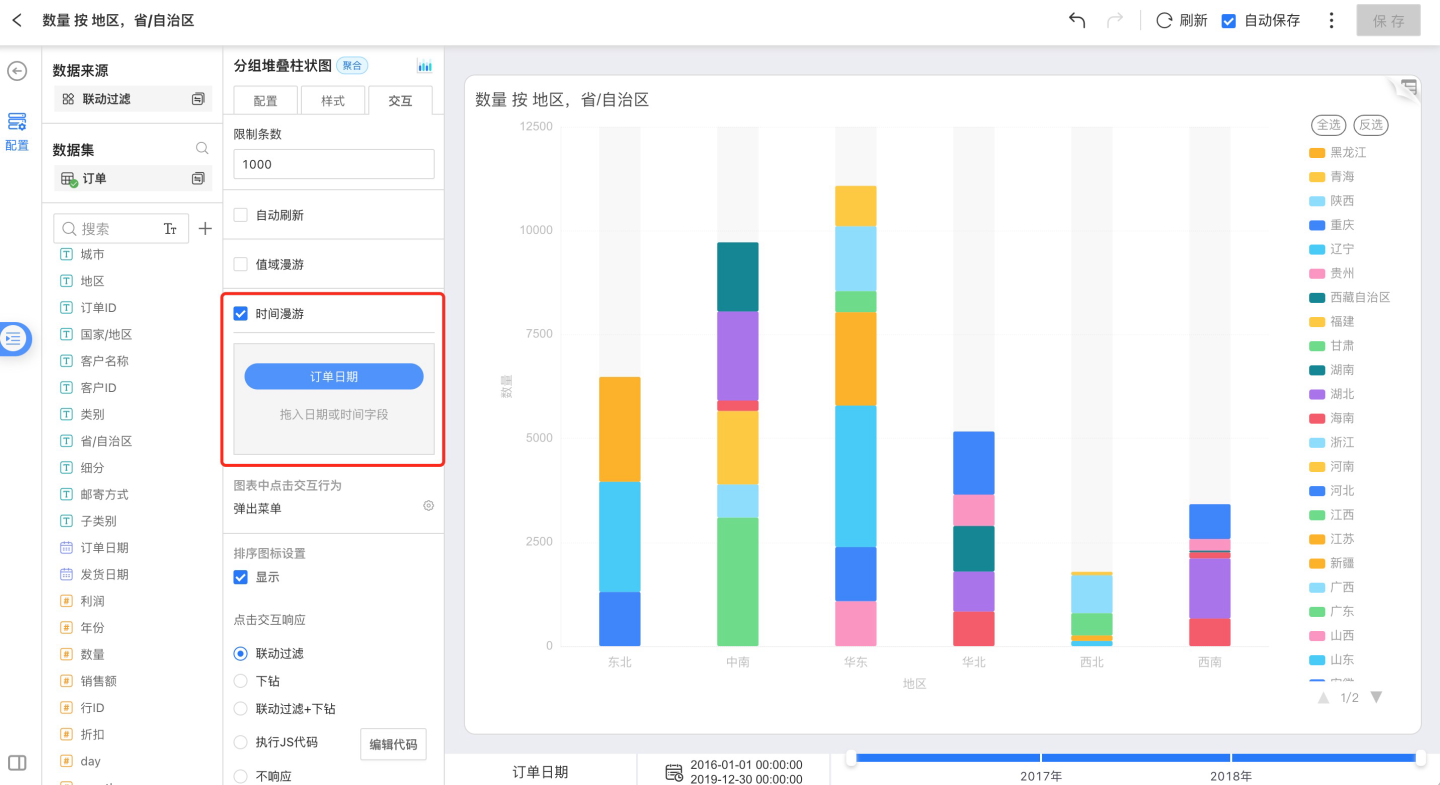
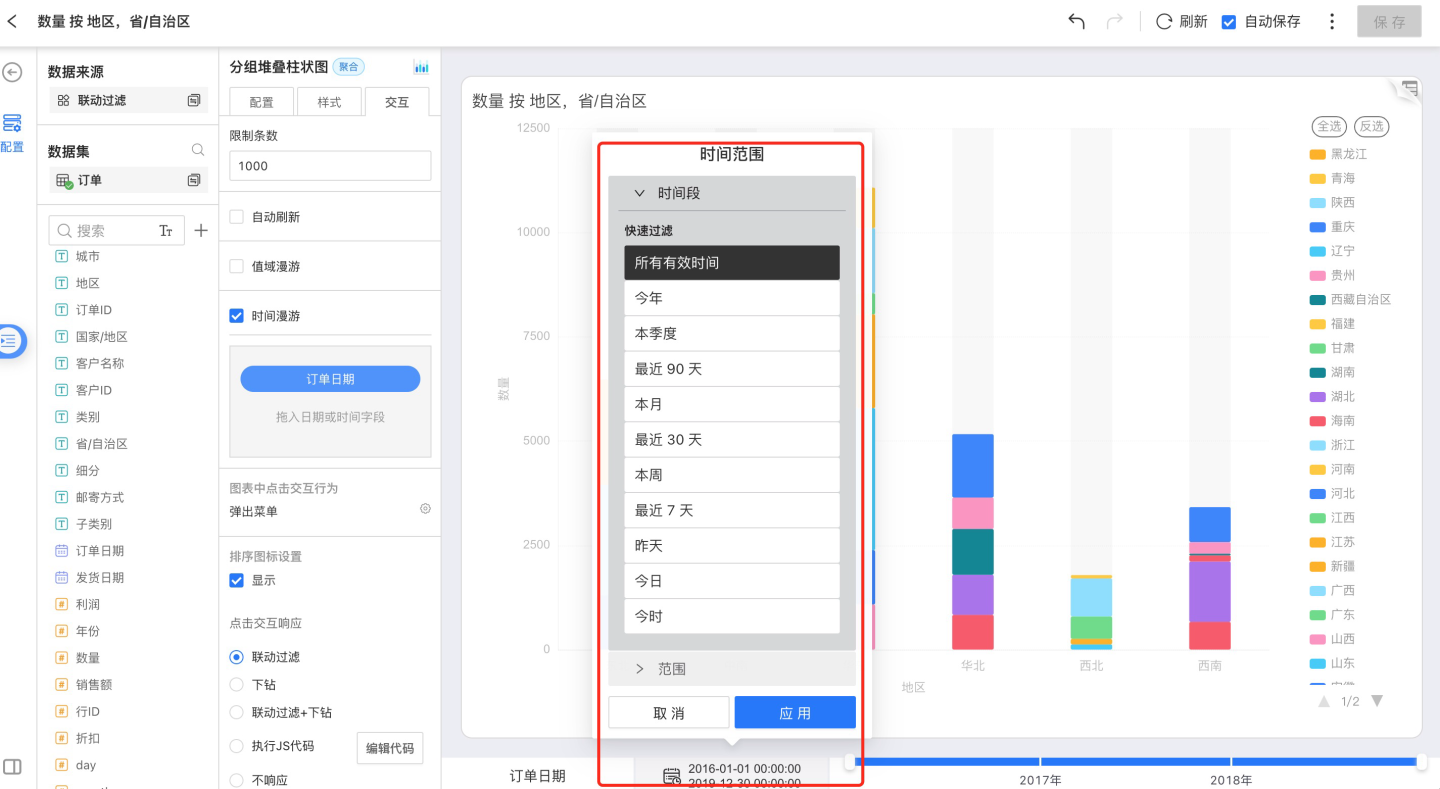
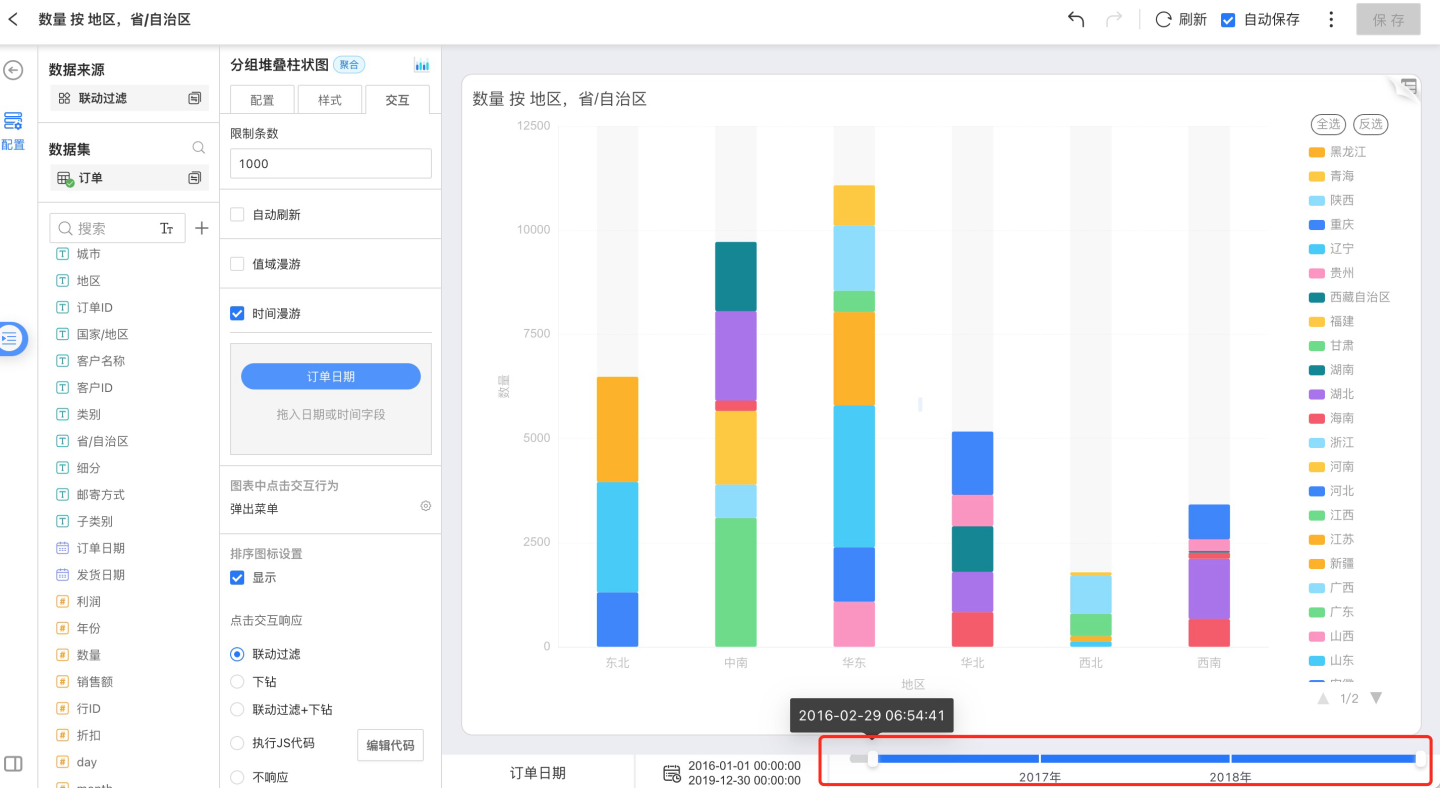
Time Roaming
Enable Show Time Roaming, and drag the time field from your dataset into the box. This will display a timeline on the chart interface, allowing you to easily drag and view data for different time ranges. The timeline can filter data in three ways:
Drag the timeline to filter data
Select a built-in time period to filter data
Select a custom time range to filter data
You can set a time range
You can drag the timeline to conveniently change the selected area
You can select a time period
- All valid times
- This year
- This quarter
- Last 90 days
- This month
- Last 30 days
- This week
- Last 7 days
- Yesterday
- Today
- This hour
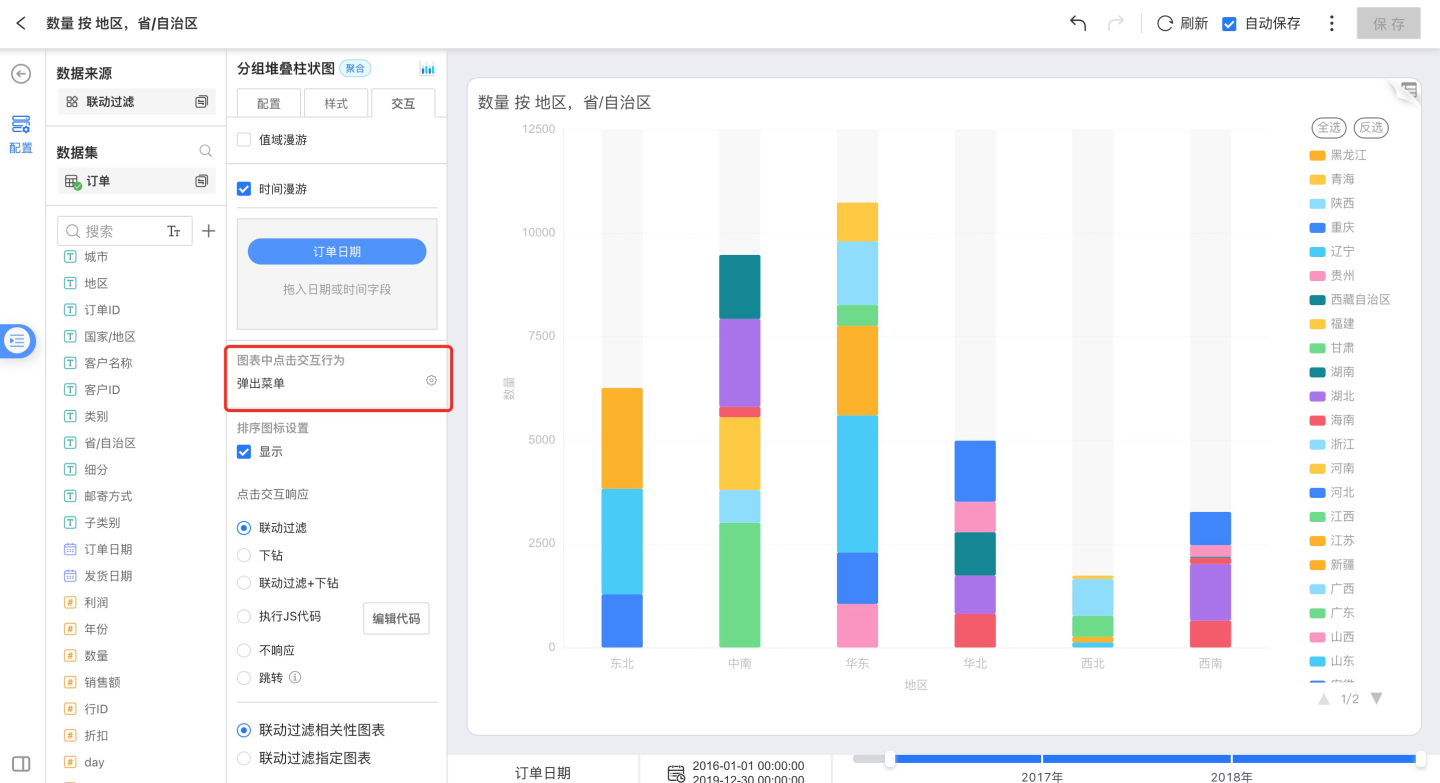
Click Interaction Behavior in Charts
For chart types that support drill-down and exclusion, see Appendix: Chart Type Summary. You can set three display modes for clicking on dimension groups:
- No Response
- Pop-up Menu
- Drill-down
No Response
When you open the chart and click on the chart area, there is no response.
Context Menu
Open the chart and click on the chart area. In the pop-up Tooltip menu, there are three actions: Drill Down, Exclude, and Details. 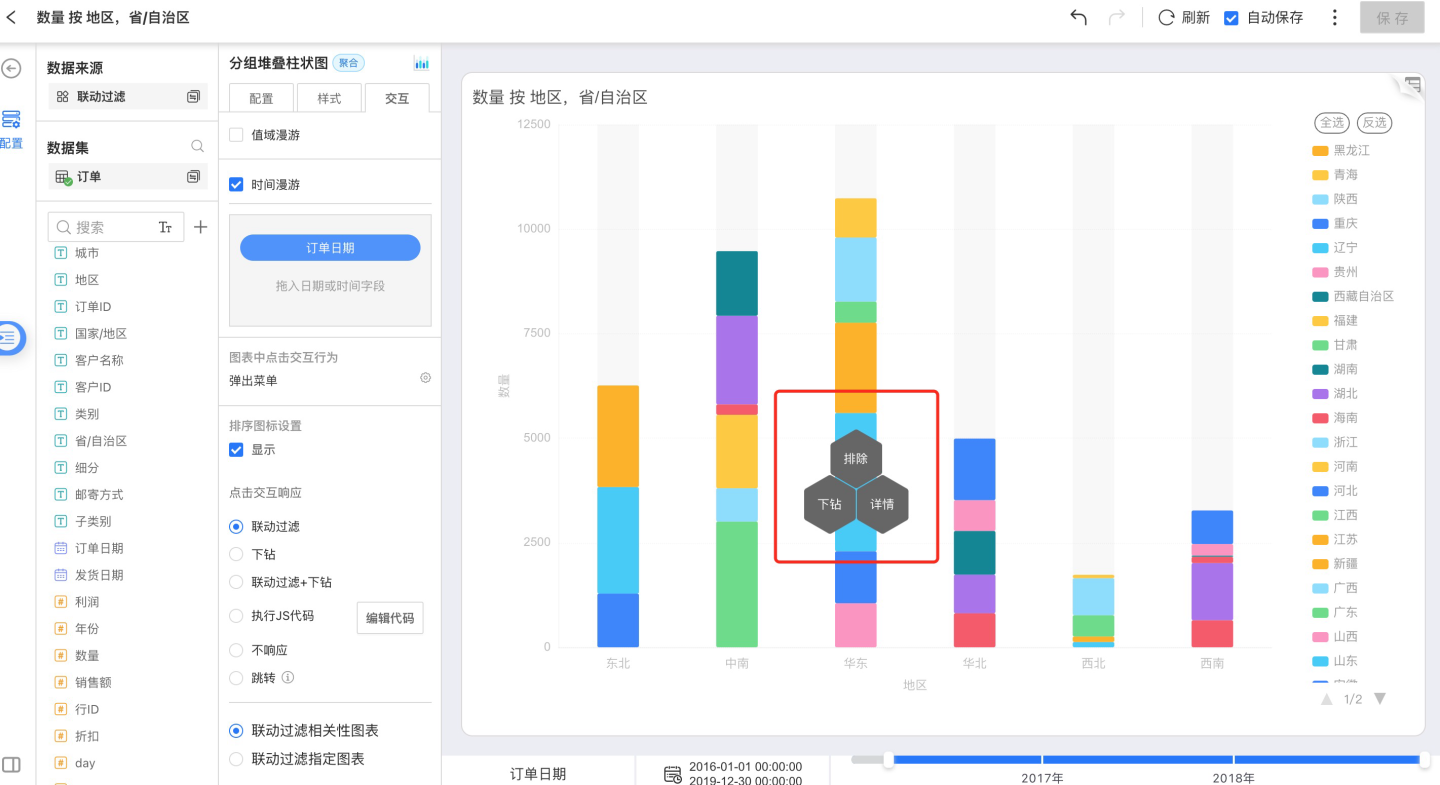
Drill Down
In charts that support drill down, click on a specific dimension in the chart and select Drill Down in the pop-up Tooltip. If a drill down path has been set, the chart will use the selected dimension as a filter and redraw the chart with the newly selected field as the dimension. You can drill down continuously. If no drill down path has been set, the drill down option will not be clickable.
Exclude
Click on a dimension in the chart, and select Exclude in the pop-up Tooltip. The chart will exclude the selected dimension group and display the remaining dimension groups.
Details
Click on a dimension in the chart, select Details in the pop-up Tooltip, and a new window will display the detailed data for the selected dimension group.
Drill Down
If a drill-down path is set, when you open the chart and click on the chart area, the chart will be redrawn using the selected dimension as a filter and the newly selected field as the dimension. If no drill-down path is set, there will be no response.
Drill Down Settings
In charts that support drill down, select a field and drag it into Interaction -> Drill Down Settings. Click on a dimension in the chart, and in the pop-up Tooltip menu, click Drill Down. The chart will use the selected dimension as a filter and redraw the chart with the newly selected field as the dimension. You can drill down continuously.
Drill down is only a temporary action and does not change the original dimensions of the chart. When you exit and reopen the chart, it will return to its original state.
You can also restore the chart by clicking the first field in the drill down path. 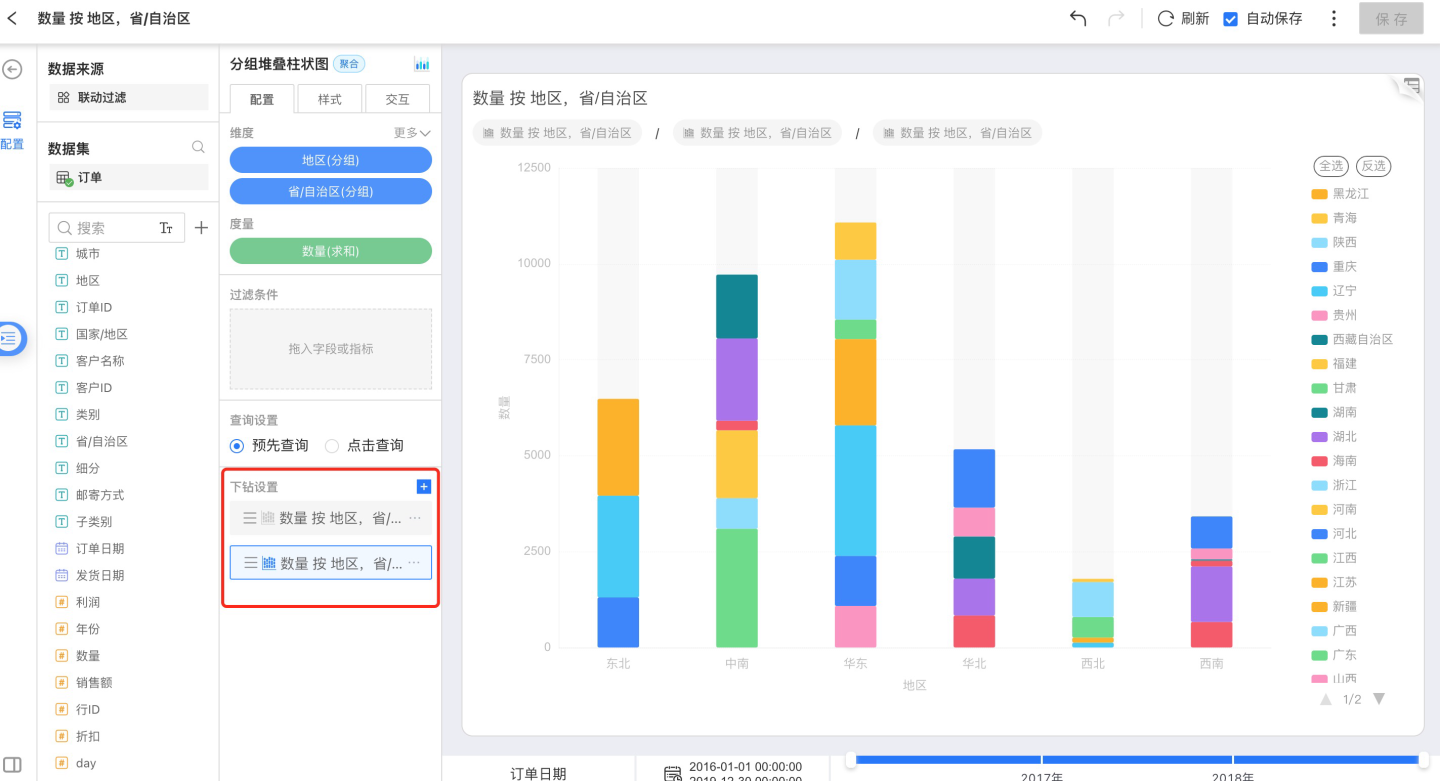
Setting the Chart After Drill-Down
You can configure this in both the Configuration and Style sections, just like with other charts.
Appendix: Chart Types Summary
- For each type of chart 📈—pie chart, line chart, scatter plot, area chart, bar chart, etc.—different fields for dimensions usually need to be configured, along with sort/limit options, filters, and more. The unified summary is as follows:
| Chart Type | Number of Dimensions | Number of Measures | Dimension Sorting | Drill Down | Legend | Legend Interaction | Chart Labels | Linked Filtering | Reference Line | Scale Range Setting | Exclude |
|---|---|---|---|---|---|---|---|---|---|---|---|
| Bar Chart | 1 | 1 | Data Source/Alphabetical/Field/Manual Sorting | Allowed | Default measure range | None | Measure Value | Dimension Grouping | Fixed/Calculated Value | Allowed | Dimension Grouping |
| Clustered Bar Chart | 1 | 1~N | Data Source/Alphabetical/Field/Manual Sorting | Allowed | Each measure | Single/Multiple Selection | Measure Value | Dimension Grouping | Fixed/Calculated Value | Allowed | Dimension Grouping |
| Grouped Clustered Bar Chart | 2 | 1 | Data Source/Alphabetical/Field/Manual Sorting | Allowed | Sub-dimension groups | Single/Multiple Selection | Measure Value | Primary Dimension Grouping | Fixed/Calculated Value | Allowed | Primary Dimension Grouping |
| Grouped Stacked Bar Chart | 2 | 1 | Data Source/Alphabetical/Field/Manual Sorting | Allowed | Sub-dimension groups | Single/Multiple Selection | Measure Value | Primary Dimension Grouping | Fixed/Calculated Value | Allowed | Primary Dimension Grouping |
| Percentage Grouped Stacked Bar Chart | 2 | 1 | Data Source/Alphabetical/Field/Manual Sorting | Allowed | Sub-dimension groups | Single/Multiple Selection | Measure Value | Primary Dimension Grouping | Fixed/Calculated Value | Allowed | Primary Dimension Grouping |
| Horizontal Bar Chart | 1 | 1 | Data Source/Alphabetical/Field/Manual Sorting | Allowed | Measure range | None | Measure Value | Dimension Grouping | Fixed/Calculated Value | Allowed | Dimension Grouping |
| Horizontal Clustered Bar Chart | 1 | 1~N | Data Source/Alphabetical/Field/Manual Sorting | Allowed | Each measure | Single/Multiple Selection | Measure Value | Dimension Grouping | Fixed/Calculated Value | Allowed | Dimension Grouping |
| Horizontal Stacked Bar Chart | 1 | 1~N | Data Source/Alphabetical/Field/Manual Sorting | Allowed | Each measure | Single/Multiple Selection | Measure Value | Dimension Grouping | Fixed/Calculated Value | Allowed | Dimension Grouping |
| Horizontal Percentage Stacked Bar Chart | 1 | 1~N | Data Source/Alphabetical/Field/Manual Sorting | Allowed | Each measure | Single/Multiple Selection | Measure Value | Dimension Grouping | Fixed/Calculated Value | Allowed | Dimension Grouping |
| Ring Bar Chart | 1 | 1 | None | Allowed | Dimension groups | Single/Multiple Selection | Measure Value | Dimension Grouping | Not Supported | Allowed | Dimension Grouping |
| Stacked Bar Chart | 1 | 1~N | Data Source/Alphabetical/Field/Manual Sorting | Allowed | Each measure | Single/Multiple Selection | Measure Value | Dimension Grouping | Fixed/Calculated Value | Allowed | Dimension Grouping |
| Percentage Stacked Bar Chart | 1 | 1~N | Data Source/Alphabetical/Field/Manual Sorting | Allowed | Each measure | Single/Multiple Selection | Measure Value | Dimension Grouping | Fixed/Calculated Value | Allowed | Dimension Grouping |
| Box Plot | 1 | 1 | Data Source/Alphabetical/Field/Manual Sorting | Allowed | Dimension groups | Single/Multiple Selection | None | Dimension Grouping | None | Allowed | Dimension Grouping |
| Waterfall Chart | 1 | 1 | Data Source/Alphabetical/Field/Manual Sorting | Allowed | Increase/Decrease | Single/Multiple Selection | Measure Value | Dimension Grouping | Fixed Value | Not Allowed | Dimension Grouping |
| Word Cloud | 1 | 1 | None | Allowed | Measure range | None | None | Dimension Grouping | None | Not Allowed | Dimension Grouping |
| Donut Chart | 1 | 1 | Data Source/Alphabetical/Field/Manual Sorting | Allowed | Dimension groups | Single/Multiple Selection | Dimension Group Percentage | Dimension Grouping | None | Not Allowed | Dimension Grouping |
| Funnel Chart | 1 | 1 | Data Source/Alphabetical/Field/Manual Sorting | Allowed | Dimension groups | Single/Multiple Selection | Dimension Group/Measure Value/Conversion Rate Between Groups | Dimension Grouping | None | Not Allowed | Dimension Grouping |
| Bubble Chart | 1~N | 1 | None | Allowed | Measure range | None | Dimension Group/Group Proportion | Combination of Dimension Groups | None | Not Allowed | Combination of Dimension Groups |
| Pie Chart | 1 | 1 | Data Source/Alphabetical/Field/Manual Sorting | Allowed | Dimension groups | Single/Multiple Selection | Dimension Group Percentage | Dimension Grouping | None | Not Allowed | Dimension Grouping |
| Nightingale Rose Chart | 1 | 1 | Data Source/Alphabetical/Field/Manual Sorting | Allowed | Dimension groups | Single/Multiple Selection | Dimension Group Percentage | Dimension Grouping | None | Not Allowed | Dimension Grouping |
| Sunburst Chart | 1~N | 1 | None | Allowed | None | Single/Multiple Selection | Groups of Each Dimension | Combination of Dimension Groups | None | Not Allowed | Combination of Dimension Groups |
| Treemap | 1~N | 1 | None | Allowed | Measure range | None | Dimension Group | Combination of Dimension Groups | None | Not Allowed | Combination of Dimension Groups |
| Area Chart | 1 | 1~N | Data Source/Alphabetical/Field/Manual Sorting | Allowed | Each measure | Single/Multiple Selection | Measure Value | Dimension Grouping | Fixed/Calculated Value | Allowed | Dimension Grouping |
| Grouped Area Chart | 2 | 1 | Data Source/Alphabetical/Field/Manual Sorting | Allowed | Sub-dimension groups | Single/Multiple Selection | None | Primary Dimension Grouping | Fixed/Calculated Value | Allowed | Primary Dimension Grouping |
| Grouped Stacked Area Chart | 2 | 1 | Data Source/Alphabetical/Field/Manual Sorting | Allowed | Sub-dimension groups | Single/Multiple Selection | Measure Value | Primary Dimension Grouping | Fixed/Calculated Value | Allowed | Primary Dimension Grouping |
| Percentage Grouped Stacked Area Chart | 2 | 1 | Data Source/Alphabetical/Field/Manual Sorting | Allowed | Sub-dimension groups | Single/Multiple Selection | Measure Value | Primary Dimension Grouping | Fixed/Calculated Value | Allowed | Primary Dimension Grouping |
| Stacked Area Chart | 1 | 1~N | Data Source/Alphabetical/Field/Manual Sorting | Allowed | Each measure | Single/Multiple Selection | None | Dimension Grouping | Fixed Value | Not Allowed | Dimension Grouping |
| Percentage Stacked Area Chart | 1 | 1~N | Data Source/Alphabetical/Field/Manual Sorting | Allowed | Each measure | Single/Multiple Selection | None | Dimension Grouping | Fixed Value | Not Allowed | Dimension Grouping |
| Line Chart | 1 | 1~N | Data Source/Alphabetical/Field/Manual Sorting | Allowed | Each measure | Single/Multiple Selection | Measure Value | Dimension Grouping | Fixed/Calculated Value | Allowed | Dimension Grouping |
| Combo Line-Bar Chart | 1 | 1~N | Data Source/Alphabetical/Field/Manual Sorting | Allowed | Each measure | Single/Multiple Selection | Measure Value | Dimension Grouping | Fixed/Calculated Value | Allowed | Dimension Grouping |
| Grouped Line Chart | 2 | 1 | Data Source/Alphabetical/Field/Manual Sorting | Allowed | Sub-dimension groups | Single/Multiple Selection | Measure Value | Primary Dimension Grouping | Fixed/Calculated Value | Allowed | Primary Dimension Grouping |
| Pareto Chart | 1 | 1 | None | Allowed | Frequency/Cumulative Frequency | Single/Multiple Selection | Measure Value | Dimension Grouping | Fixed/Calculated Value | Not Allowed | Dimension Grouping |
| Arc Relationship Chart | 2 | 0 | Data Source/Alphabetical/Field/Manual Sorting | Allowed | Sub-dimension groups | None | None | None | None | Not Allowed | None |
| Chord Diagram | 2 | 1 | Data Source/Alphabetical/Field/Manual Sorting | Allowed | Groups of Each Dimension | Hover Only | Groups of Each Dimension | None | None | Not Allowed | None |
| Heatmap | 2 | 1 | Data Source/Alphabetical/Field/Manual Sorting | Allowed | Measure range | None | Measure Value | Combination of Dimension Groups | None | Not Allowed | Combination of Dimension Groups |
| Radar Chart | 1 | 1~N | Data Source/Alphabetical/Field/Manual Sorting | Allowed | Each measure | Single/Multiple Selection | Dimension Group/Measure Value | Dimension Grouping | None | Allowed | None |
| Sankey Diagram | 1~N | 1 | Data Source/Alphabetical/Field/Manual Sorting | Allowed | None | None | Groups of Each Dimension | None | None | Not Allowed | None |
| Scatter Plot | 1 | 3 | None | Allowed | Size measure range | None | Dimension Groups | Dimension Grouping | Fixed/Calculated Value | Allowed (setting only, not merging) | Dimension Grouping |
| Gauge | 0 | 2 | None | Not Allowed | None | None | Name/Number/Percentage of Proportion Measure | None | Fixed Value | Not Allowed | None |
| KPI | 0 | 1~N | None | Not Allowed | None | None | None | None | None | Not Allowed | None |
| Metric Trend Card | 1 | 1~N | None | Not Allowed | None | None | None | None | None | Not Allowed | None |
| Table | 0~N | 0~N | Data Source/Alphabetical/Field/Manual Sorting | Not Allowed | None | None | None | None | None | Not Allowed | None |