Chart Overview
Chart controls help data professionals perform instant data exploration and analysis, enabling more efficient discovery of hidden information within the data. The system brings together various types of charts, mainly categorized into KPI, Bar Chart, Line Chart, Relationship Chart, Donut Chart, Area Chart, Map, Table, and Custom Chart.
Chart Examples
Below are examples of charts supported by the platform.
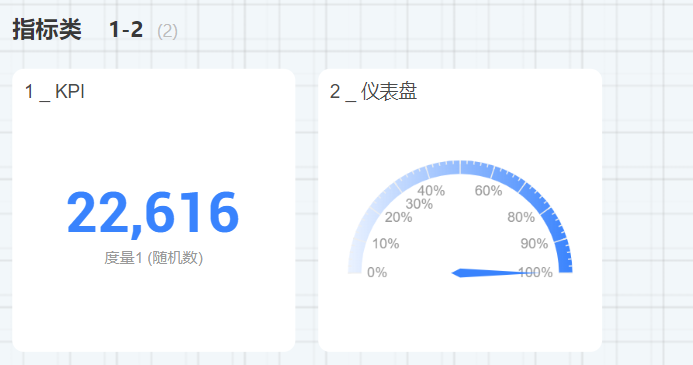
Metric Charts
Metric charts include KPIs and dashboards.
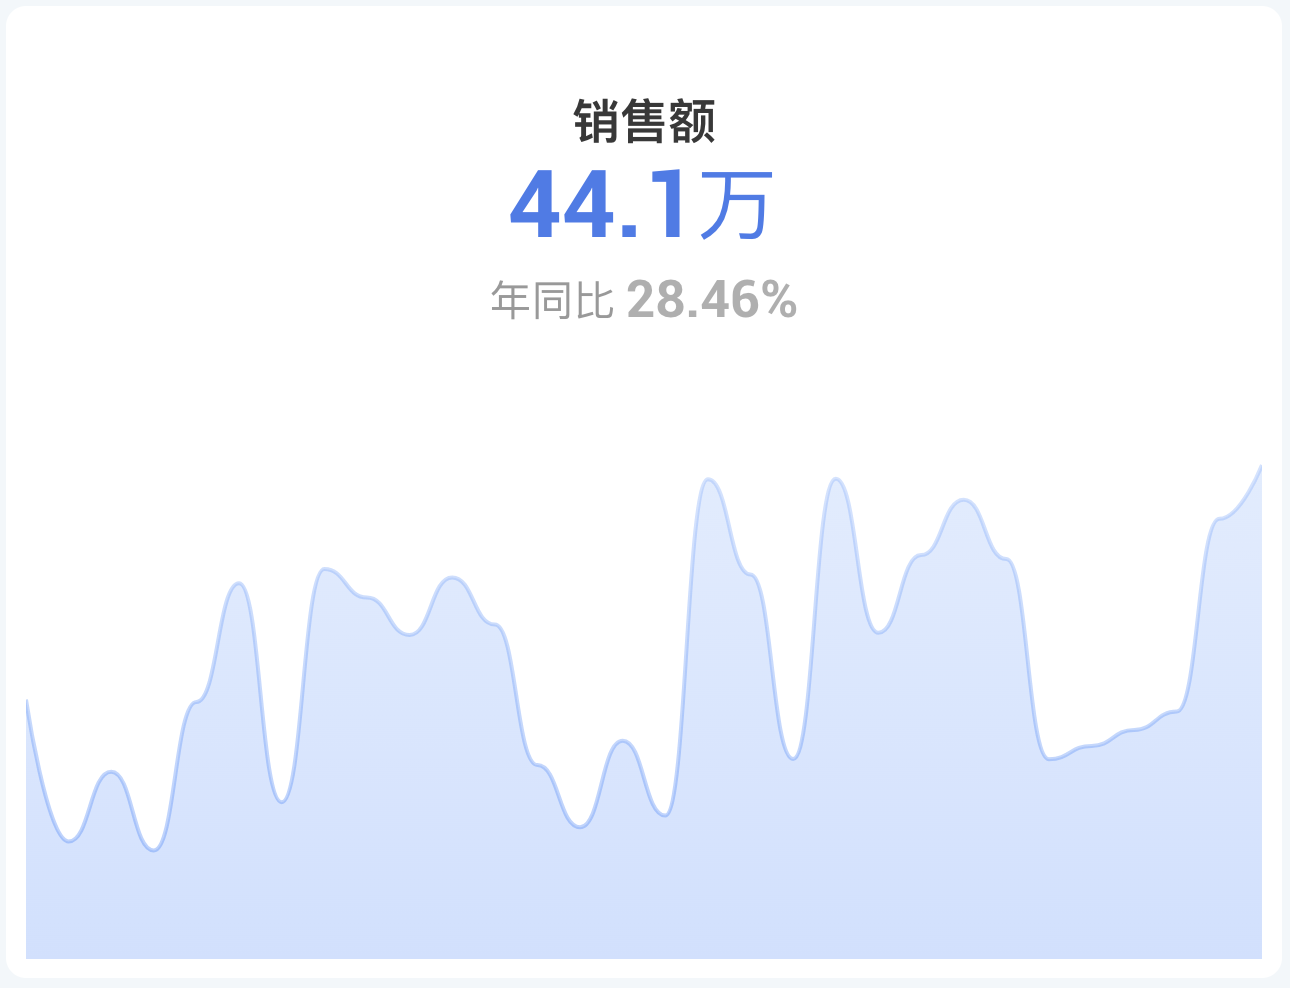
The metric trend card allows you to view the overall value of a metric while also displaying its time trend.
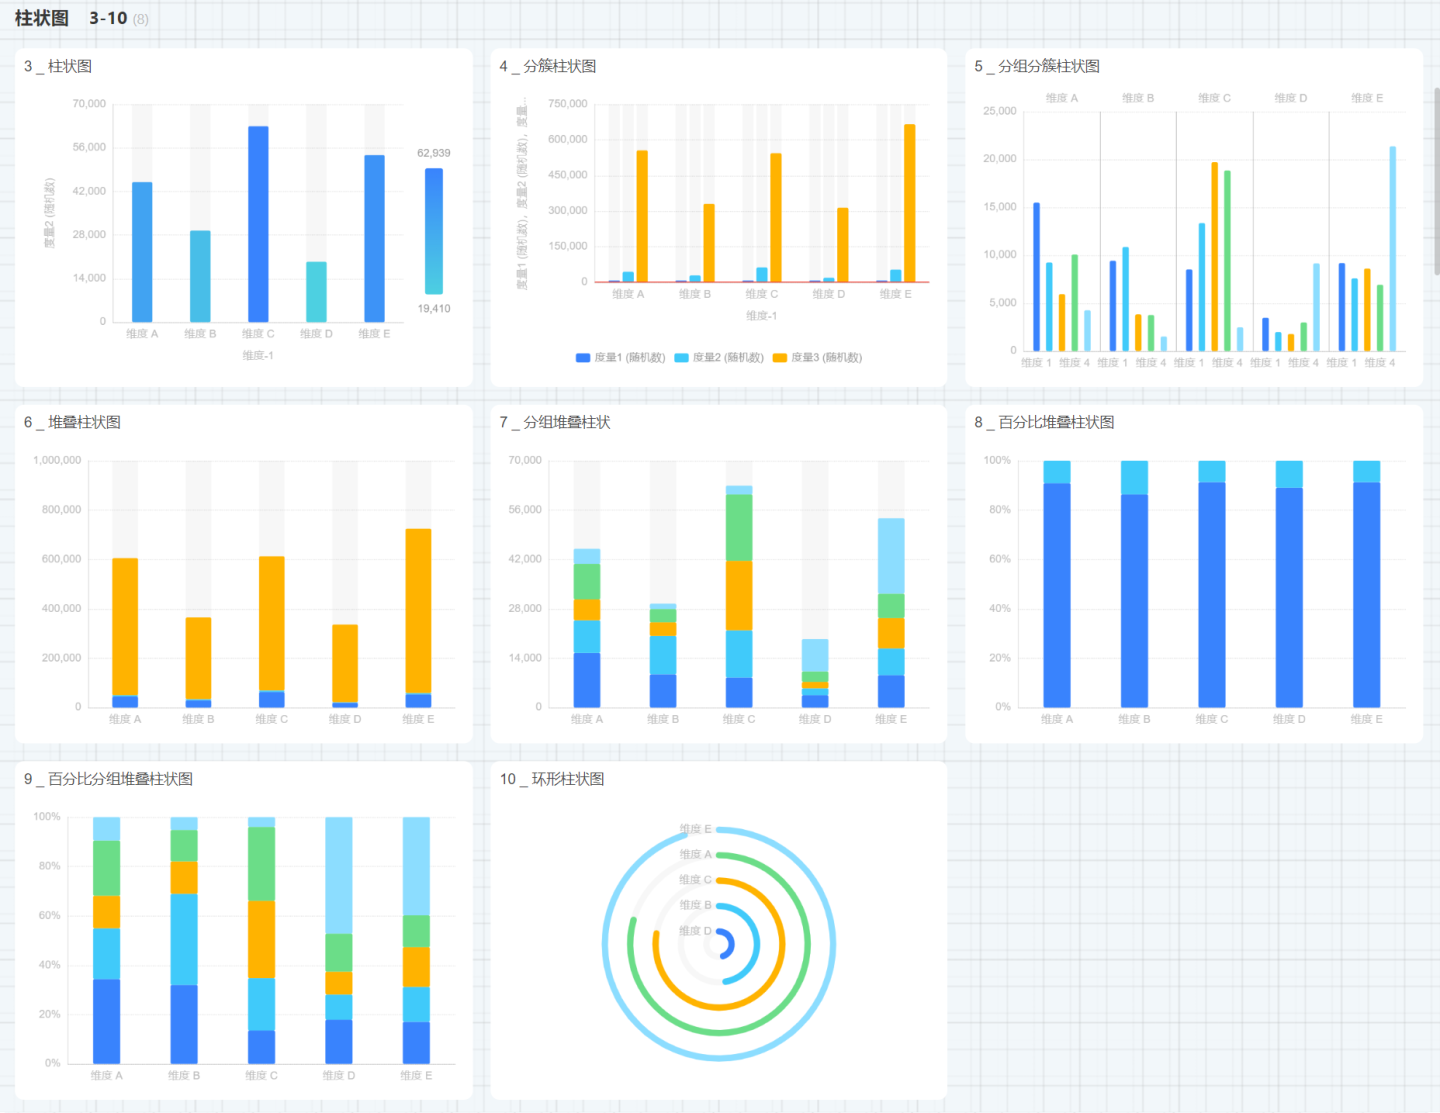
Bar Chart
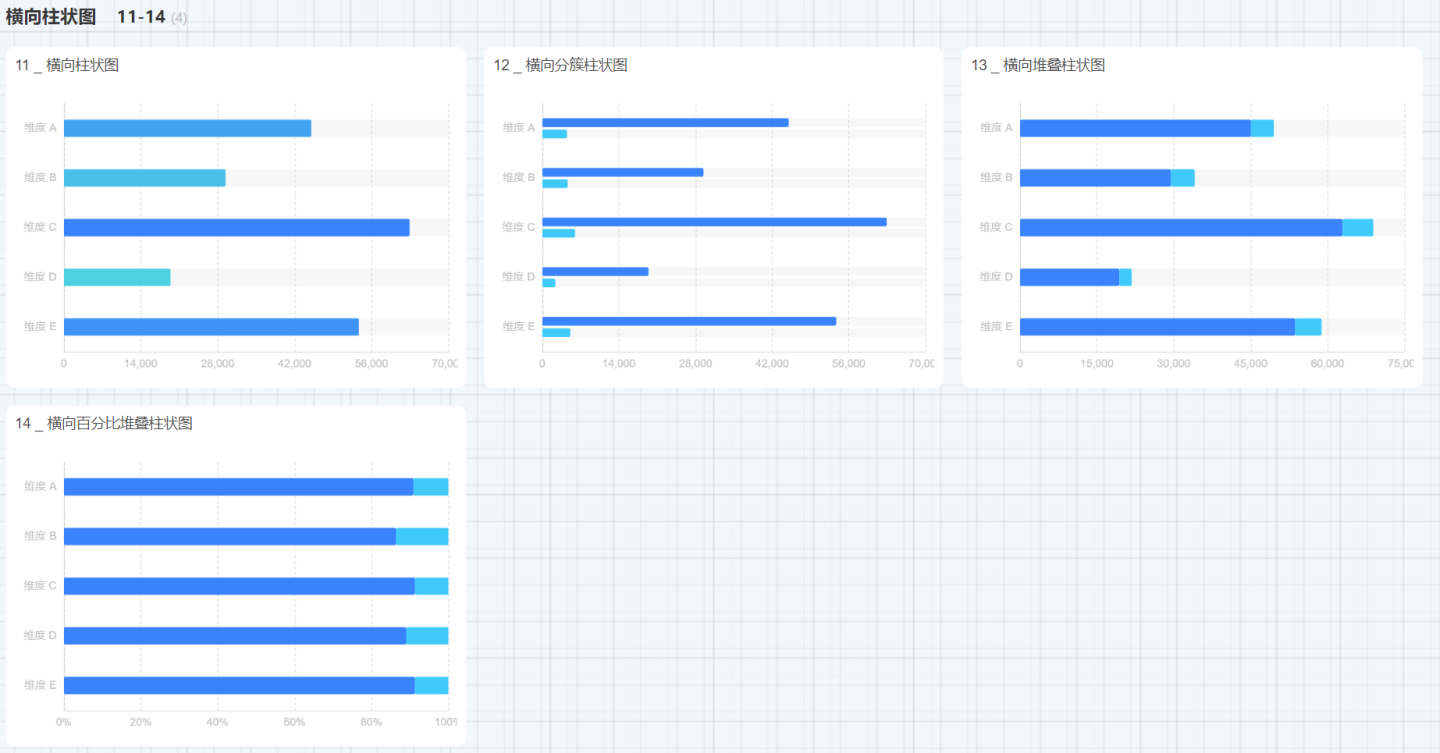
Bar chart types include Bar Chart, Clustered Bar Chart, Grouped Clustered Bar Chart, Stacked Bar Chart, Grouped Stacked Bar Chart, 100% Stacked Bar Chart, 100% Grouped Stacked Bar Chart, and Ring Bar Chart.
Additionally, there are Horizontal Bar Chart, Horizontal Clustered Bar Chart, Horizontal Stacked Bar Chart, and Horizontal 100% Stacked Bar Chart.
Donut Chart
Donut chart types include donut charts, pie charts, Nightingale charts, and sunburst charts. 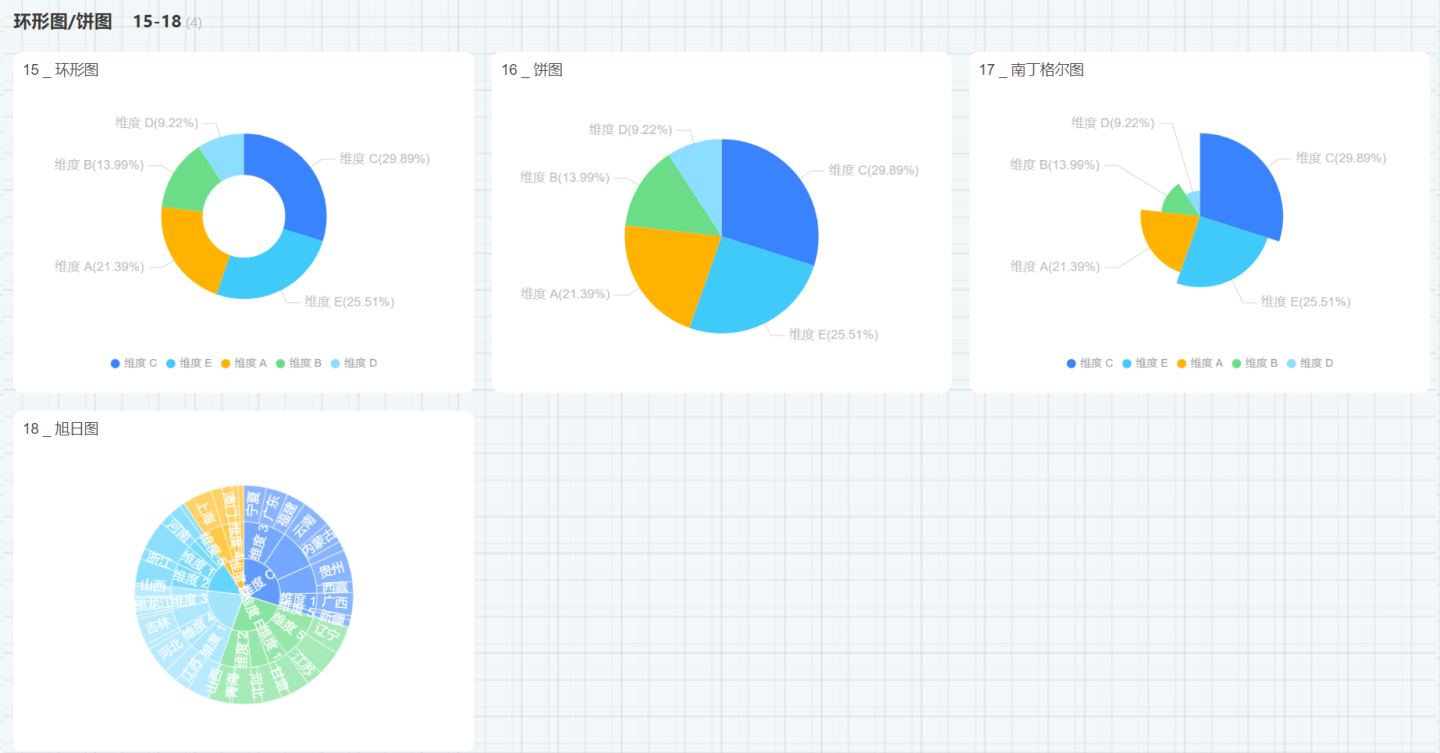
The label display for donut charts, pie charts, and Nightingale charts supports line break configuration. By default, this option is not selected. When the label information displayed on the chart is extensive, you can enable this option. 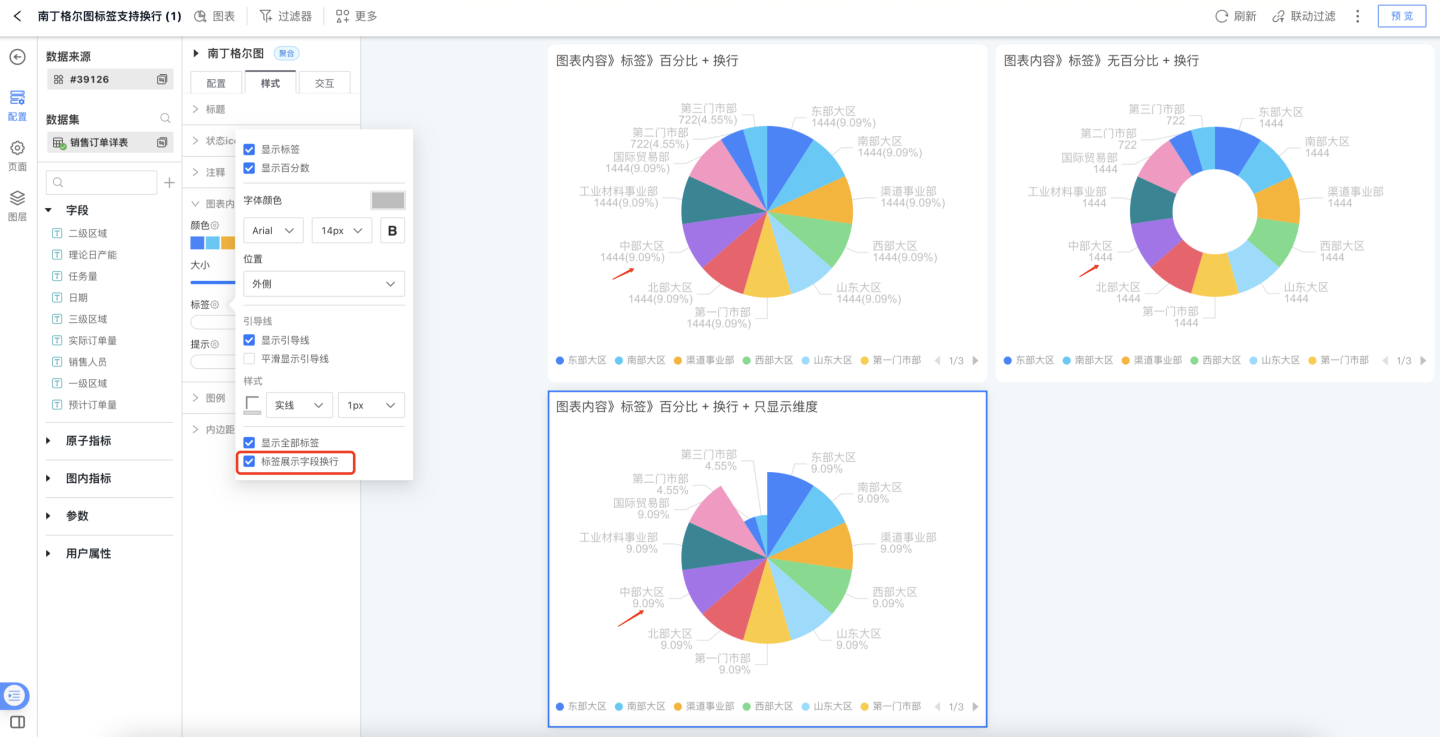
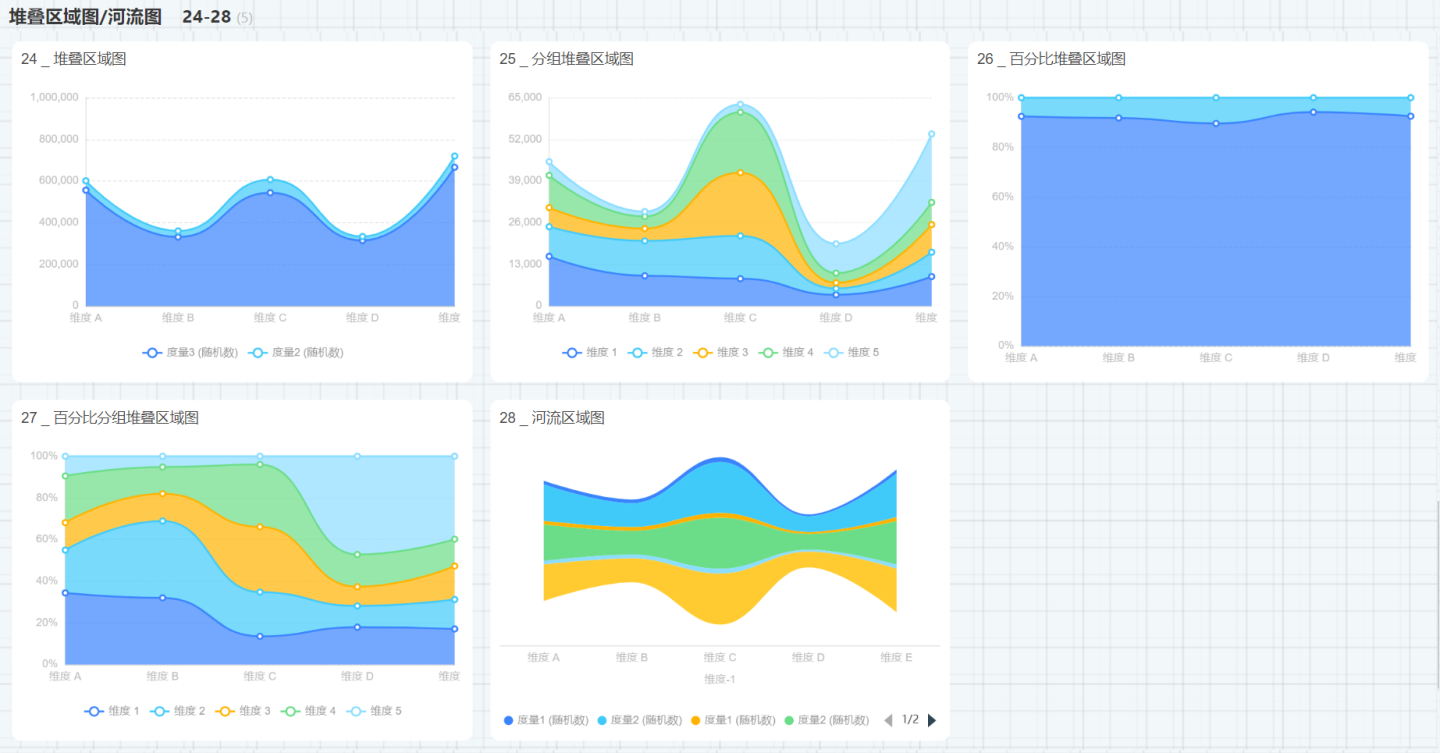
Line Area Charts
The line area chart category includes line charts, line-bar charts, grouped line charts, area charts, grouped area charts, stacked area charts, grouped stacked area charts, percent stacked area charts, percent grouped stacked area charts, and stream area charts. 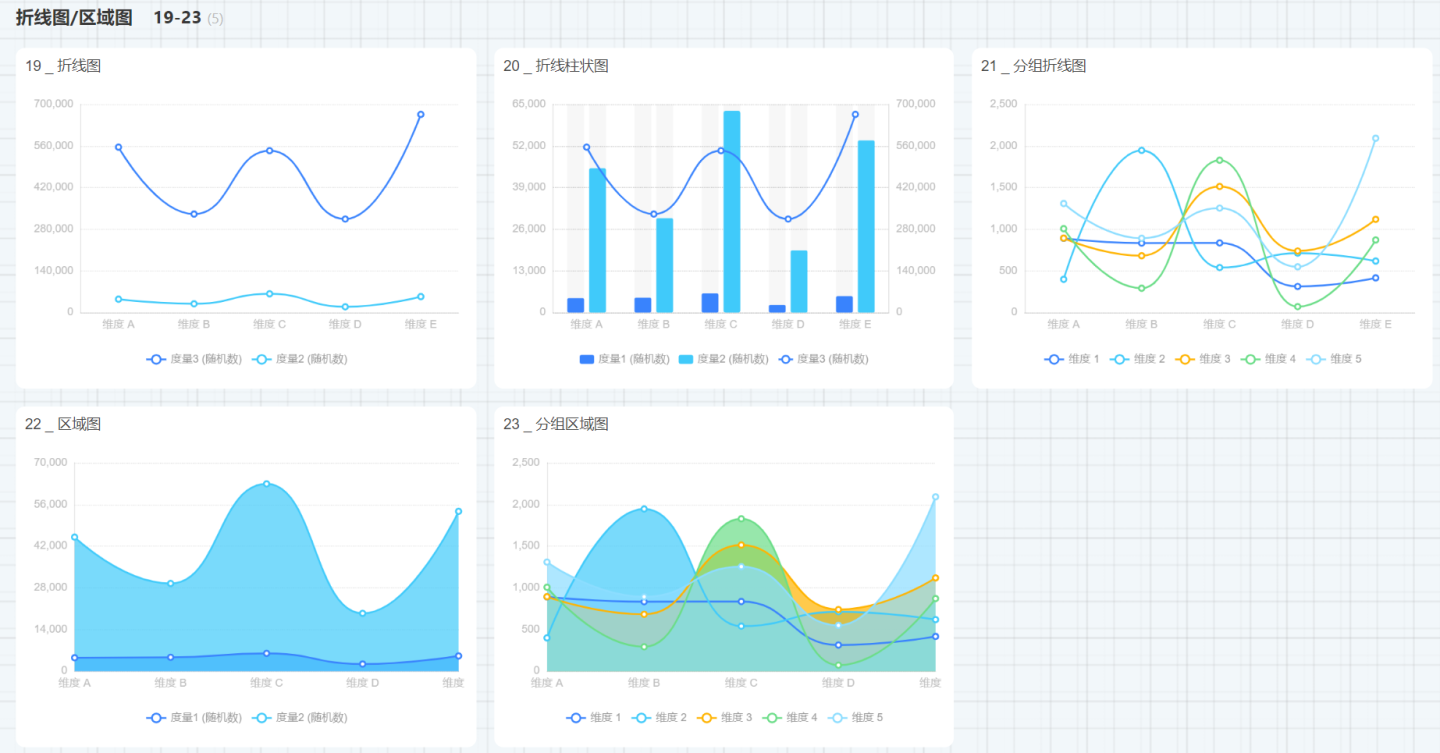
Relationship Charts
Relationship charts include Arc Diagram, Funnel Chart, Heatmap, Radar Chart, Sankey Diagram, Chord Diagram, and Scatter Plot. 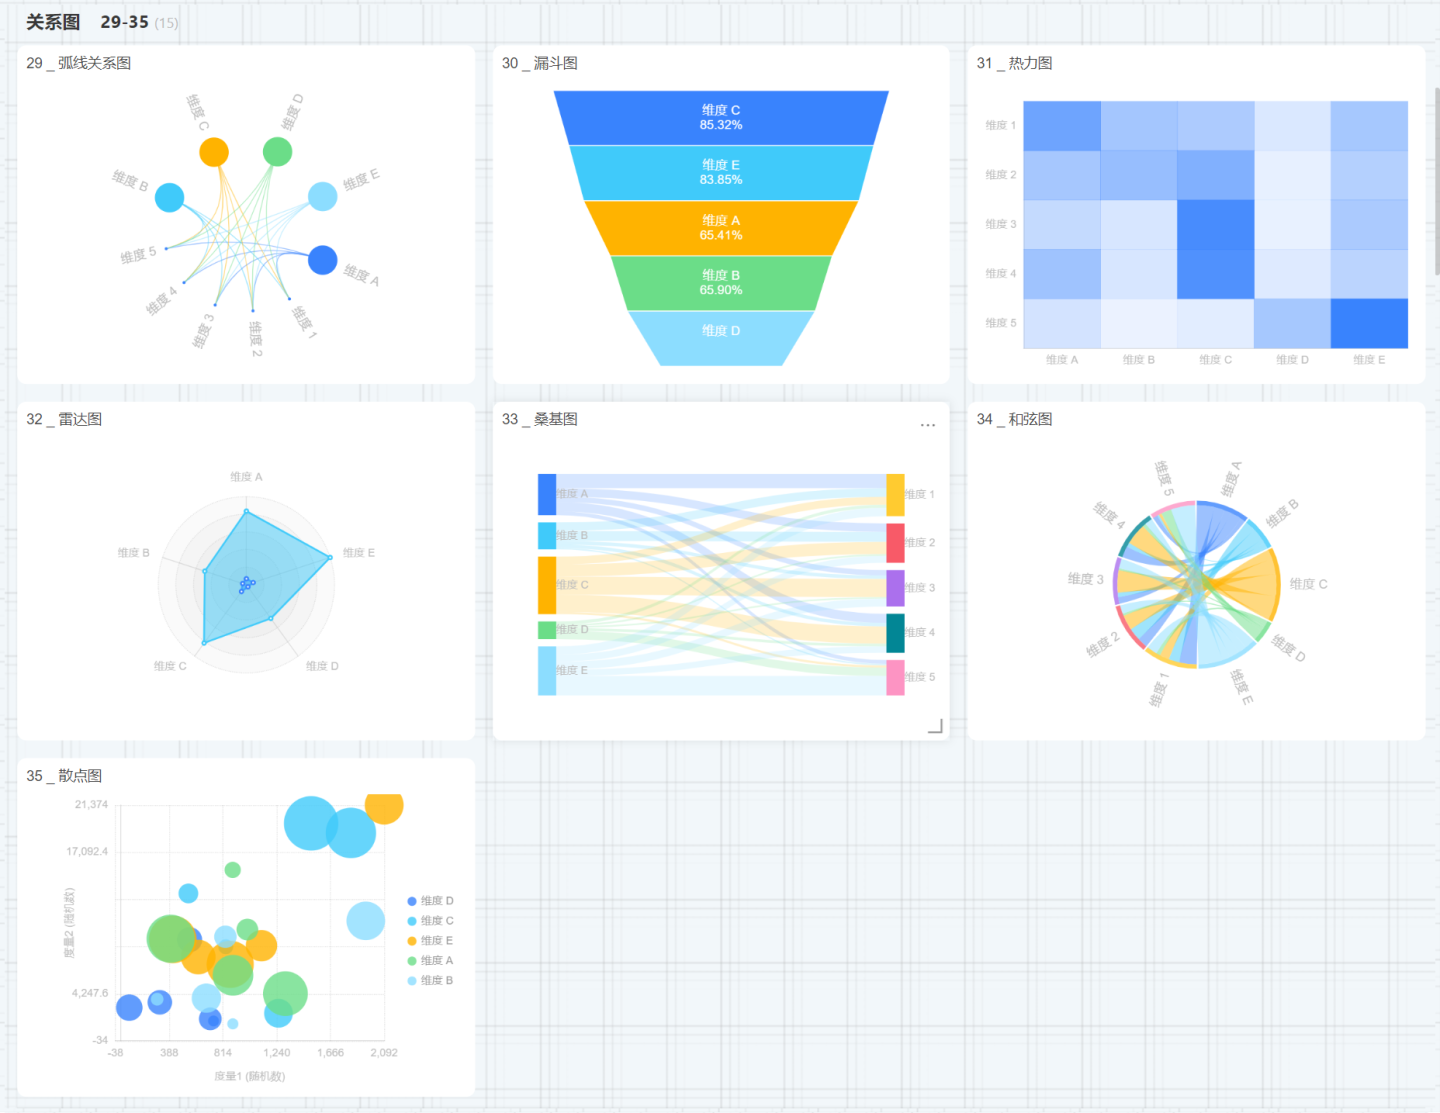
Others
Other types of charts include process charts, tree maps, treemaps, waterfall charts, word clouds, box plots, Pareto charts, and bubble charts. 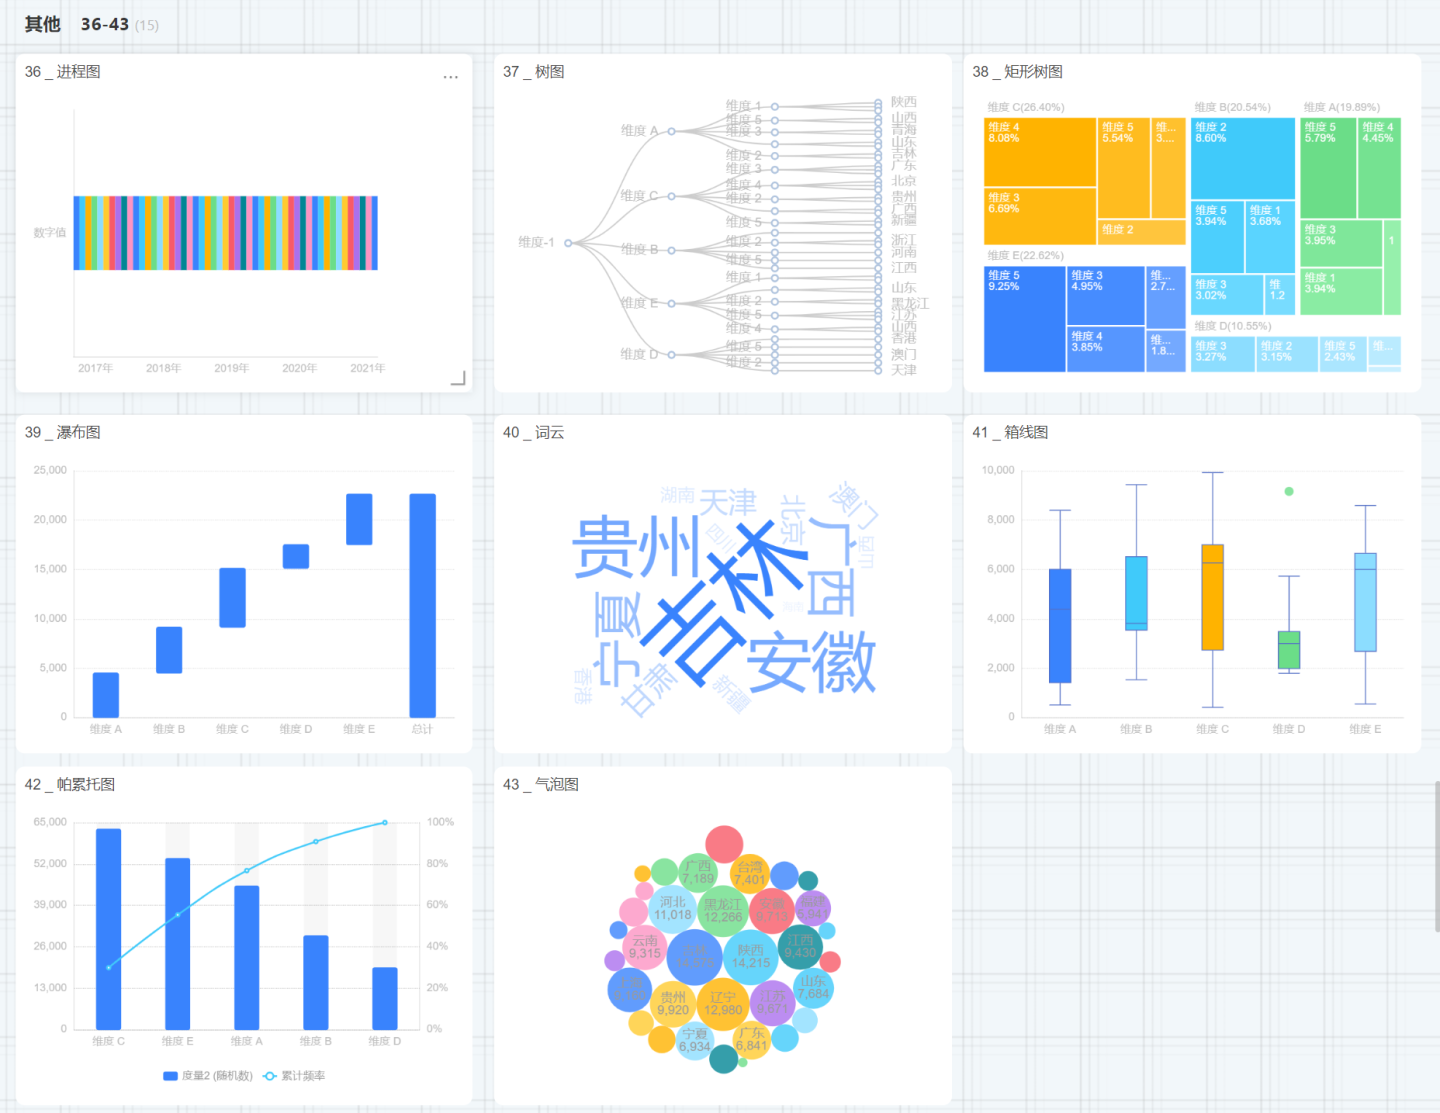
Map
Map charts include Simple Map and Layered Map. 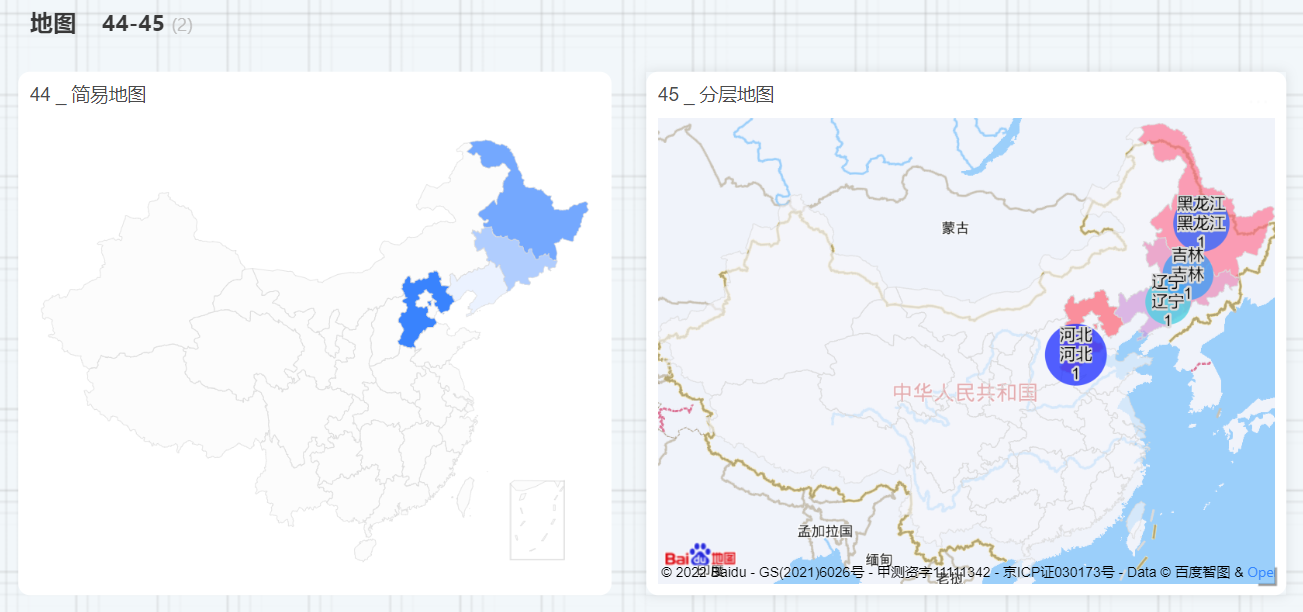
Table
Table-type charts include Table, Dataset Table, Crosstab, Canvas Table, etc. 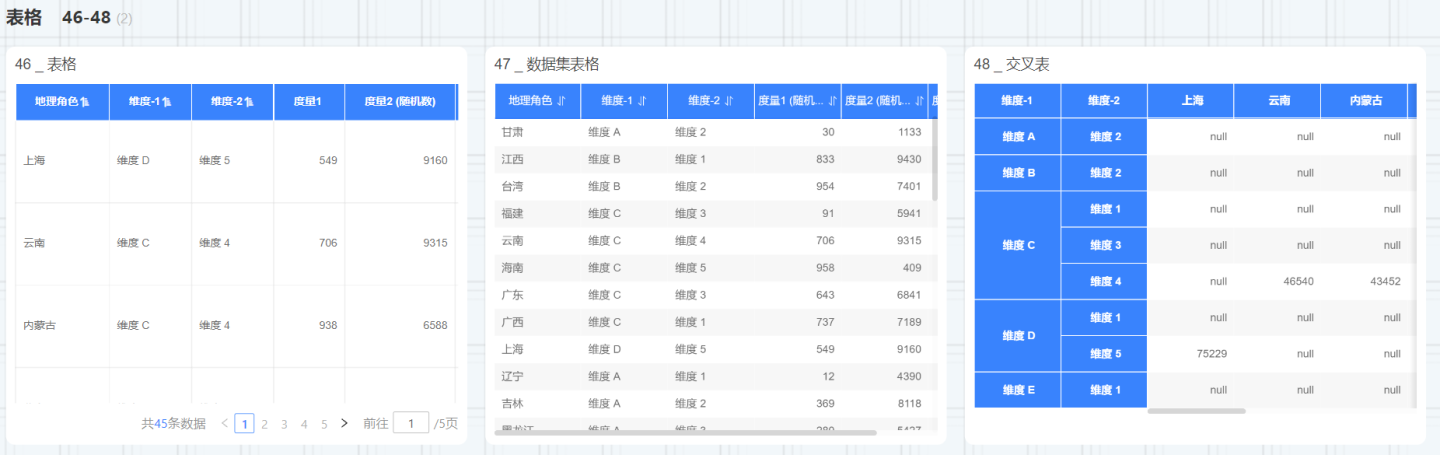
Combo Chart
A combo chart allows you to add any number of axes and multiple chart elements.
Custom Chart
Custom charts are implemented by writing JS code, which is different from other charts. 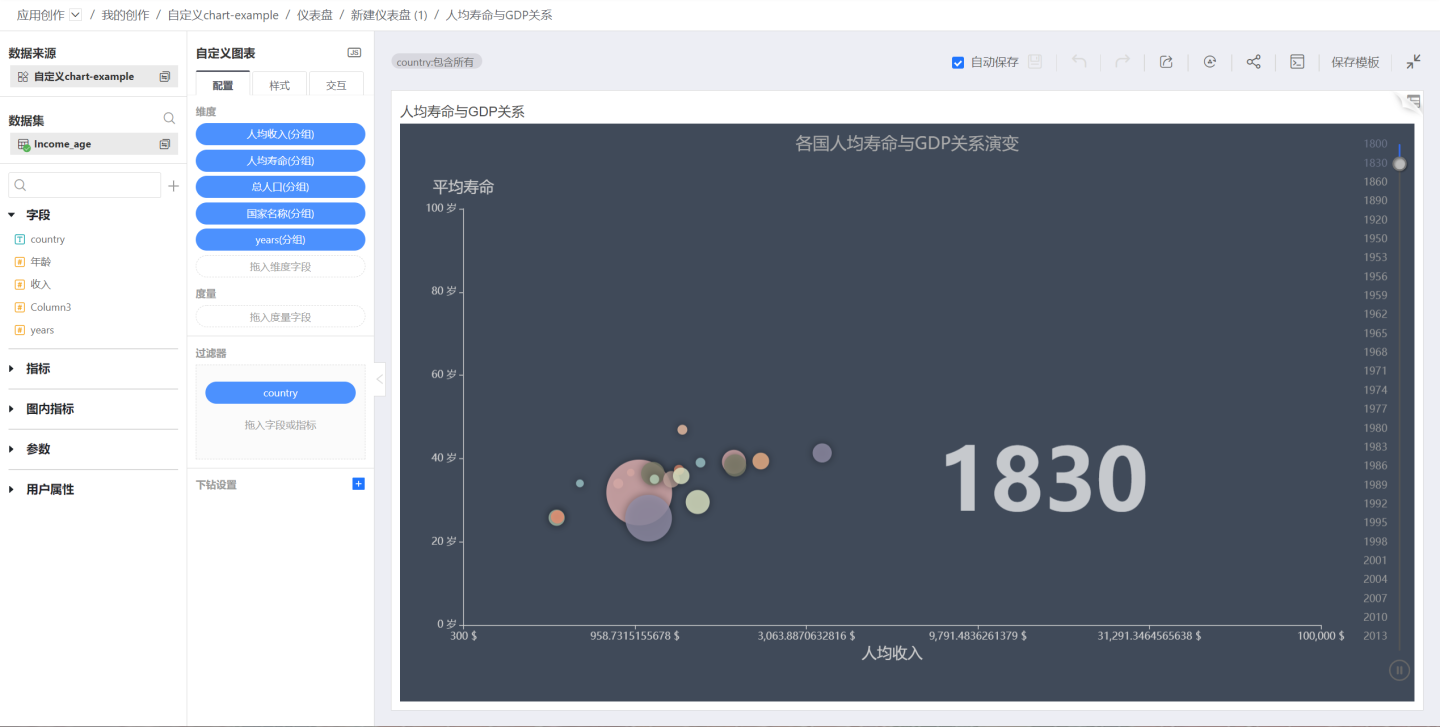
Chart Data
Chart Data Query Methods
When displaying chart data, two different query methods are supported: aggregate query and detail query. As shown in the student grade table, after dragging the student name and grade data into the table, using an aggregate query can display the student's name and total grade. Using a detail query displays the student's name and detailed grades. 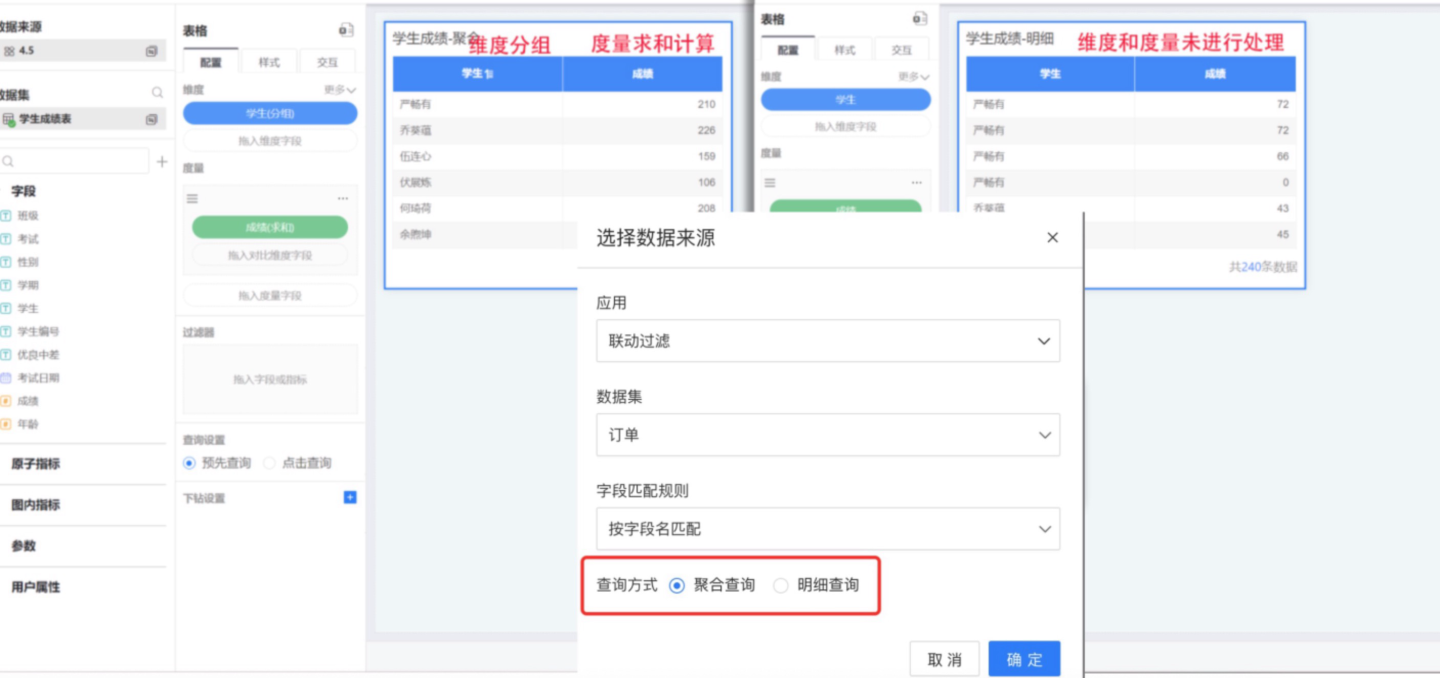
Aggregate Query: Data is displayed in the chart in an aggregated form. For example, dimension fields are automatically grouped, date dimension fields support displaying by year, month, or day, dimension fields support merging items and setting display values, and measure fields support various advanced calculations.
Detail Query: Data is displayed in the chart as detailed records. Dimension fields do not support grouping, and measure fields cannot perform any calculations.
Note
The query method is set when creating the chart. Each chart can only select one query method, and this configuration cannot be changed after it is set.
Field Calculation Methods
Drag fields into the dimensions and measures of a chart to display relevant business information. In aggregation query mode, fields in the chart can be set using either calculation or expression editing.
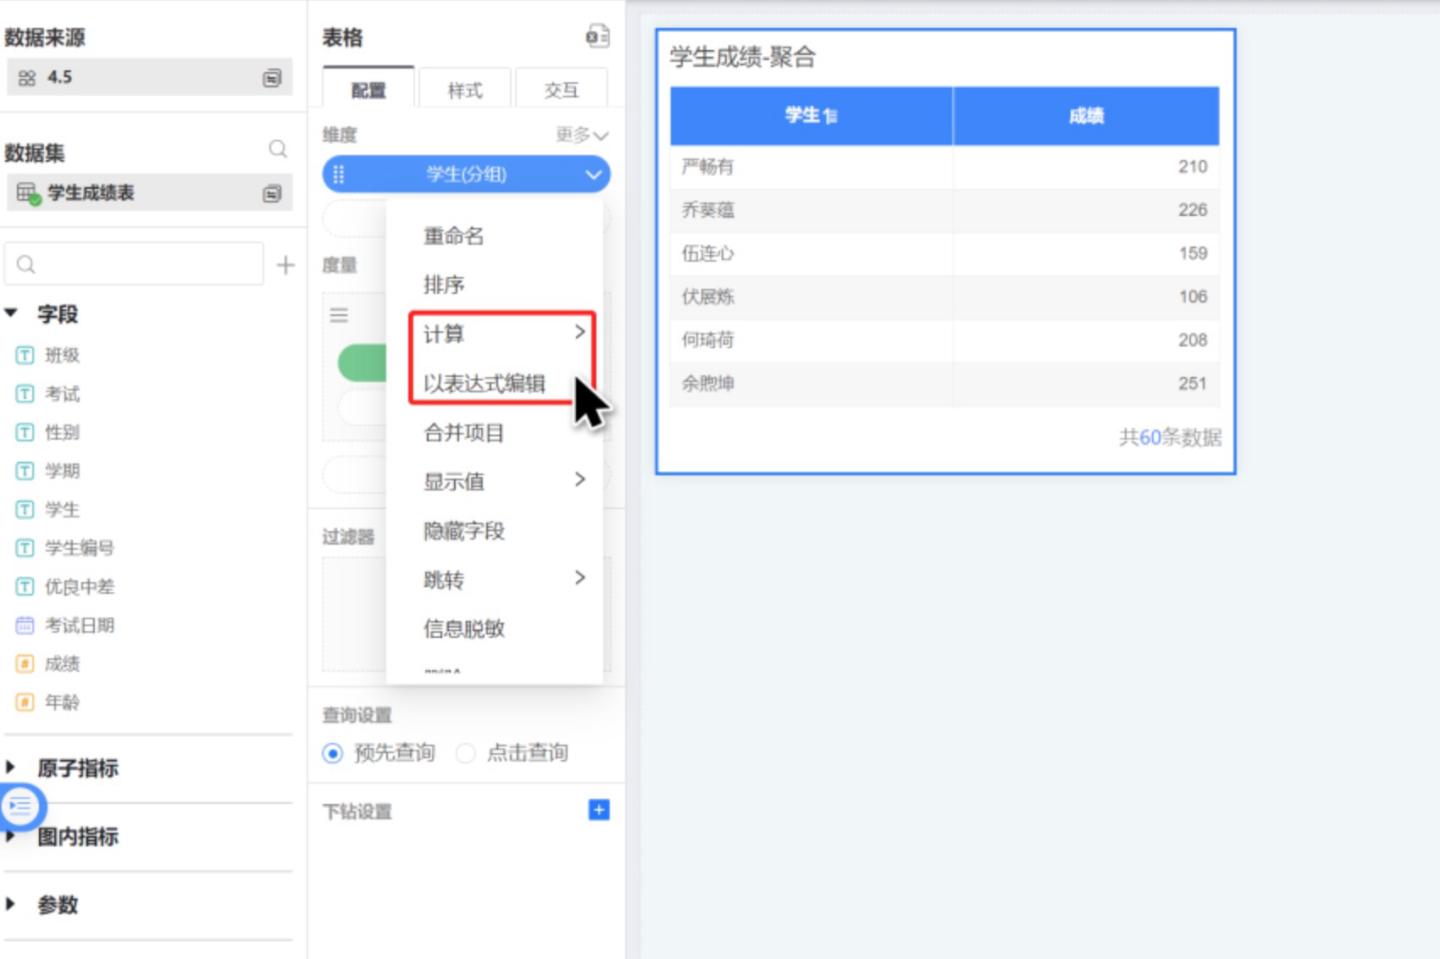
Field Calculation
Field calculation refers to the system's built-in methods for handling dimensions and measures. For example, dimension fields are automatically grouped, and date dimension fields support selecting different time display formats. For measure fields, you can choose calculation methods such as sum, year-over-year, etc.For details, see Dimension Calculation, Measure Calculation
Field Expression Editing
When the system's built-in dimension and measure handling methods do not meet user requirements, users can use expressions to calculate and process fields. Click "Edit as Expression" to use functions in the interface to edit fields.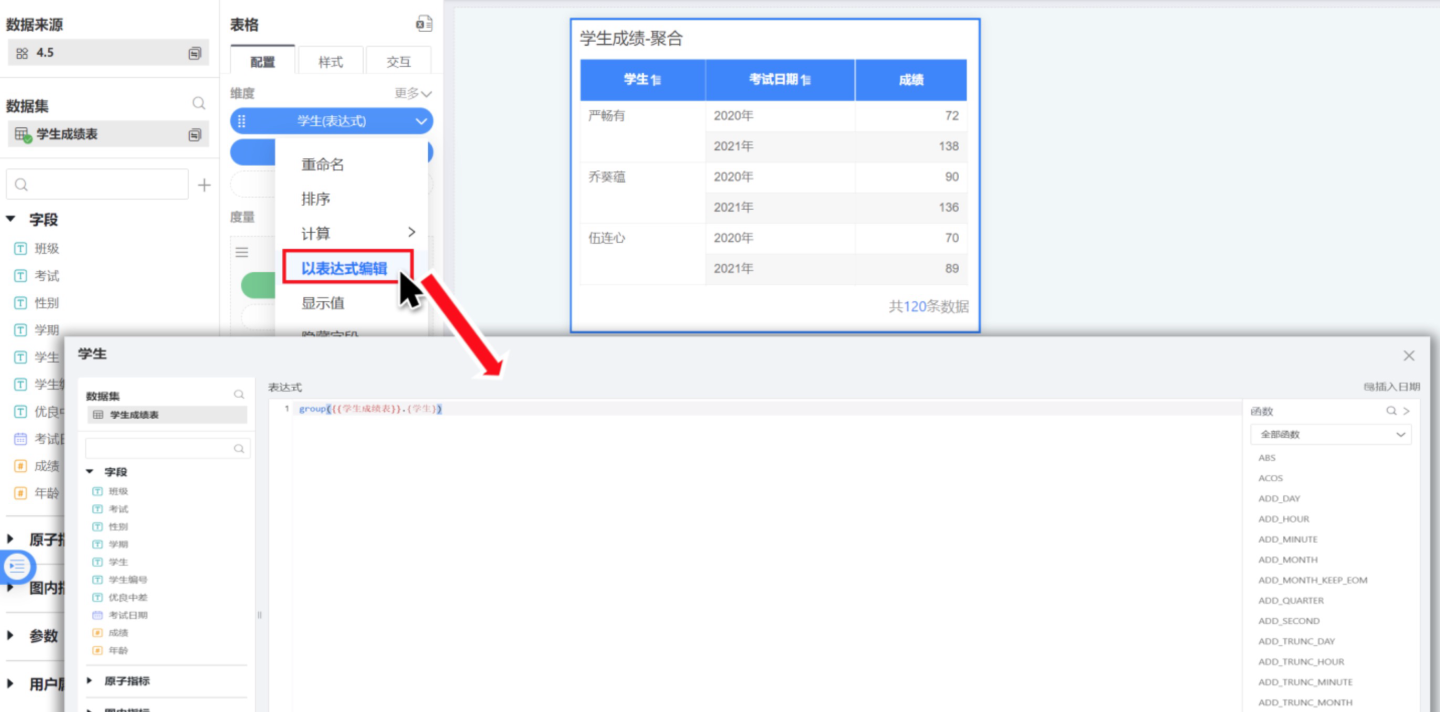
Chart Data Query Settings
When the chart data is large, loading times can be lengthy, which may affect the display performance on the dashboard due to extended rendering times. To address this, a query settings feature has been added to charts, allowing users to load data only when needed.
- Pre-query: Chart data is loaded directly when the dashboard is displayed.
- Click-to-query: Data is not loaded when the dashboard is displayed; data is loaded only after clicking to enable it.
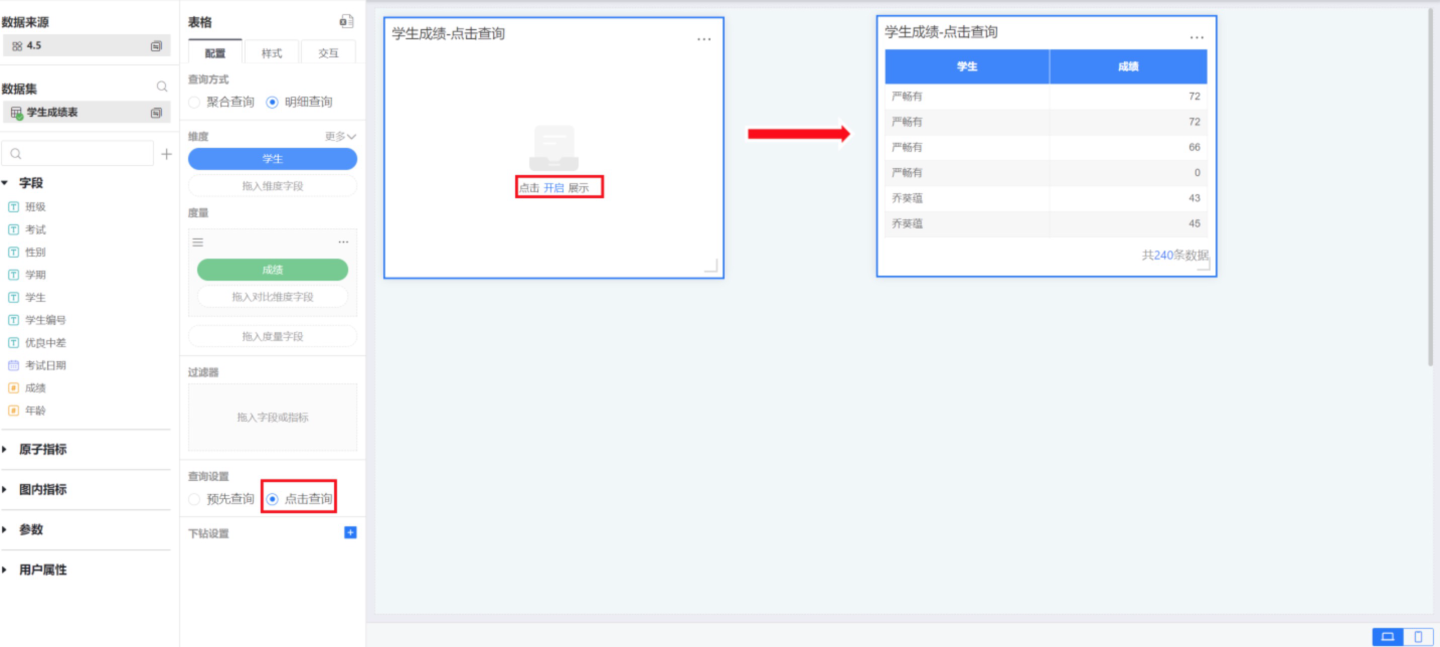
Chart Data Switching
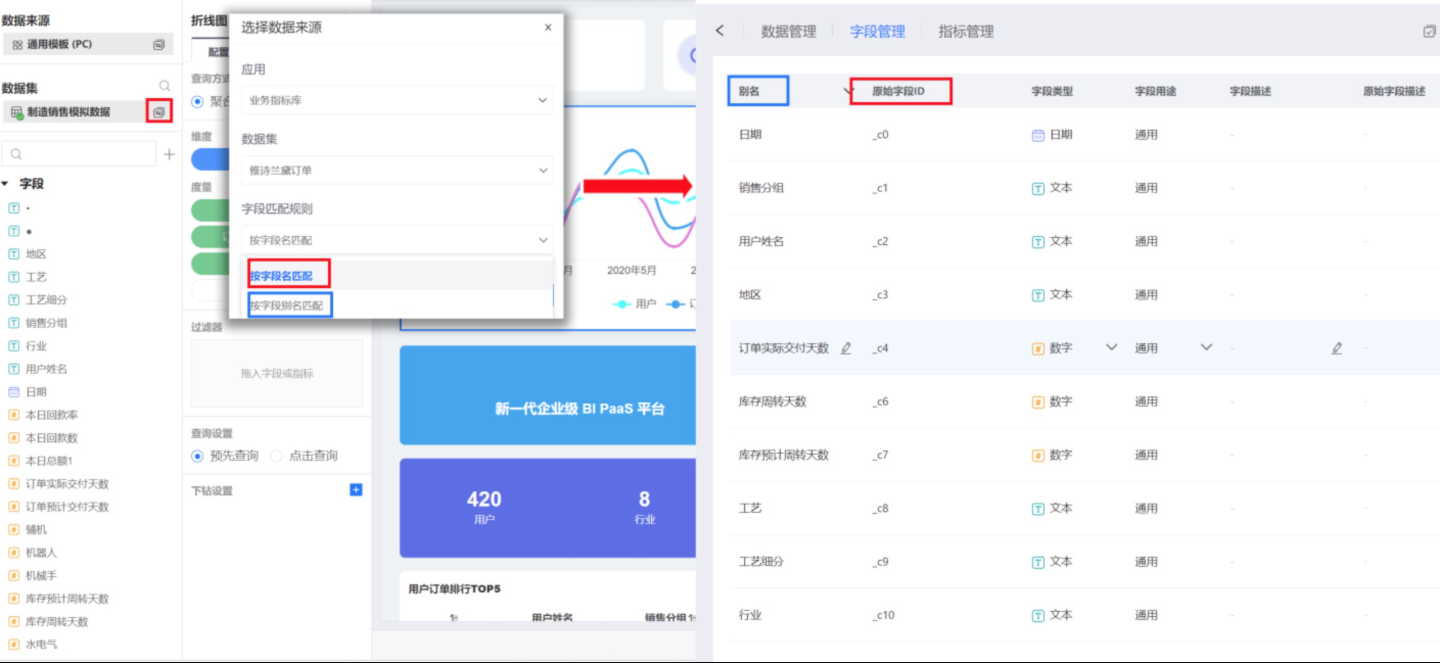
After a chart is generated, you can switch its data source. If the new data source contains the same fields, the chart can be generated directly. If there are no matching fields, the system will fail to match them, and you will need to manually select fields from the new data source and drag them into the chart's dimensions and measures. Once all required fields are added, the chart will be generated based on the new data.
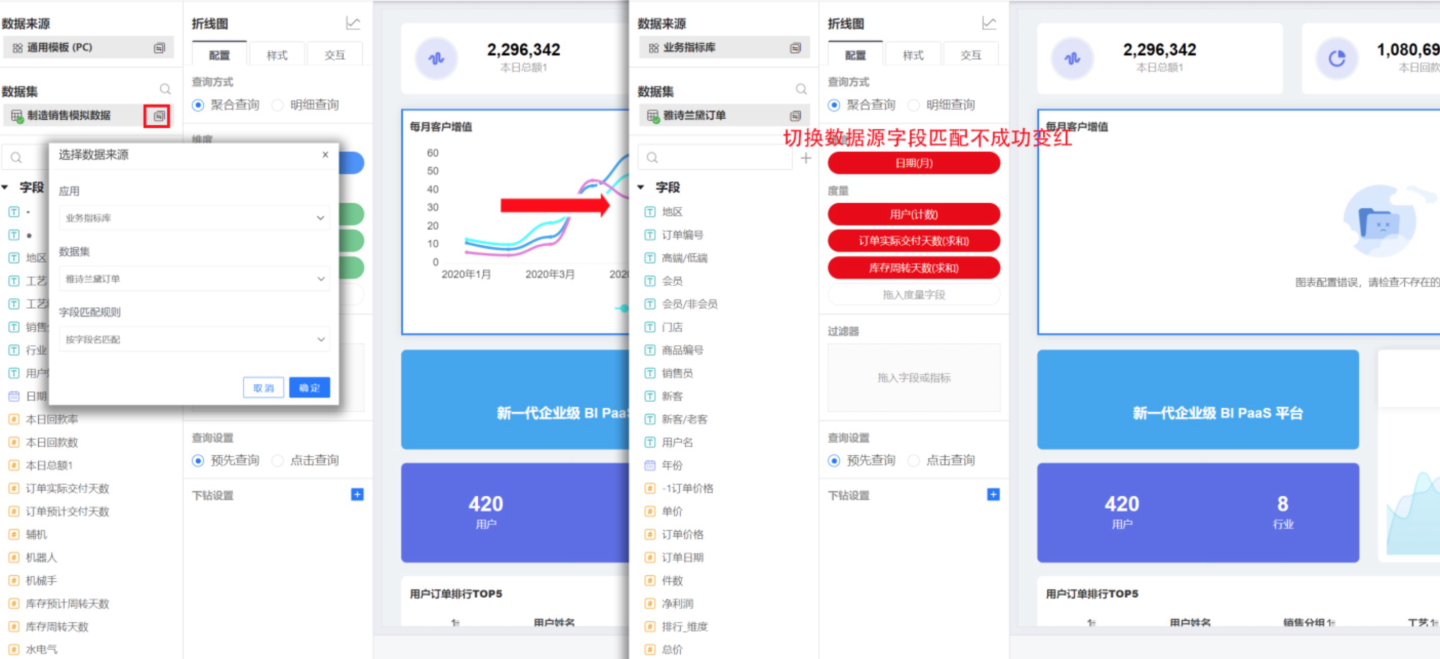
In addition to selecting the data source, chart data switching also supports choosing field matching rules. You can match fields by field name or by alias, providing flexible matching methods and improving the field matching rate.
During the chart data switching process, only the data is replaced; the original chart style settings and interaction settings remain unchanged.
Common Chart Operations
Chart widgets differ from other widgets in that they support opening operations and allow interactions within the chart. You can enter the chart by clicking the open button in the three-dot menu of the chart widget.
When a chart is opened, it supports features such as auto-save, undo, redo, export, refresh, embed, and view SQL code.
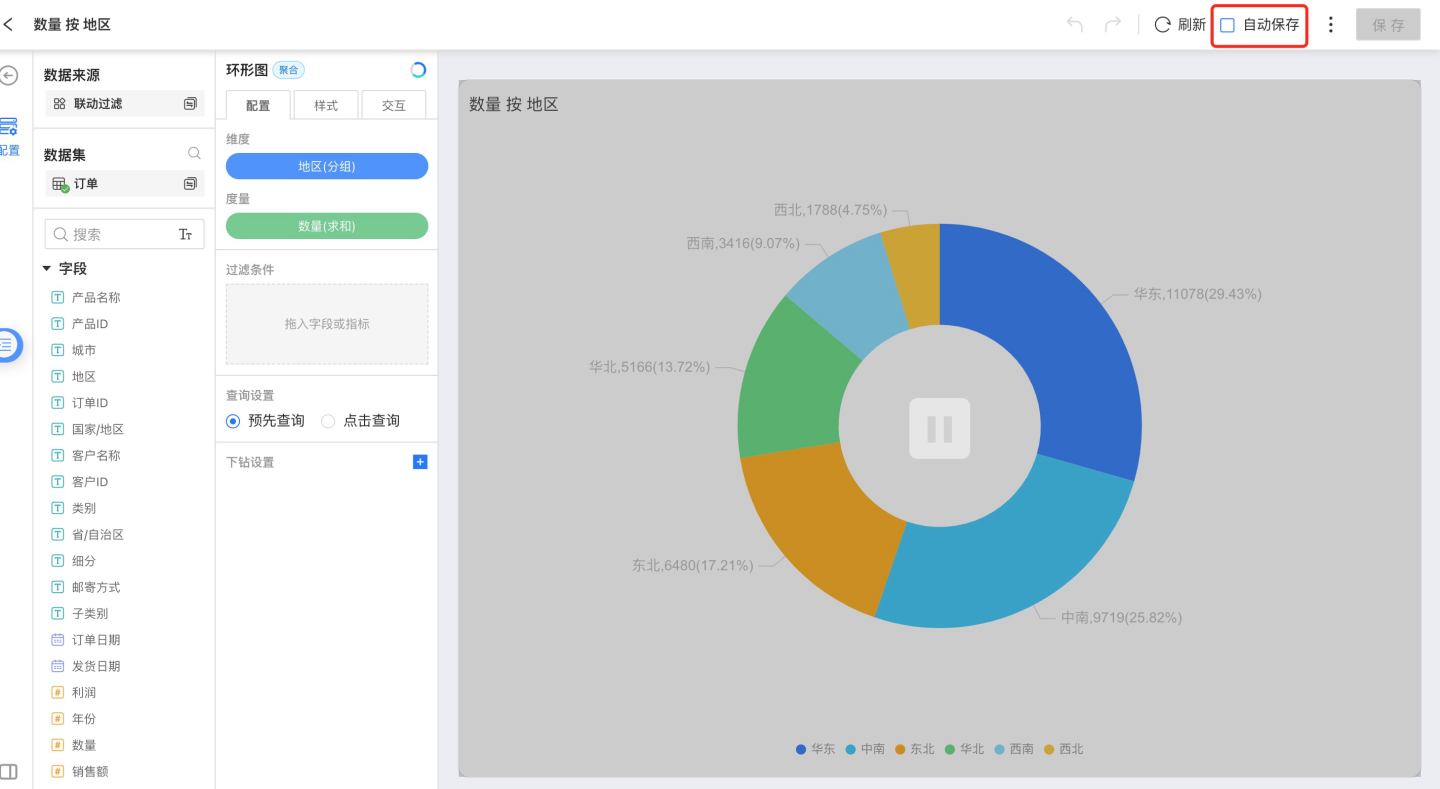
Auto Save
Auto Save refers to the automatic saving of chart operations. This feature is enabled by default. Auto Save primarily ensures that all user actions are preserved and not lost.
In scenarios where Auto Save is enabled, every operation will trigger the chart to re-render. When a chart contains a large amount of data, each render can be time-consuming. In such cases, enabling Auto Save may cause lag during chart creation, so it is recommended to disable the Auto Save feature. When Auto Save is turned off, users can manually save their progress, and manual saving will trigger the chart to render.
When Auto Save is disabled, the following situations will occur:
- A pause overlay will appear on the chart interface;
- Users cannot edit fields/metrics;
- Any ongoing drill-down will be canceled;
- Any open detailed data pop-up windows will be closed.
Undo/Redo
When a chart is open, you can click the Undo button to cancel actions performed on the chart. Multiple undo actions are supported. You can also redo actions that have been undone.
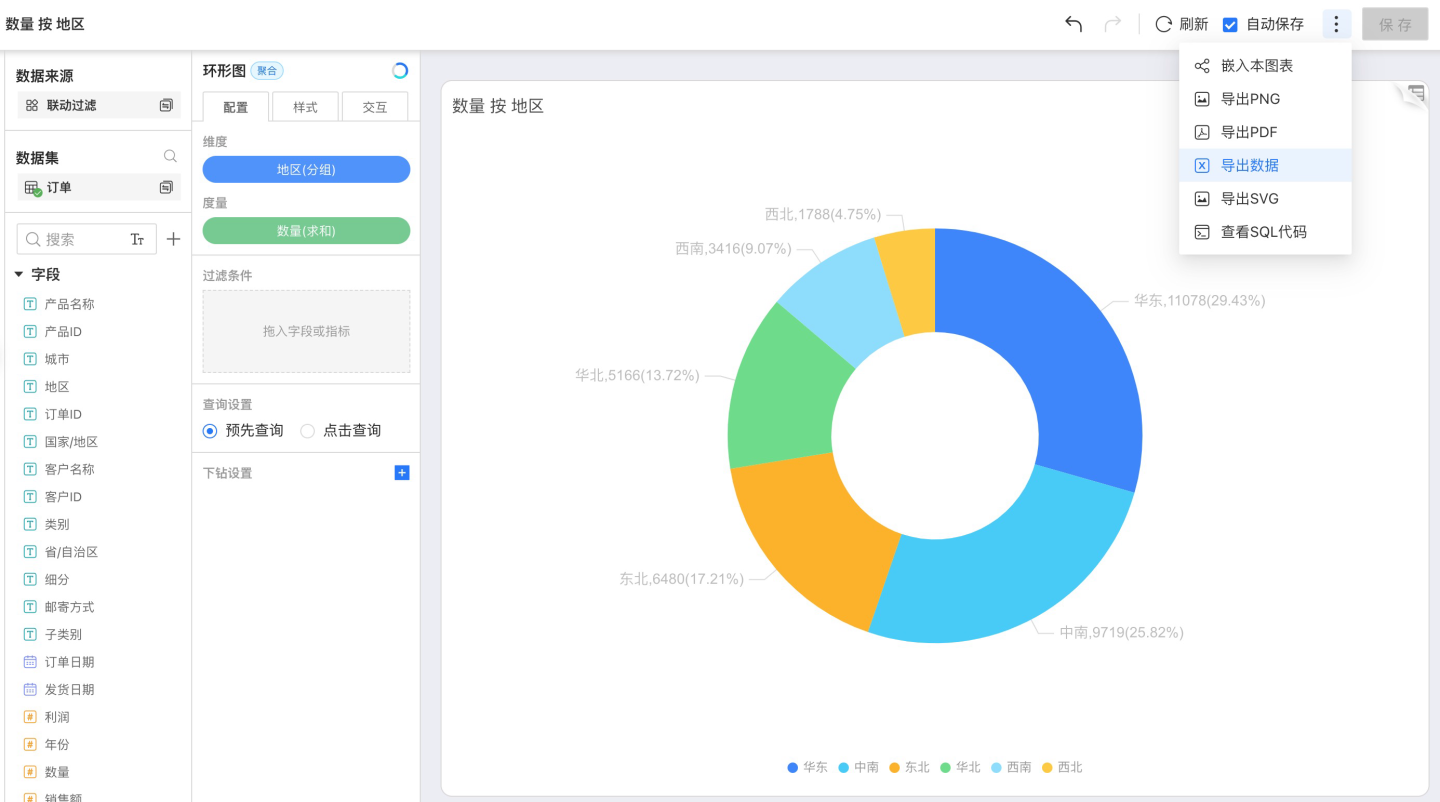
Export
When viewing a chart, you can export the chart in PNG or PDF format, and you can also export the aggregated data of the chart.
Refresh
Do not use cached chart data; instead, refresh the chart data directly.
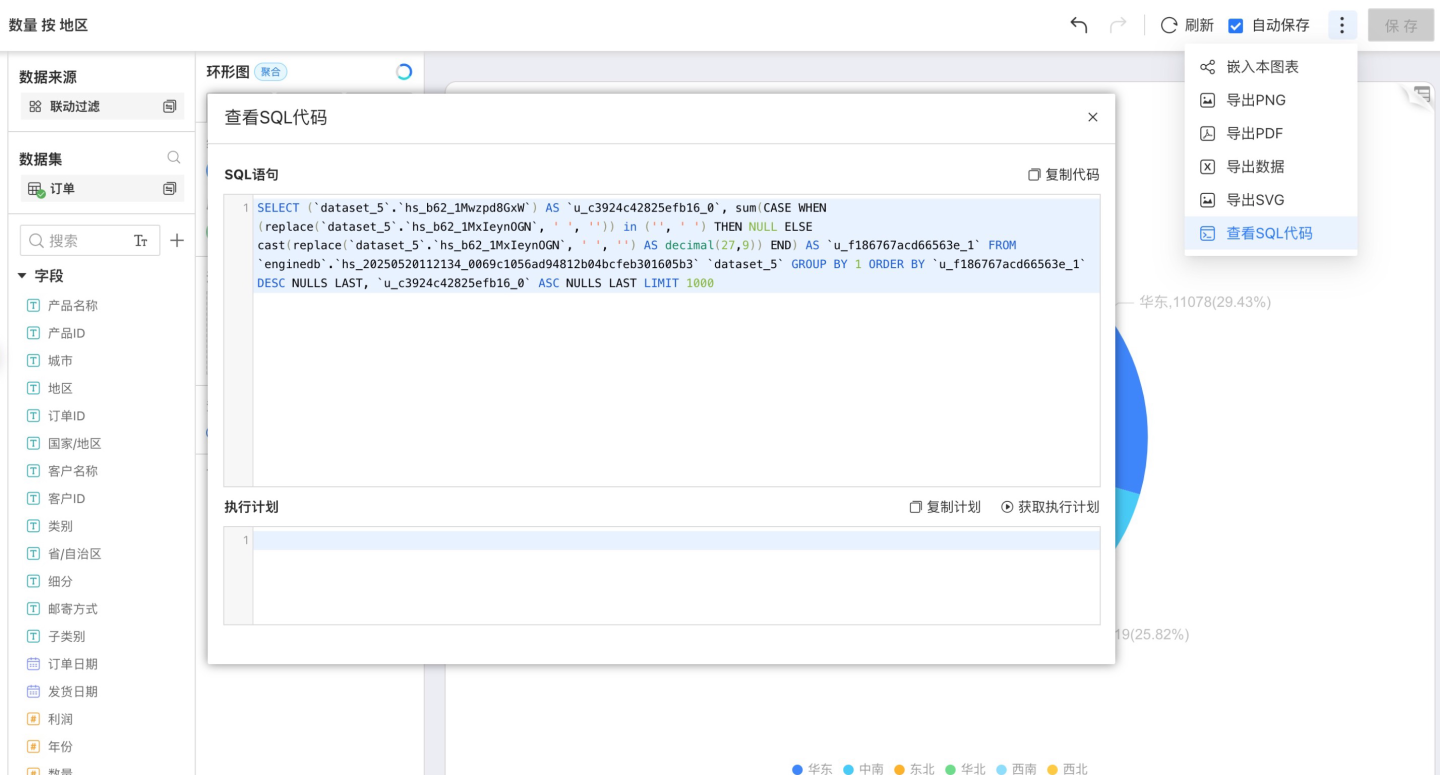
View SQL Code
When designing charts, you need to use different data, and the calculations for this data can be simple or complex. Sometimes, the backend response can be slow when calculating this data. Viewing the SQL code can help users understand how the SQL is executed in the backend, and assist in troubleshooting and optimization.
Viewing SQL code provides the following two features:
- View SQL code.
- View the explain result of the SQL execution plan.
If you find that the performance of a certain chart is not ideal, you can first check whether the executed SQL code is reasonable and whether the calculation expressions for dimensions and measures can be adjusted. Then, you can use the explain feature to view the execution plan. If you find that certain operations in the execution plan take a long time, you can perform corresponding optimizations based on different situations. For example, if most of the time in the execution plan is spent repeatedly scanning tables, you can consider creating indexes on relevant columns of the related tables to speed up chart execution.
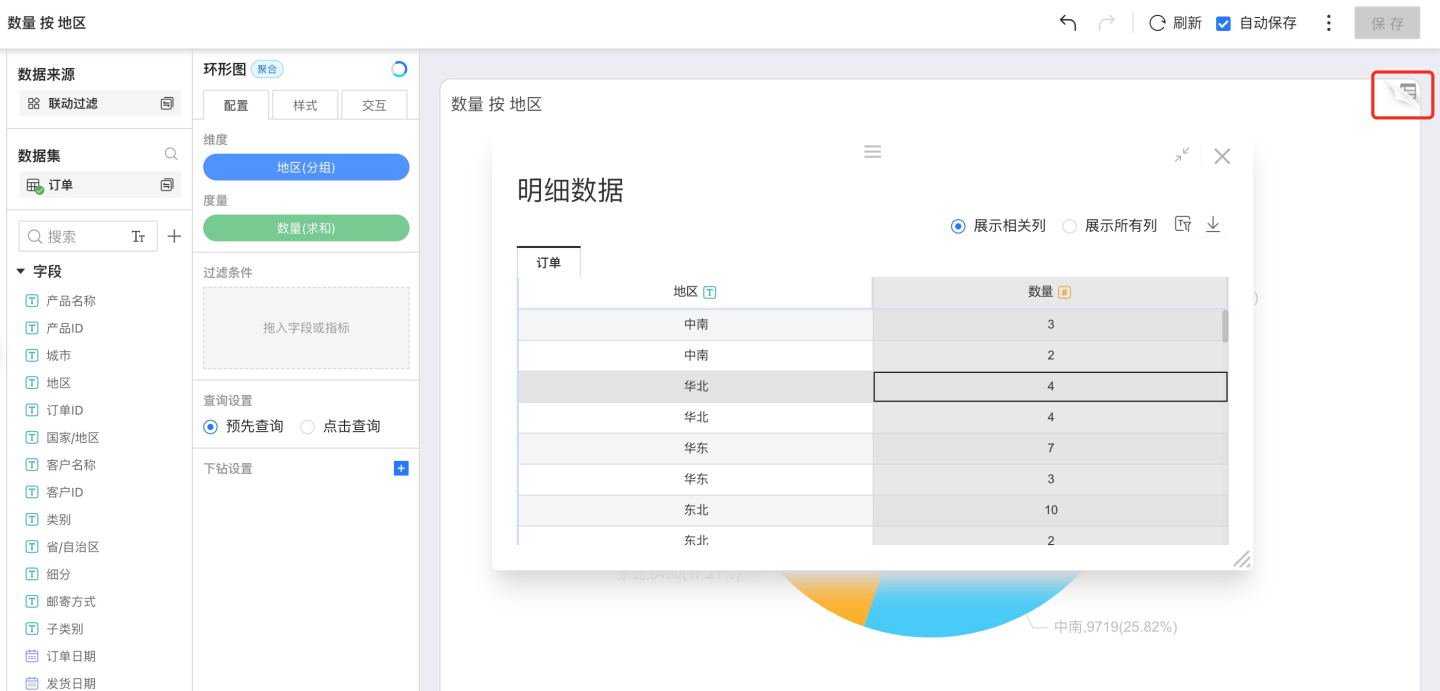
View Detailed Data
You can view the original data of users in the chart, displaying either the columns related to the chart or all columns of data. It supports viewing data with applied filters and exporting data.