Task Management
Task management involves managing the execution plans of background tasks within the system and monitoring execution records, enabling users to understand task operation status and manage tasks uniformly.
Task management allows users to view task statuses, execution records, and modify execution plans. Regular users can view and manage all execution plans they own, while system administrators (users with the System Management Role) can view, modify, and delete execution plans for all resources, ensuring unified management of system operation resources.
Click Settings -> Task Management to access the Execution Plans and Execution Records modules.
Task Types
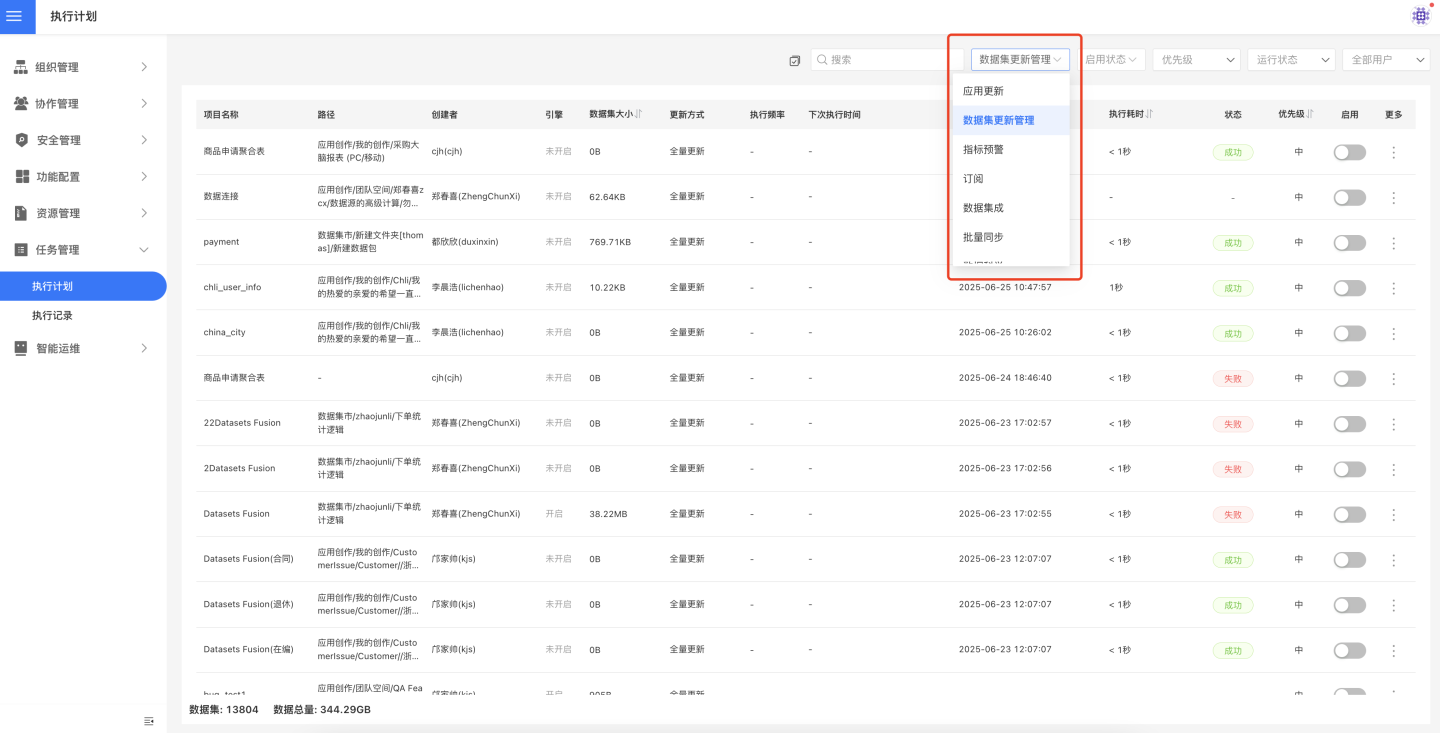
Task management includes ten types of tasks: App Updates, Dataset Updates, Metric Alerts, Subscriptions, Data Integration, Batch Synchronization, Data Science, Intelligent Data Learning, Intelligent Data Tokenization, and Business Metric Topic Vectorization. After setting the execution plan, regardless of whether the plan is enabled, you can view the status and operation details of these tasks in task management.
Different user roles are allowed to manage different types of tasks:
- Users with the System Management Role can manage all types of tasks;
- Except for system administrators, other user roles can only manage tasks related to resources owned by their roles;
- The tenant system and the platform system support different functional modules. In the tenant system, only seven types of tasks are included: App Updates, Dataset Updates, Metric Alerts, Subscriptions,
Intelligent Data Learning,Intelligent Data Tokenization, andBusiness Metric Topic Vectorization. Tenant system administrators can manage all tasks within the tenant system, while regular tenants can only manage execution tasks related to resources owned by their roles.
Execution Plan
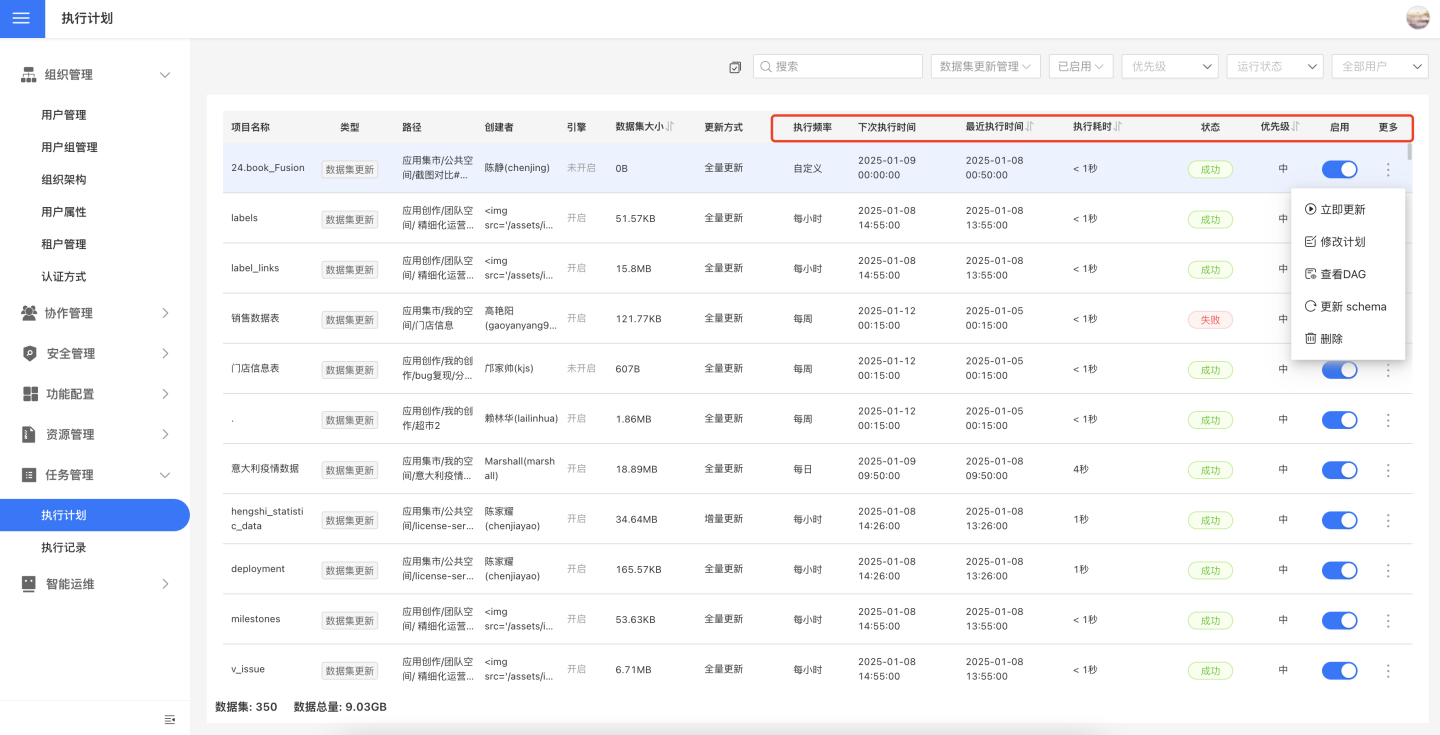
Click Settings -> Task Management -> Execution Plan to enter the execution plan page. This page displays the periodic execution plan list for various types of tasks based on task type. The list includes basic information about the tasks, such as type, project name, creator, path, engine, dataset size, and other task-specific details. If a plan is enabled, the list also shows task execution-related information, including execution frequency, next execution time, most recent execution time, execution duration, and execution status.
When viewing tasks in the execution plan, you can search for tasks by project name, filter tasks based on priority, running status, creator, and enablement status, and sort tasks.
The execution plan supports operations such as enabling, disabling, executing immediately, modifying the plan, deleting the plan, and viewing the DAG, making it convenient for task owners or system administrators to monitor and manage tasks as needed. Tasks of the dataset update type also support schema update operations.
The execution plan supports batch operations, including immediate updates, enabling, disabling, and deleting tasks in bulk. 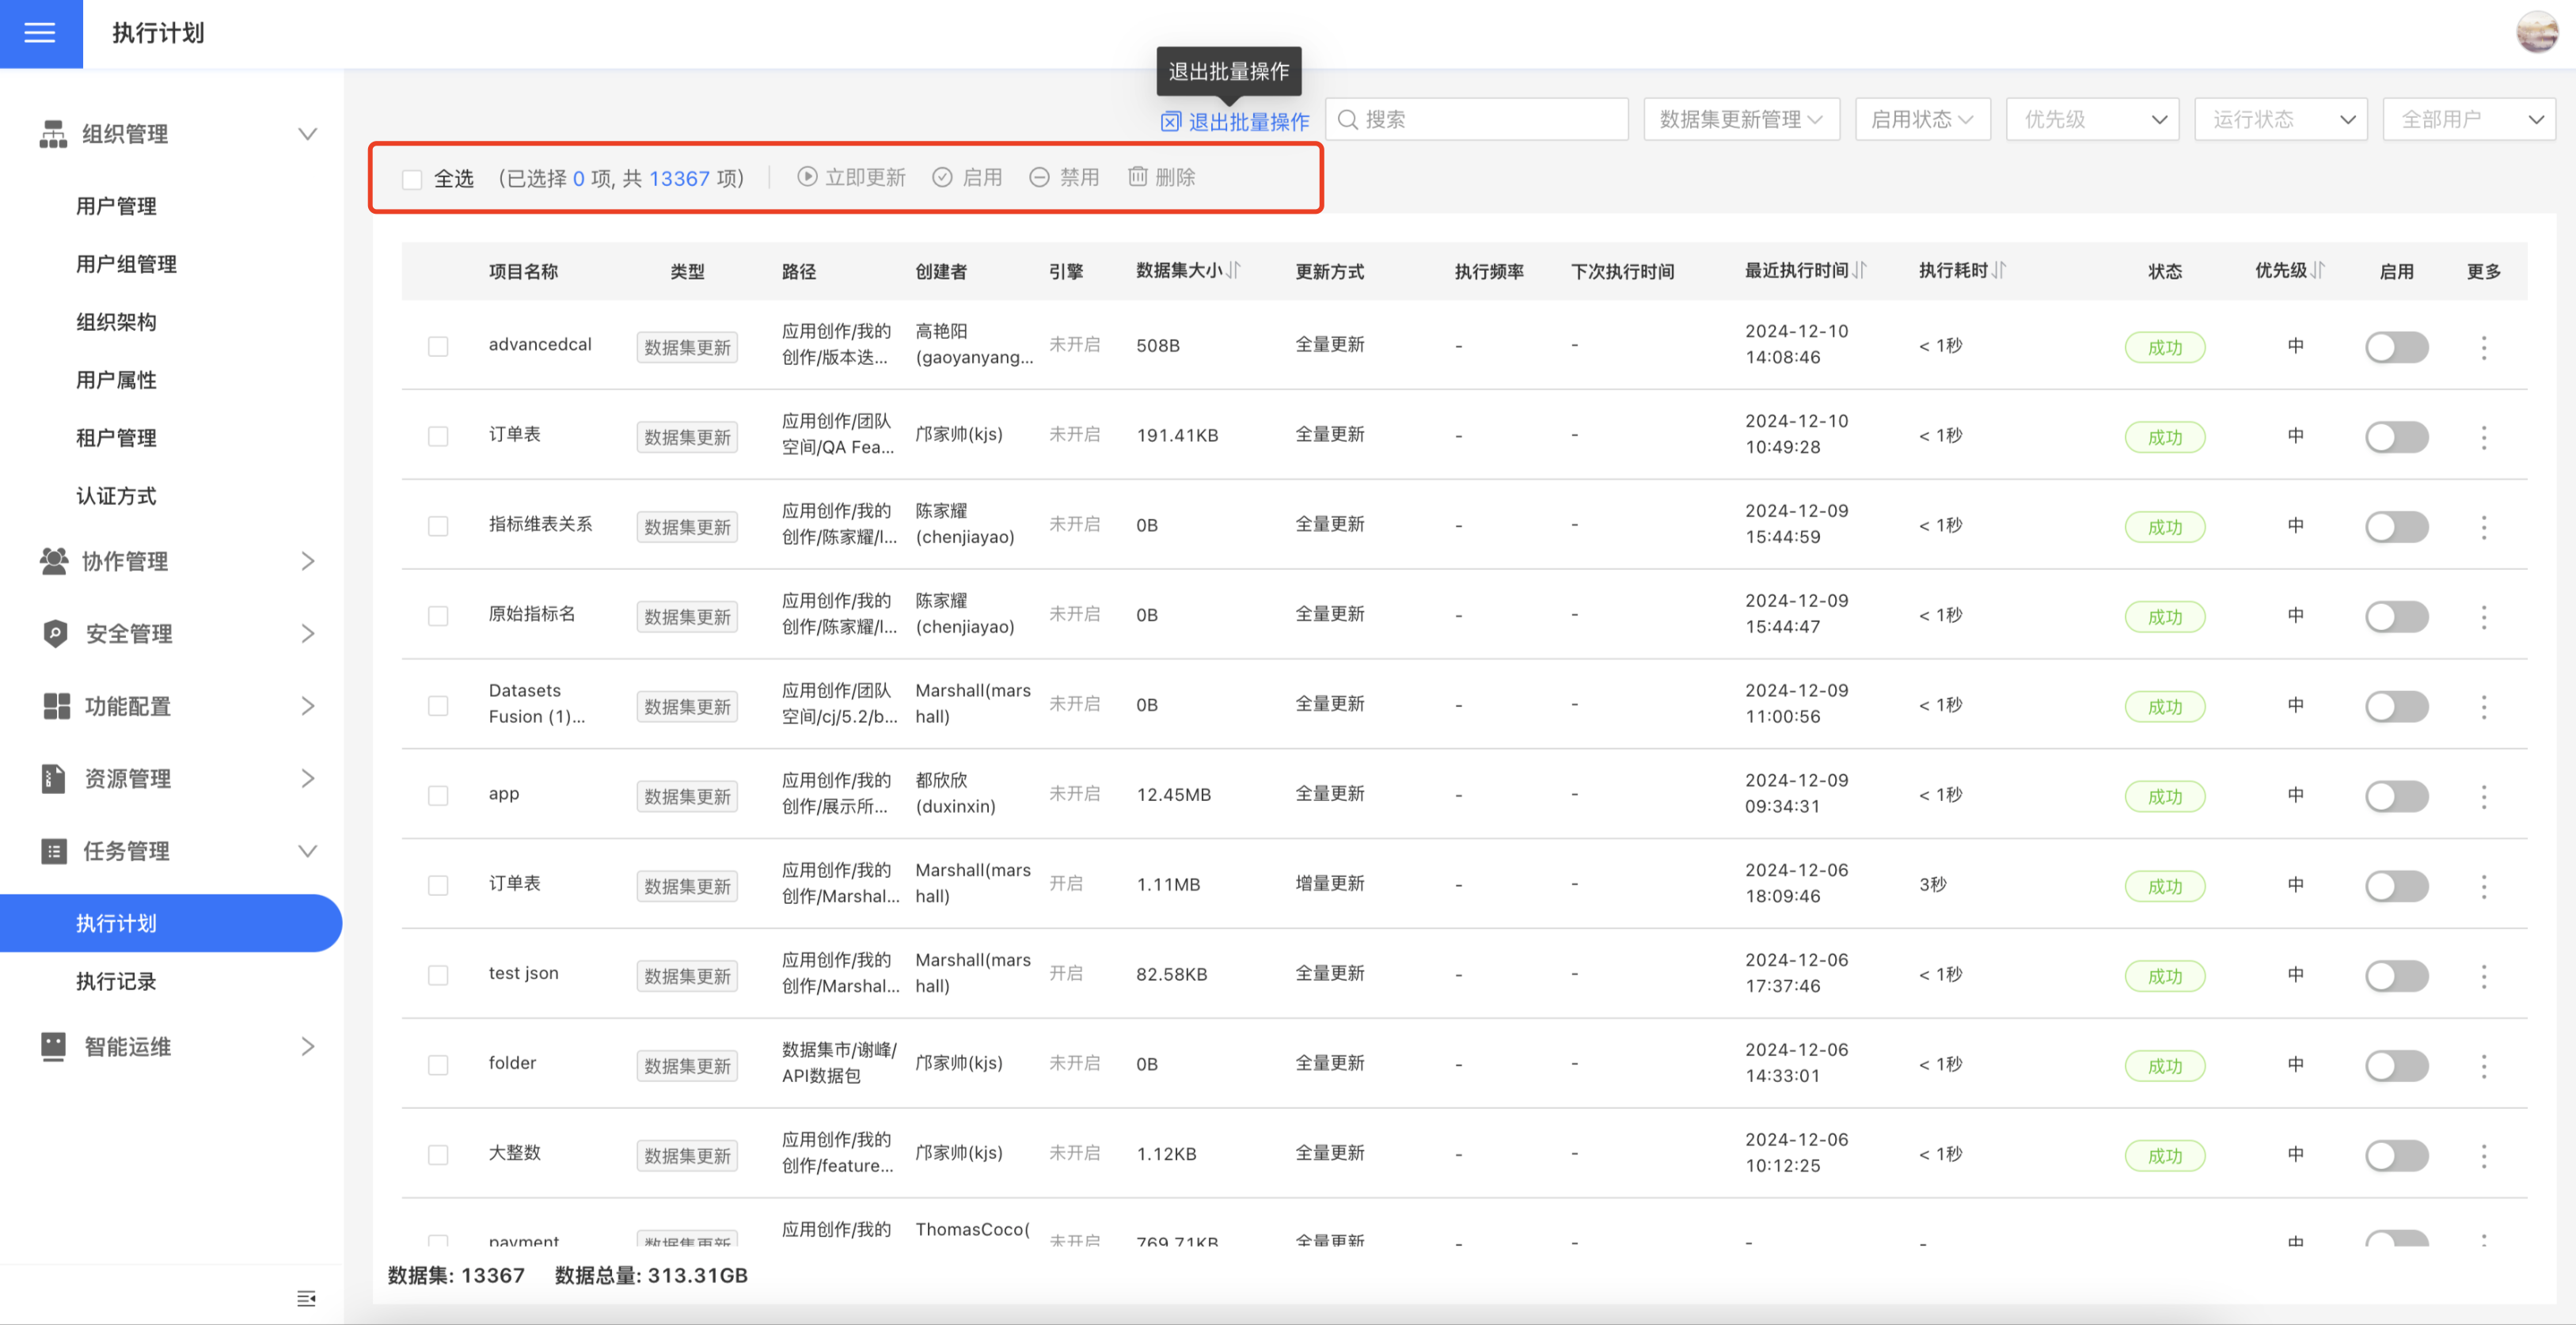
Tip
- Metric alert tasks in the execution plan only support enabling/disabling the plan and do not support other operations. To modify or delete metric alert tasks, please operate under the corresponding application path.
- After an execution plan fails, you can set up email notifications to remind relevant task owners to pay attention to failed tasks and handle them promptly. This feature applies to all tasks within the system. Before setting up, please check whether the SMTP Service is enabled.
DAG Chart of Execution Plan
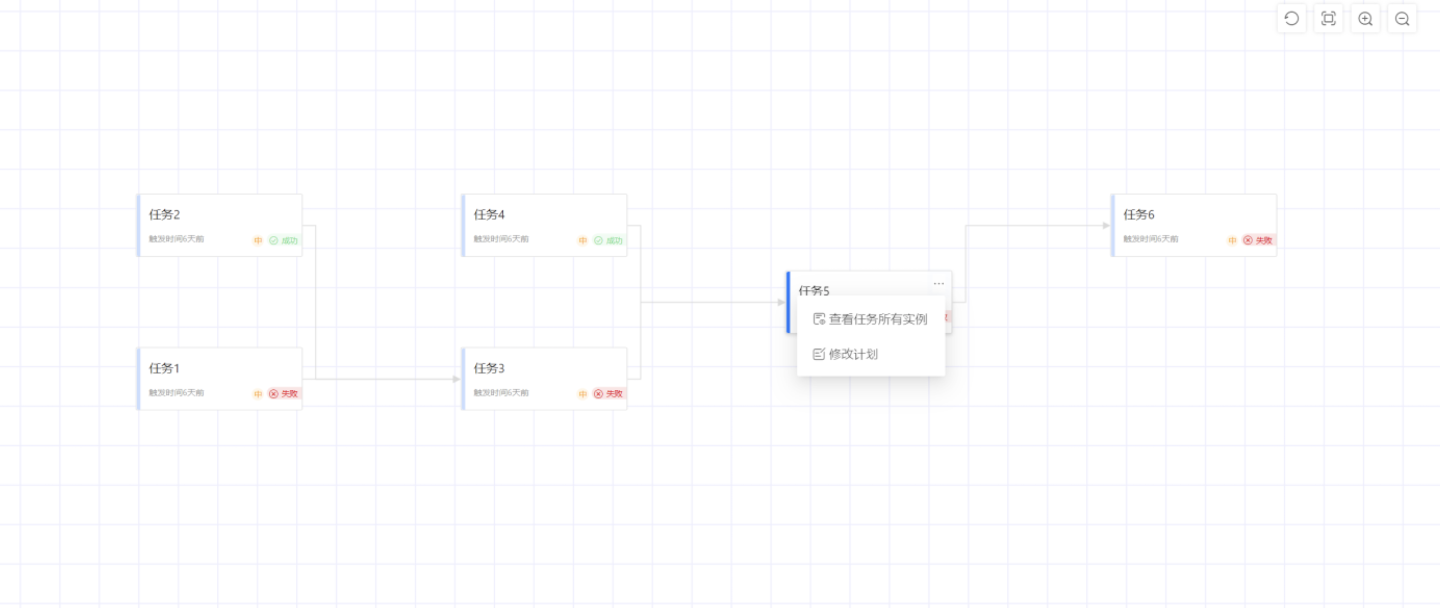
Each task in the execution plan can view its DAG chart, which displays the current status of the task, the dependency graph between tasks, and the upstream and downstream task execution status in the task chain. The DAG chart typically shows only the 2-level upstream dependencies and 1-level downstream tasks of the current task. If the task chain is relatively long, you can drag to view all tasks.
In the DAG chart of the execution plan, you can view all instances of the task and modify the task plan. Viewing all instances of a task means checking the task's execution records.
Execution Records
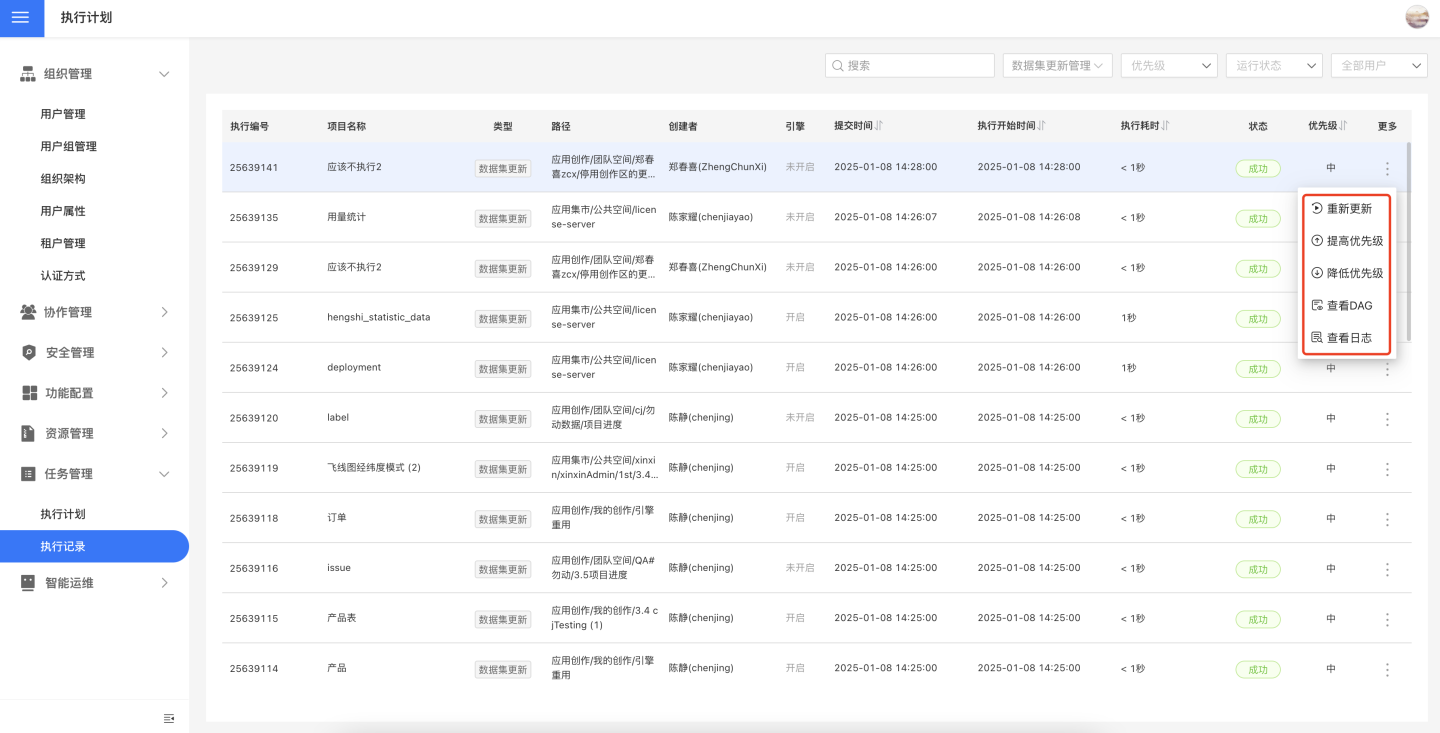
Click Settings -> Task Management -> Execution Records to enter the execution records page. The execution records page displays the execution record list of tasks from the past 30 days, categorized by task type. The list shows basic information and execution details of the tasks. Basic information includes type, project name, creator, path, engine, dataset size, which may vary depending on the task type. Execution details include execution code, submission time, execution start time, execution priority, execution duration, and execution status.
The execution records page supports searching for tasks by project name, filtering tasks by priority, status, and user, as well as sorting tasks.
In the execution records, you can perform operations such as rerunning tasks, increasing priority, decreasing priority, viewing DAG, and viewing logs.
Note
- For metric alert tasks in execution records, only log viewing is supported; other operations are not available.
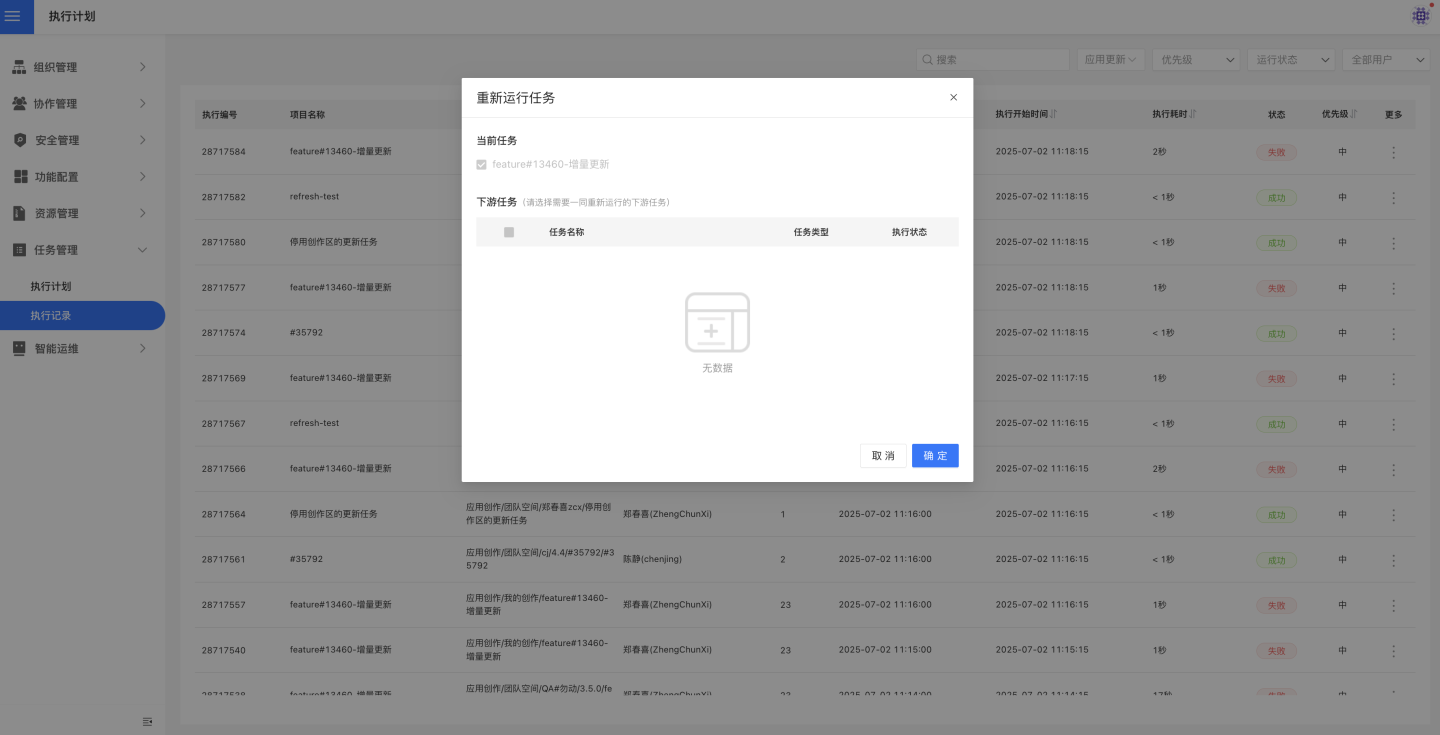
Rerun
Click Update Again in the three-dot menu of the task to open the task rerun settings interface. You can set to rerun the current task and its downstream tasks. The tasks set for rerun will be executed immediately and enter the task execution queue.
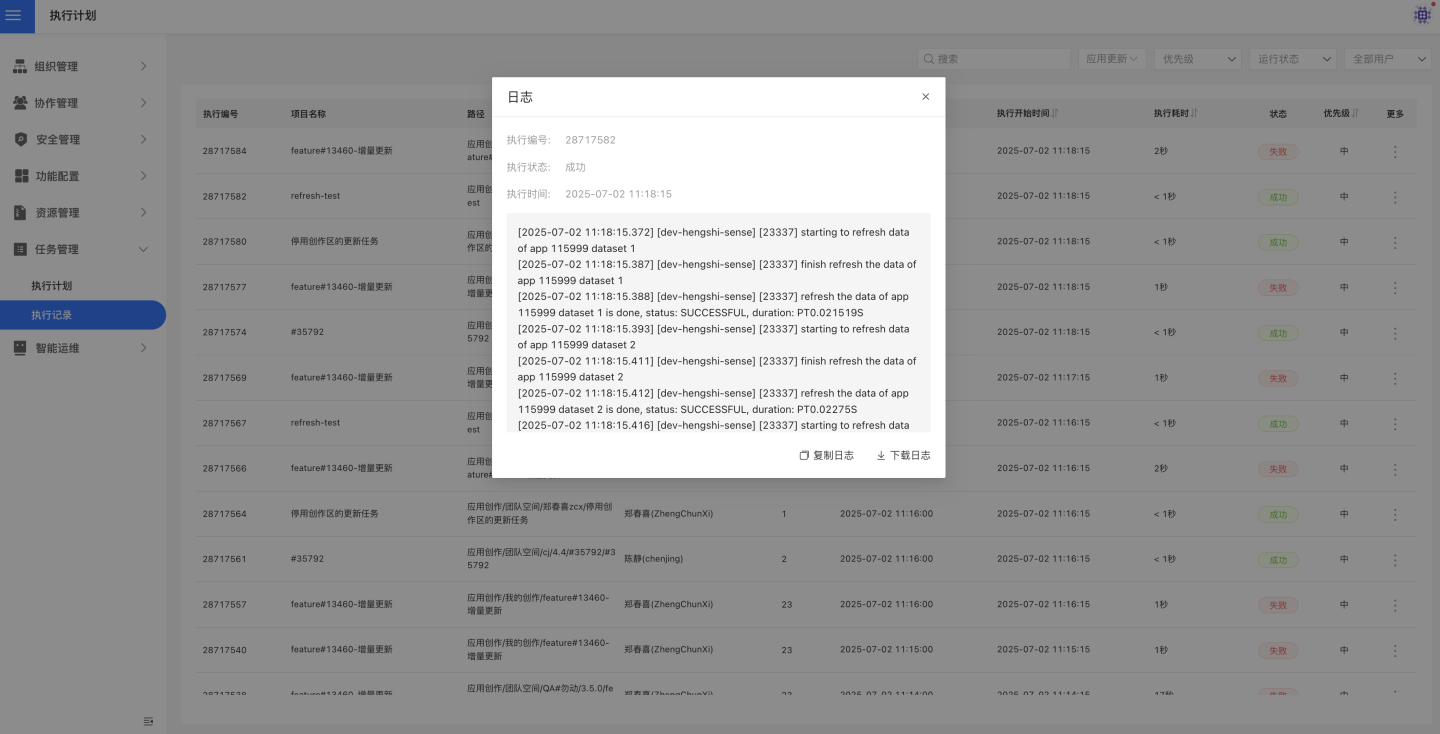
Execution Log
Click View Log to display the log information recorded during the execution of the task, which is often used to analyze exceptions that occurred during the task execution.
DAG Chart of Execution Records
The DAG chart of execution records can also be viewed, displaying the same content as the DAG chart in the execution plan. This includes the current status of tasks, the dependency graph between tasks, and the runtime status of upstream and downstream tasks in the task chain. However, the operations supported in the DAG chart of execution records differ from those in the execution plan.
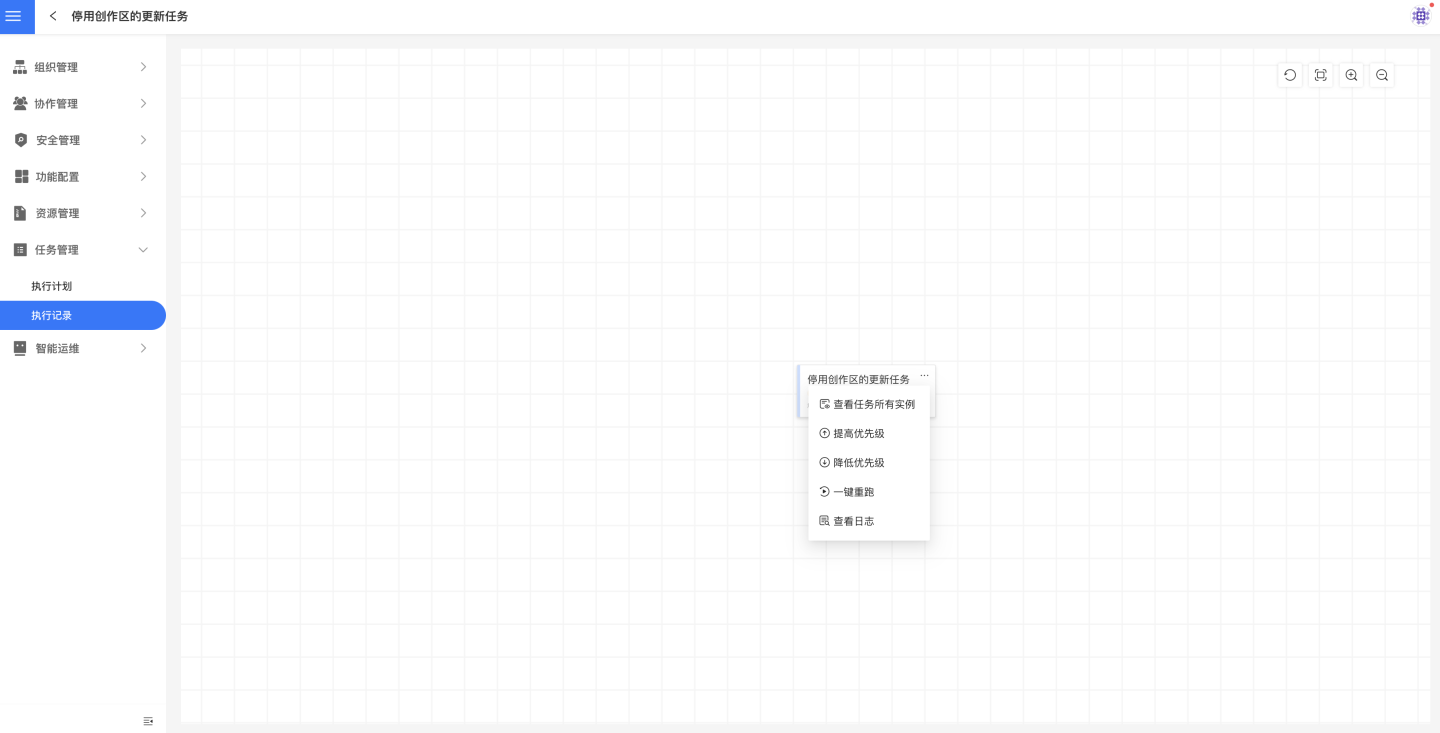
In the DAG chart of execution records, you can view all instances of a task, modify task priority, rerun tasks with one click, and view logs.
- Viewing all instances of a task means checking all execution records of the task within the past 30 days.
- Supports increasing and decreasing the priority of tasks.
- Supports one-click rerun settings, i.e., rerunning the task and its downstream tasks.
- Supports viewing task execution logs.
Single Task Execution Records
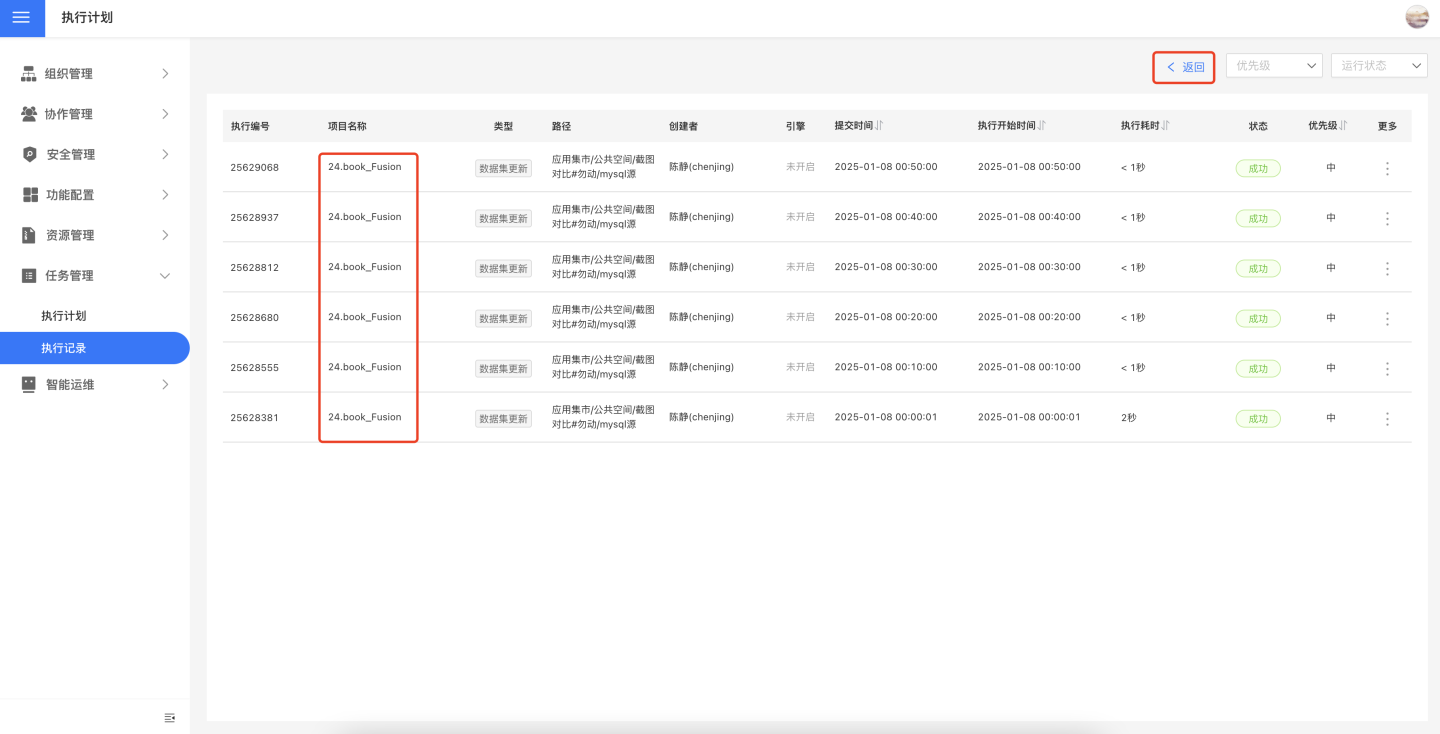
The complete execution records of a single task over the past 30 days can be viewed in the following two ways:
- Click on the task within the execution plan page to enter the execution record list page for that task. This page displays the execution records of the task over the past 30 days. Click the back button to return to the execution plan page.
- In the DAG chart, click to view all instances of the task. After opening, it will display the execution records of the task over the past 30 days.