Chart Library
In enterprise management, the same set of business data often needs to serve different teams. Take quarterly product sales data as an example: sales personnel use it to analyze whether they have met their expected goals, the marketing team uses it to understand and monitor market trends, and the management team analyzes it to formulate strategic plans. In such cases, the same data is used by different teams, and each team requires analysts to create corresponding reports, leading to a waste of human and material resources.
The Chart Library can effectively solve the above problem. As the name suggests, the Chart Library is a centralized repository for storing data metric charts. Different charts in the library represent different business scenarios. Unlike ordinary charts, it is created, managed, and maintained centrally by specific personnel in the data marketplace. The Chart Library provides data dashboards for data analysts and tenants, allowing them to quickly use charts by selecting them, and supports in-depth exploration and analysis operations on the charts in the library.
The Chart Library enhances the efficiency of individuals and teams:
- Individual users can view and use charts from the Chart Library at any time without needing to perform data design, data processing, or modeling operations. This significantly reduces their workload, allowing them to dedicate more time to deeper areas of focus.
- In team collaboration, charts with the same functionality only need to be developed once, and other members can directly view and use them, enabling more colleagues to easily use charts to analyze business.
Below is an introduction to how to create a Chart Library and the common operations of the Chart Library.
Create a New Chart in the Chart Library
Open the chart library in the dataset.
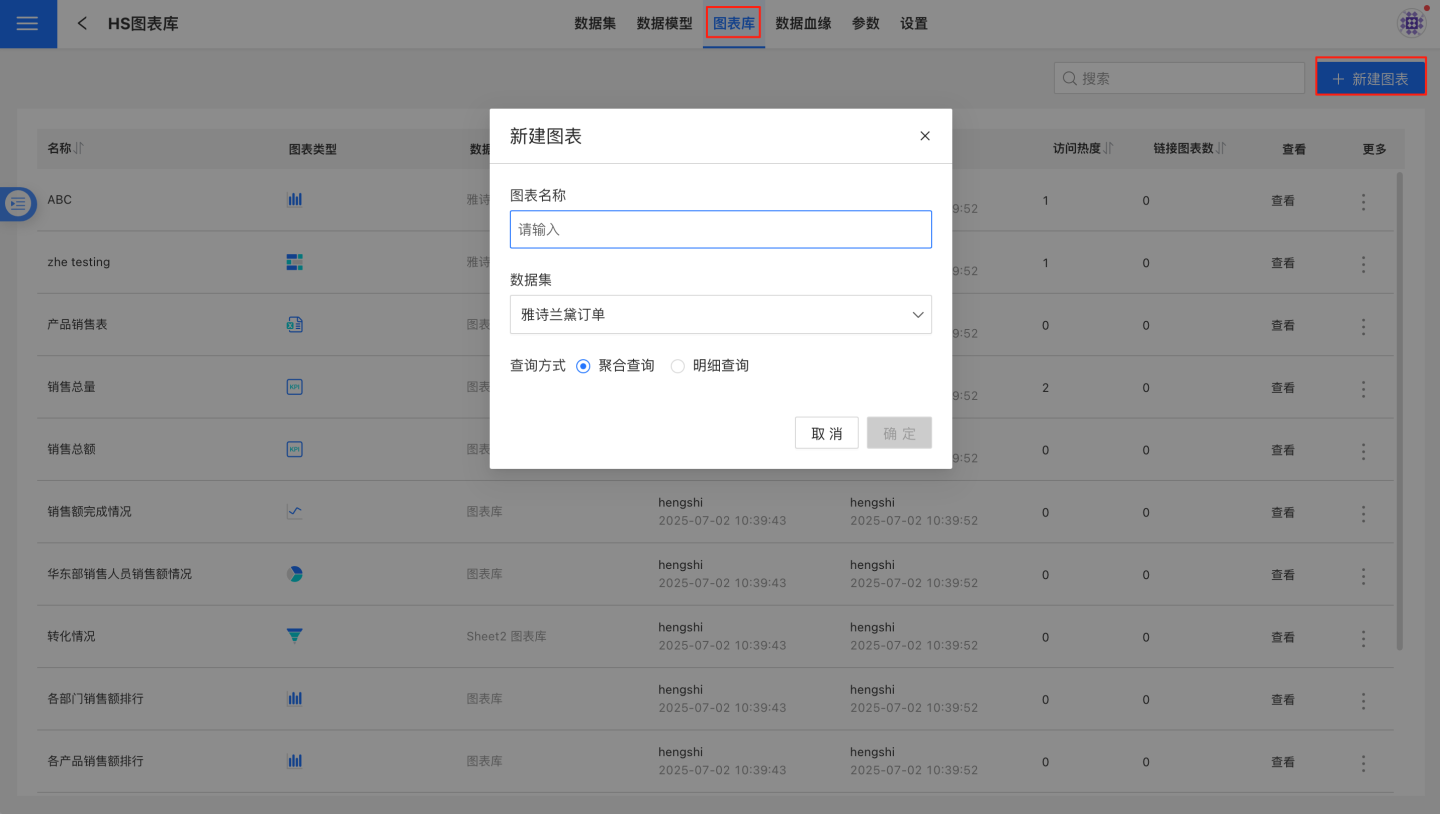
Click New Chart in the upper right corner. A window for creating a new chart will pop up, where you can select the data source, dataset, and query method.
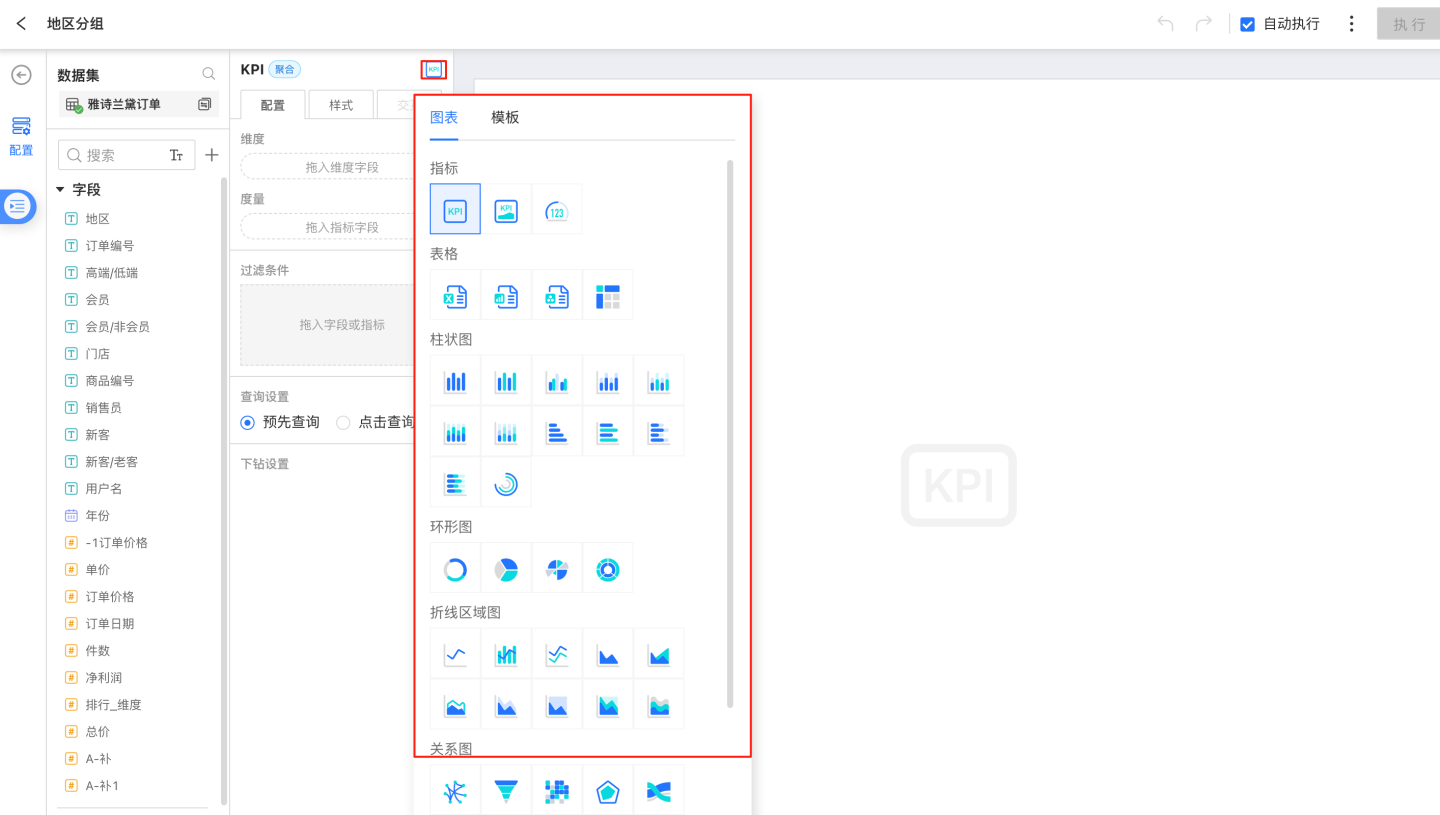
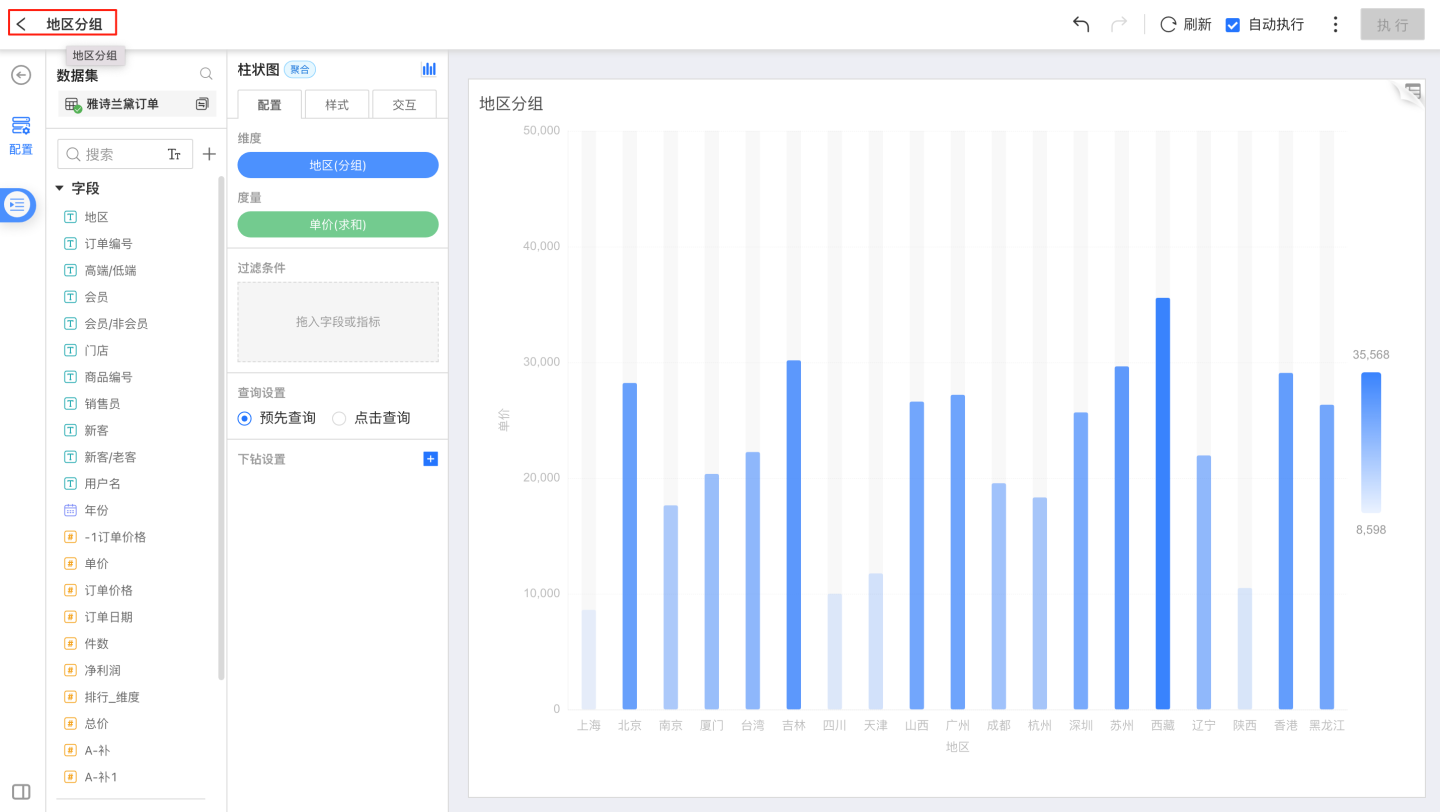
After clicking Confirm, you will enter the chart editing interface. Select the chart type and create a chart based on the business scenario.
Once the chart is created, click the back button to return to the chart library page.
Note
For the types and specific configurations of new charts, please refer to the Chart section.
Rename Chart Library
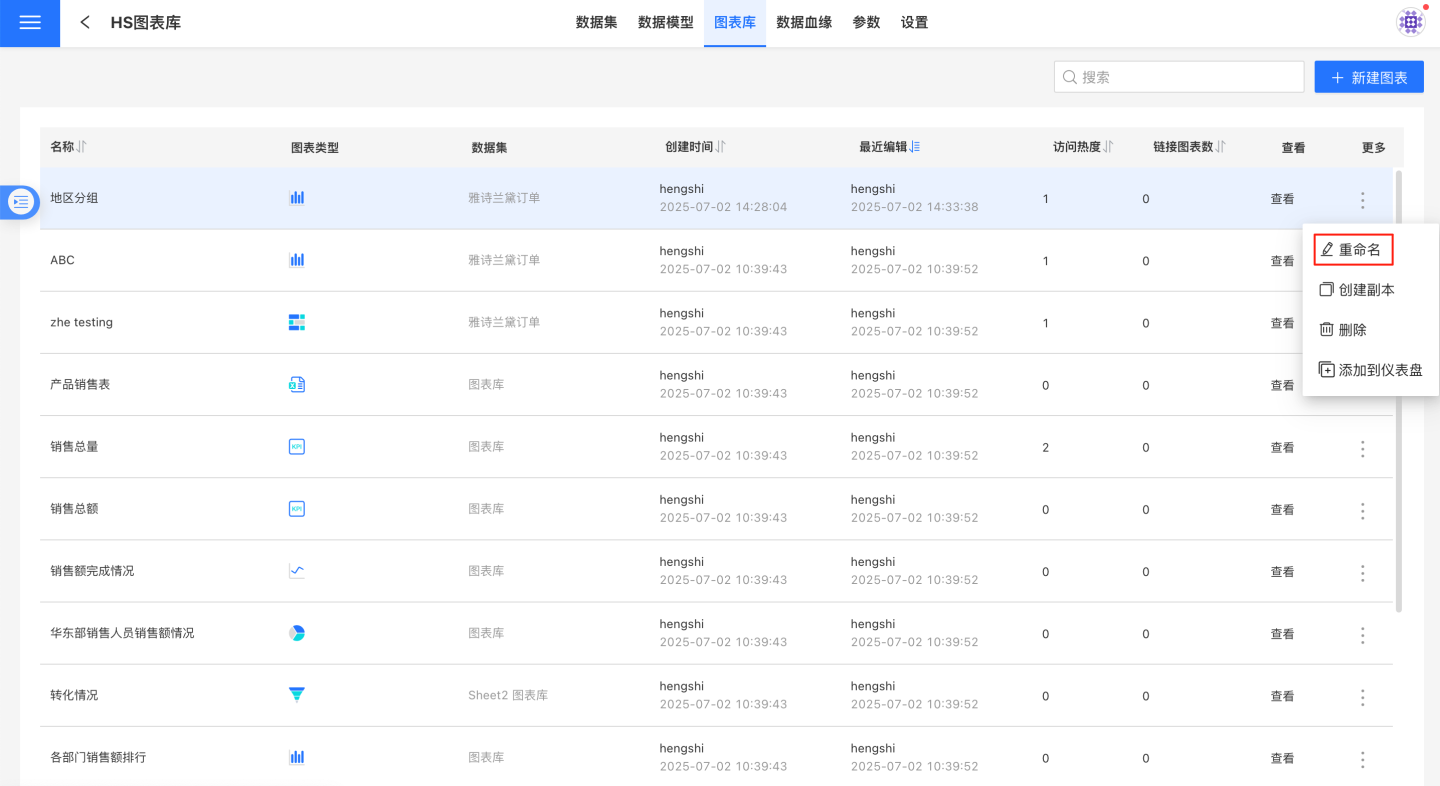
Click the three-dot menu on the right side of the chart in the chart library to rename it.
Create a Copy
Click the three-dot menu on the right side of the chart in the chart library to create a copy, generating a duplicate of the business chart. The default name will be "Chart Name" + "(1)", and you can modify the default name.
Delete Chart Library Chart
Click the delete button in the three-dot menu of the chart library to open a confirmation window. After clicking confirm, the chart will be deleted.
If the chart is referenced, a prompt will appear during deletion, such as "There are charts linked to this chart library chart. Deleting it will cause errors in related charts." 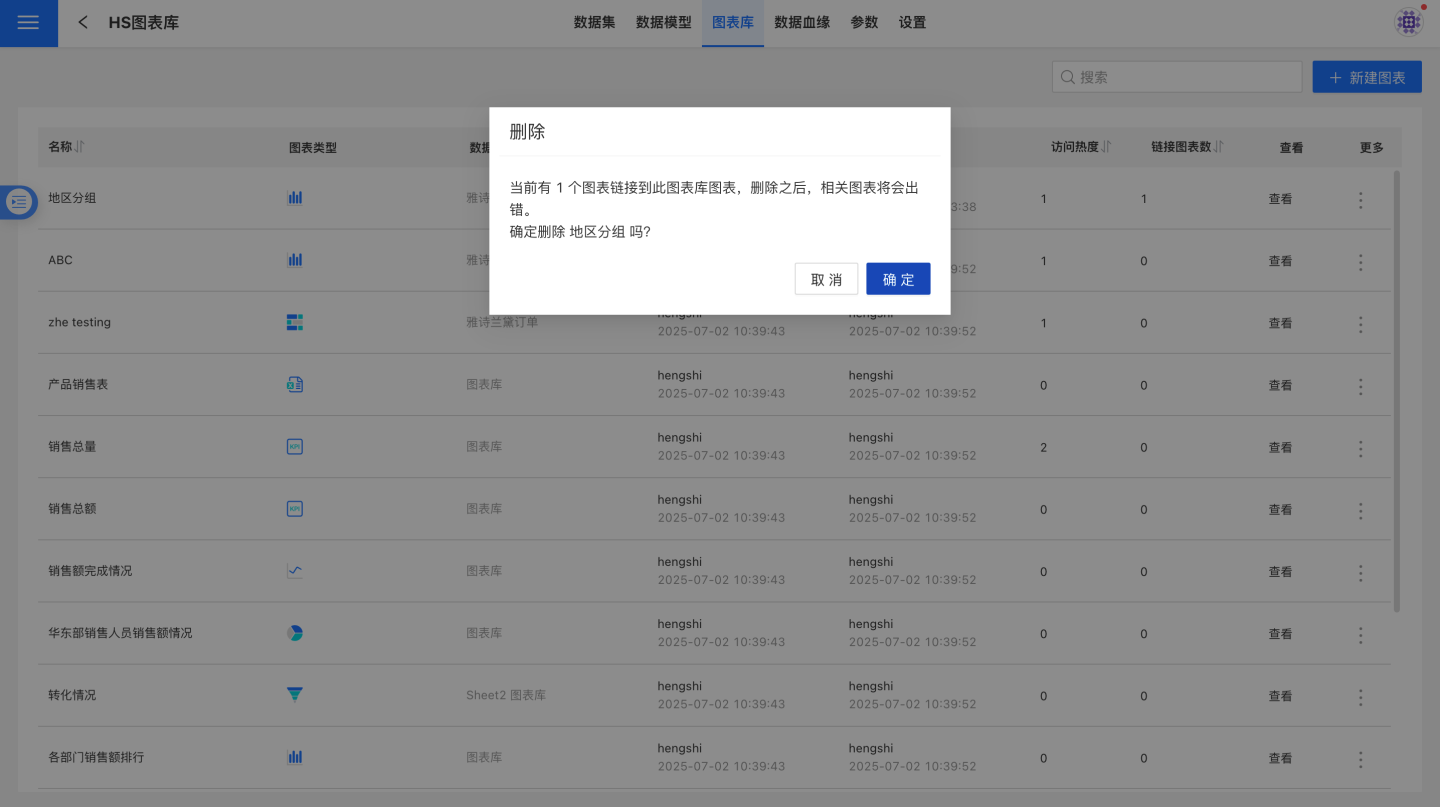
View Chart Library Charts
The chart library displays detailed information about charts in a list format. Users can sort charts by name, creation time, recent edits, access popularity, and the number of linked charts. When the mouse hovers over View, the chart library content is displayed. 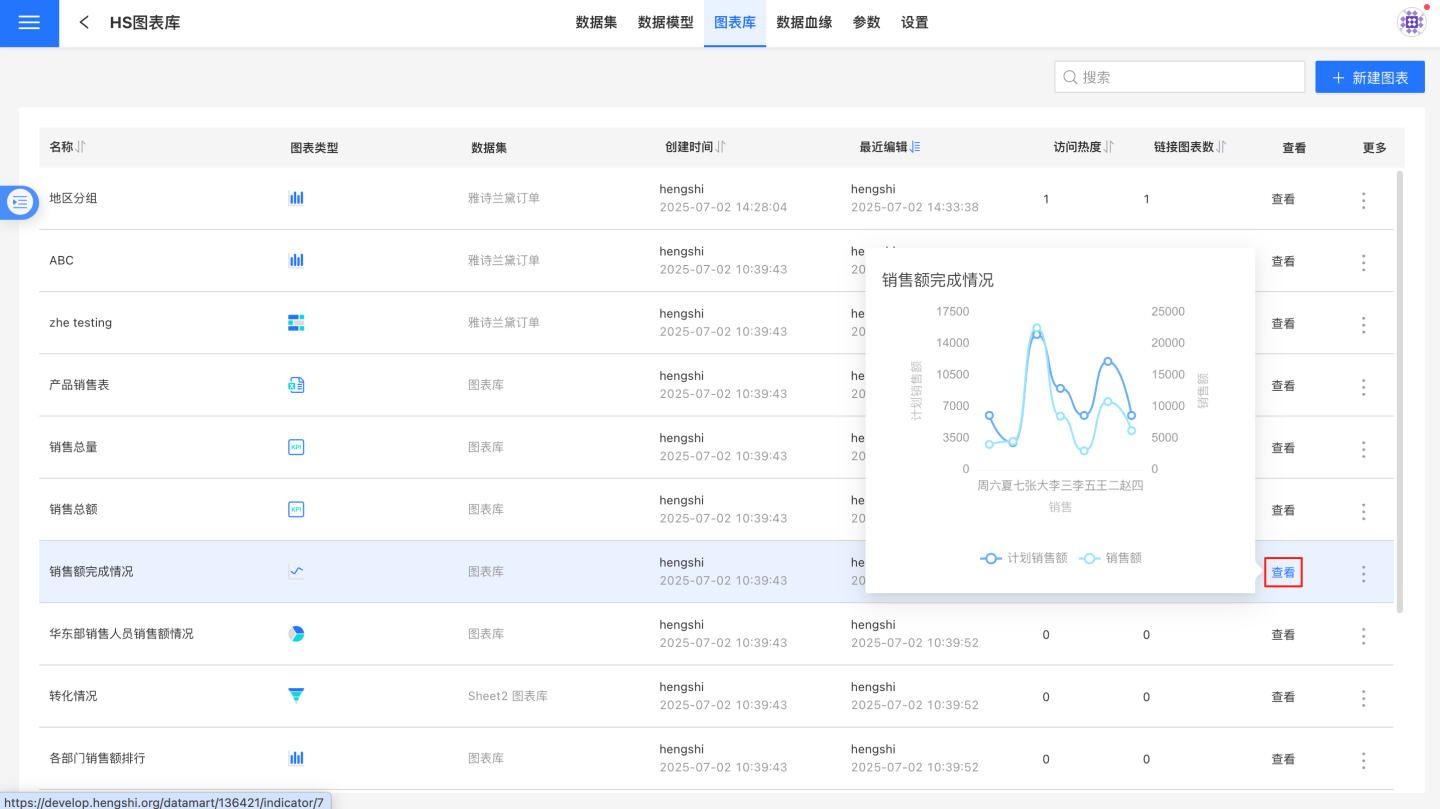
Add to Dashboard
You can add charts from the chart library to the dashboard created in the app and edit them using the "Add to Dashboard" feature.
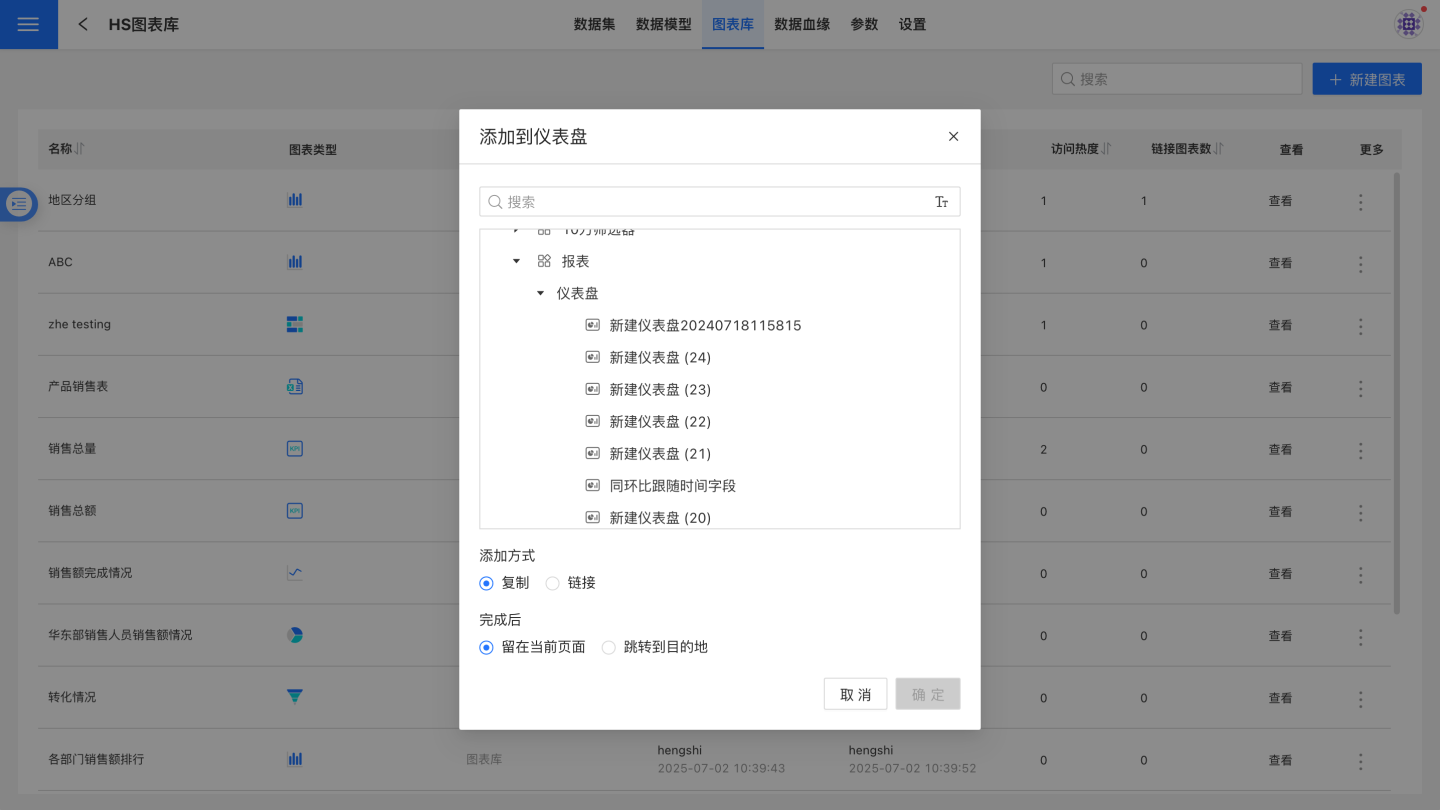
- Click Add to Dashboard in the three-dot menu.
- Select the corresponding dashboard in the pop-up window.
- Use the option "Open the chart in the destination after completion" to determine whether to navigate to the selected dashboard after successfully adding the chart. This option is unchecked by default.
- Choose the addition method, supporting two modes: Copy and Link.
- Copy: Copies the chart from the chart library to the dashboard. The chart in the dashboard becomes an independent, brand-new chart that can be freely edited.
- Link: Links the chart in the dashboard to the chart in the chart library. It cannot be edited and will change along with the chart in the library. If editing is needed, the link can be disconnected.
- Click Confirm to complete the addition. After completion, two behaviors are supported:
- Stay on the current page: Remain on the current list page.
- Navigate to the destination: Jump to the selected dashboard.
Search
In the chart library list, you can enter characters in the search box to search for charts. Currently, only searching by chart library chart names is supported; searching by chart type, model dataset name used by the chart, or creator is not supported.
Importing Chart Library Charts
After the chart library is created, analysts can use the charts from the chart library in app creation. For detailed operations, please refer to Importing Chart Library Charts.