Row-to-Column Dataset
The row-to-column dataset is a dataset generated by performing row-to-column operations on the original dataset.
Create Row-to-Column Dataset
Create a new dataset.
Navigate to the dataset page, click "Create Dataset," and select "Row-to-Column."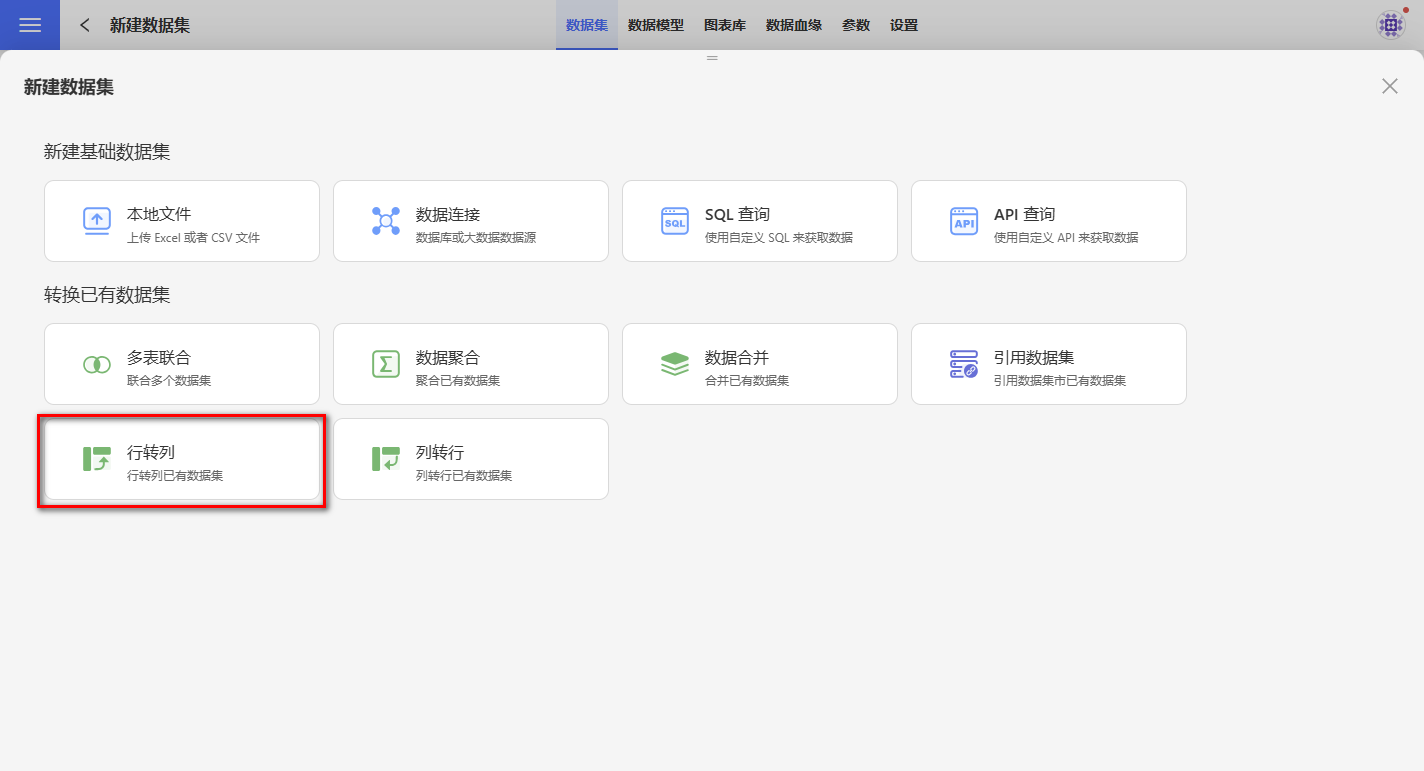
Click on the dataset to be used for the row-to-column operation, and the settings page will appear on the right.
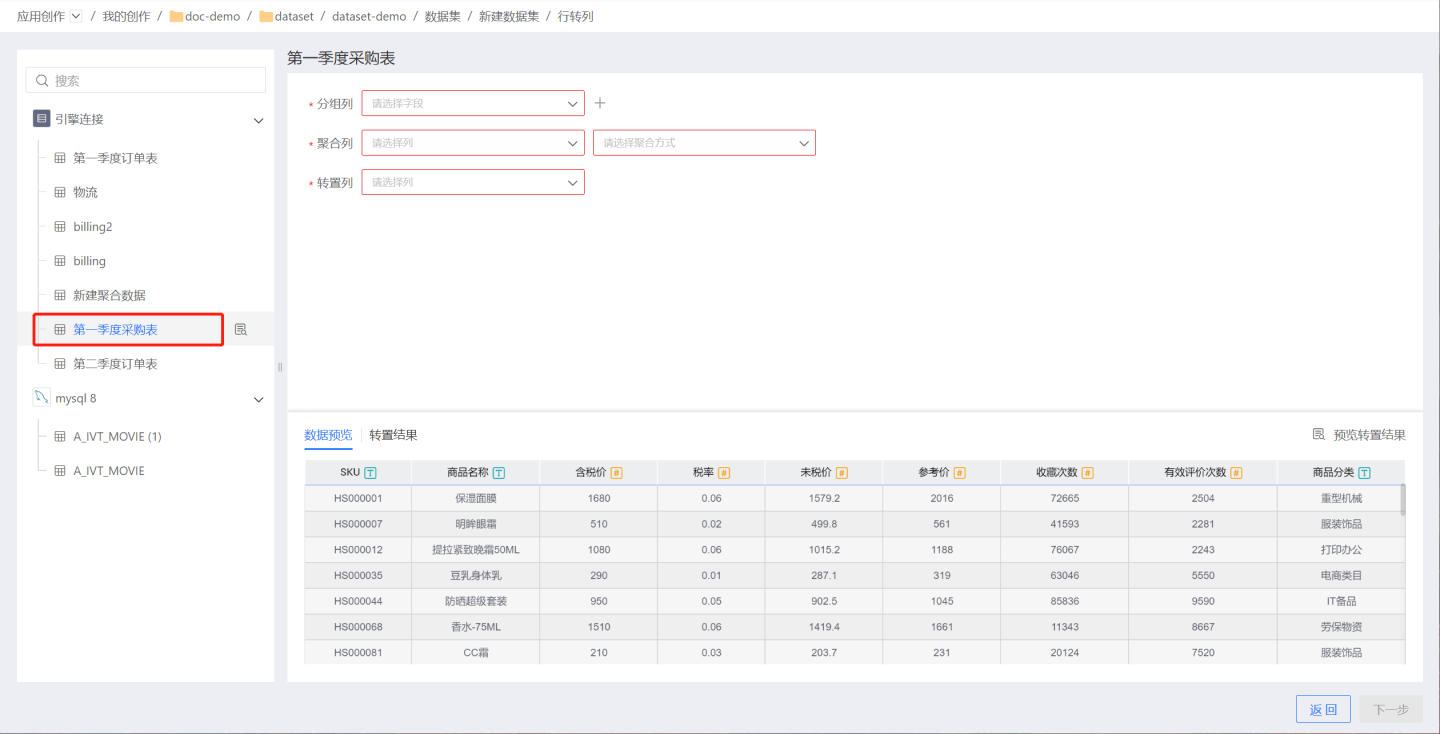
- Configure grouping columns, aggregation columns, and transposed columns.
- Grouping Columns: Add fields from the dataset to the new dataset. You can add one or more fields.
- Aggregation Columns: The values of the aggregation columns are used to populate the transposed columns. When the aggregation column is of numeric type, it supports operations such as average, sum, maximum, minimum, count, and deduplication. For non-numeric types, it supports maximum, minimum, count, and deduplication. In the example, the platform's total sales quantity is used as the aggregation column.
- Transposed Columns: Fields that need to be transposed into columns. By default, the values of this field will be presented as columns. Users can customize column names and add column value fields.
- Add All Column Values from Transposed Column
Display all column values of the transposed column field. You can use the delete button to select the column values you need for conversion and modify aliases. - Add NULL Column
Add a column with NULL values. - Delete All Columns
Remove all column information displayed in the list.
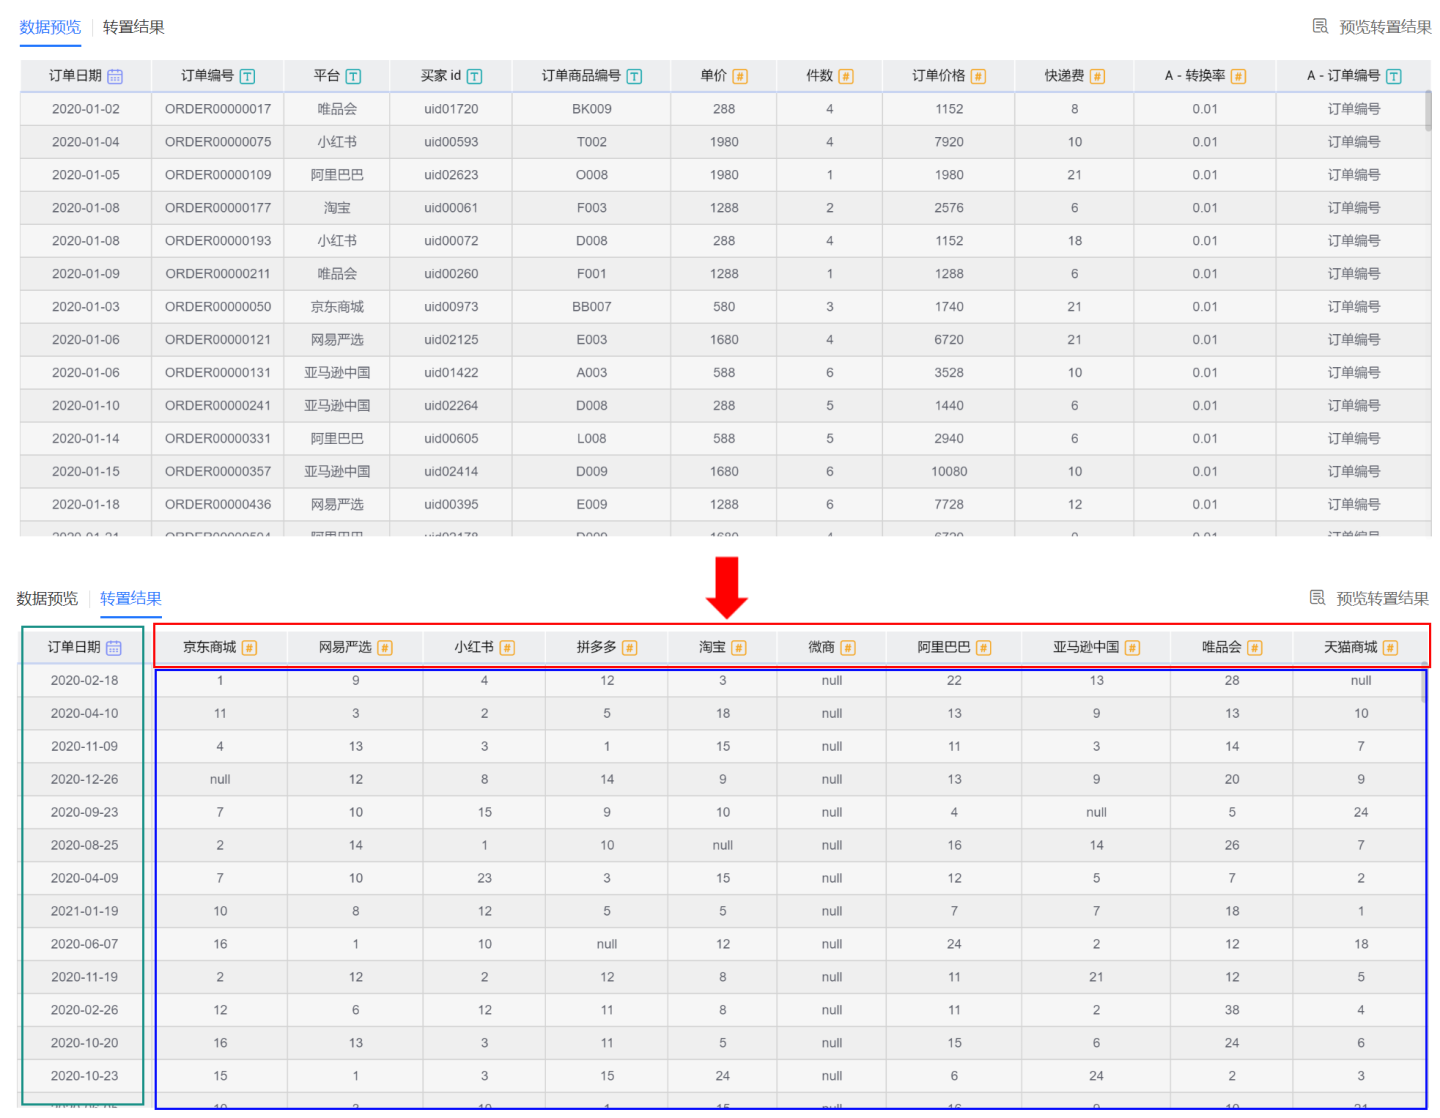
In the example, the order date is added to the new dataset, all values of the platform column are transposed into columns, and a custom WeChat column is added. The sales quantity is used as the aggregation column to populate the transposed columns. Since the WeChat column has no sales quantity values, it is filled with null.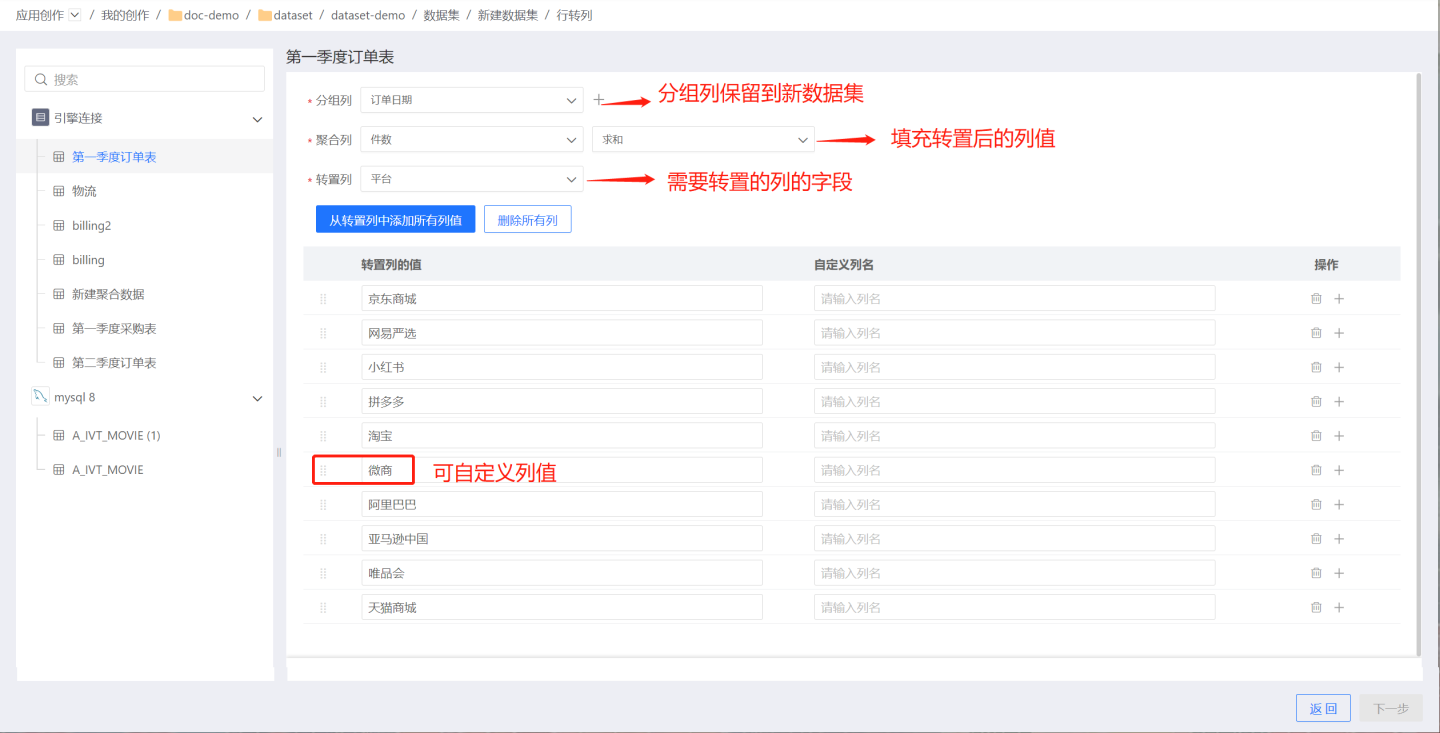
- Add All Column Values from Transposed Column
- Click "Preview Transposed Results" to check if the results meet expectations. The green box represents the grouping columns, the red box represents the transposed columns, and the blue box represents the values of the aggregation columns.
- Configure the data structure and save the dataset.
Click "Next" to enter the data structure page. You can modify field aliases, set fields to display or hide, and then save the dataset.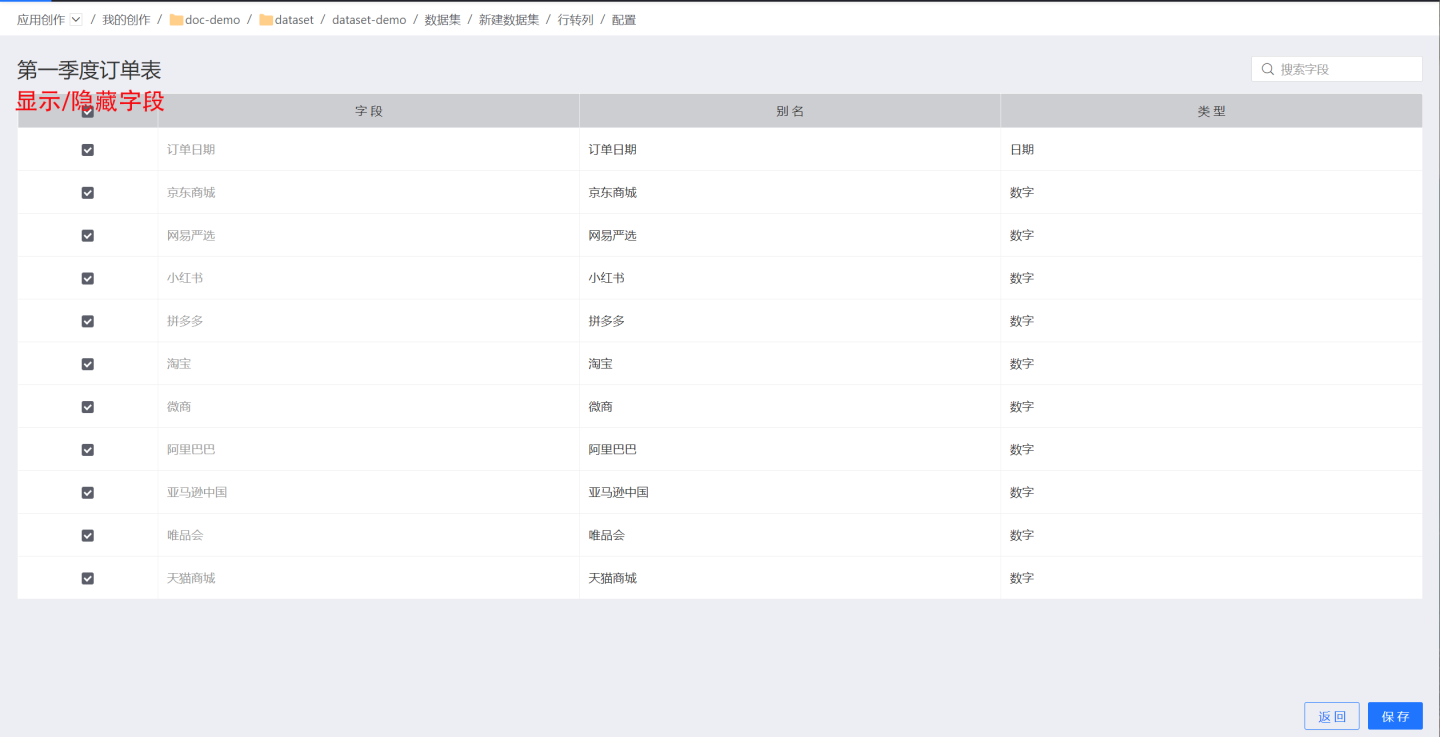
Description
- The column fields of the row-to-column dataset are divided into two parts: one part consists of the column fields from the original data, i.e., the fields added in the grouping columns, and the other part consists of the new columns generated by the row-to-column transformation.