KPI Chart
KPI stands for Key Performance Indicator. KPI charts visually display indicator statuses, helping users quickly understand the current value and status of the indicators.
The following section introduces how to configure a KPI chart.
KPI Chart
Single-Metric KPI Chart
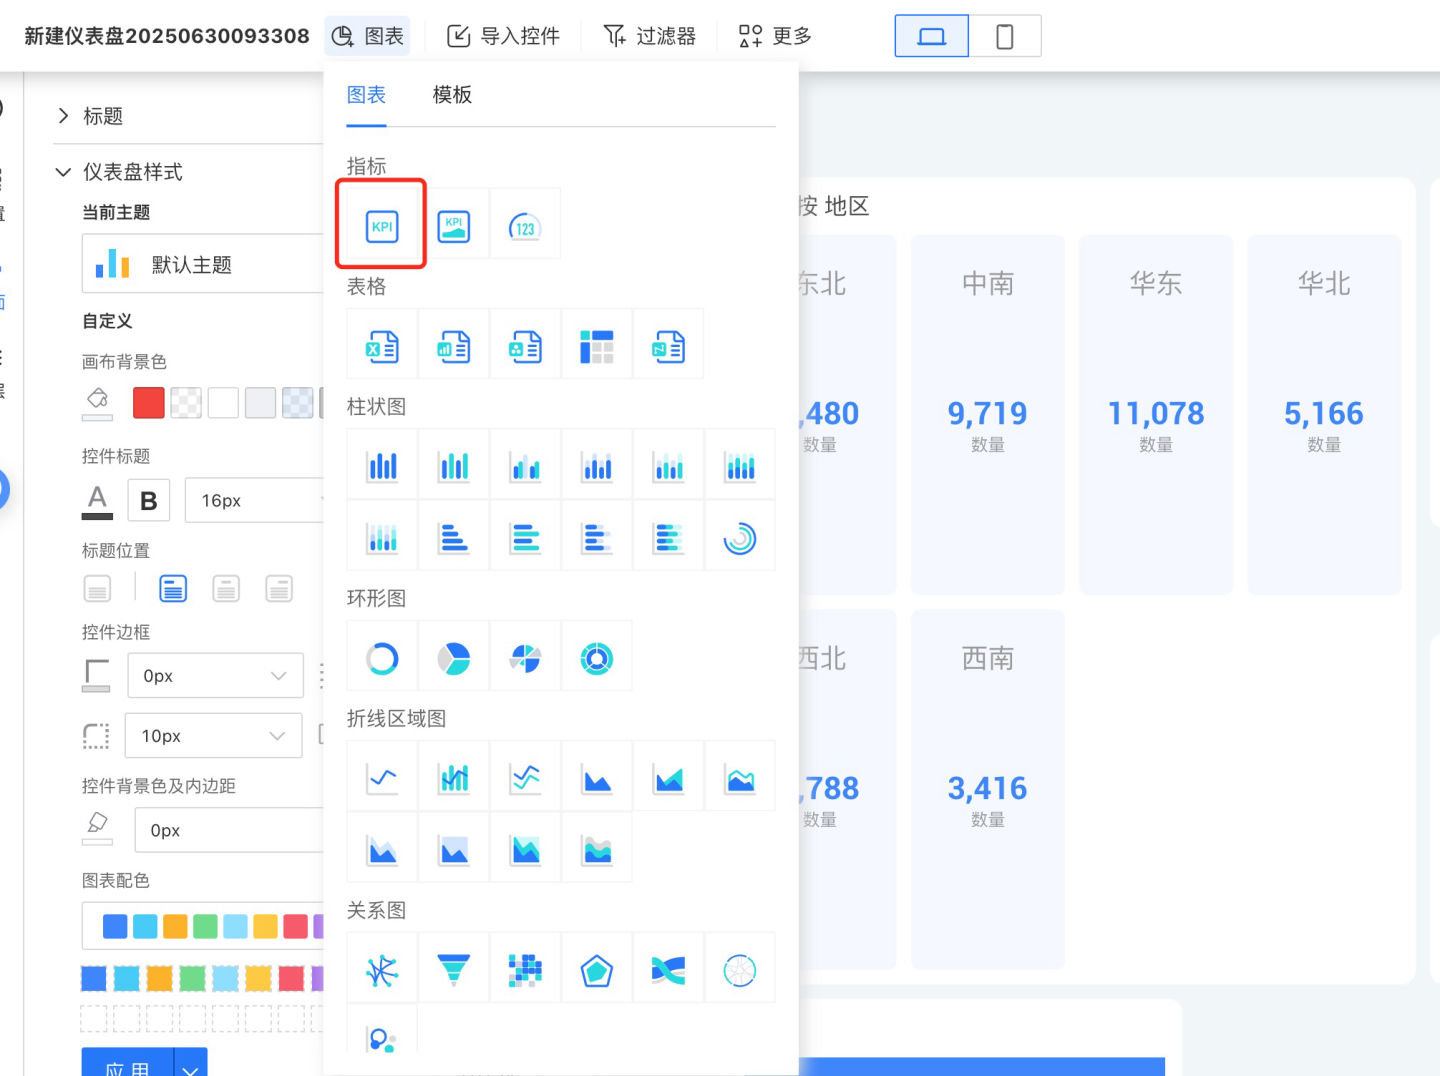
Click to create a new chart widget, select the data source and dataset, and choose KPI as the chart type.
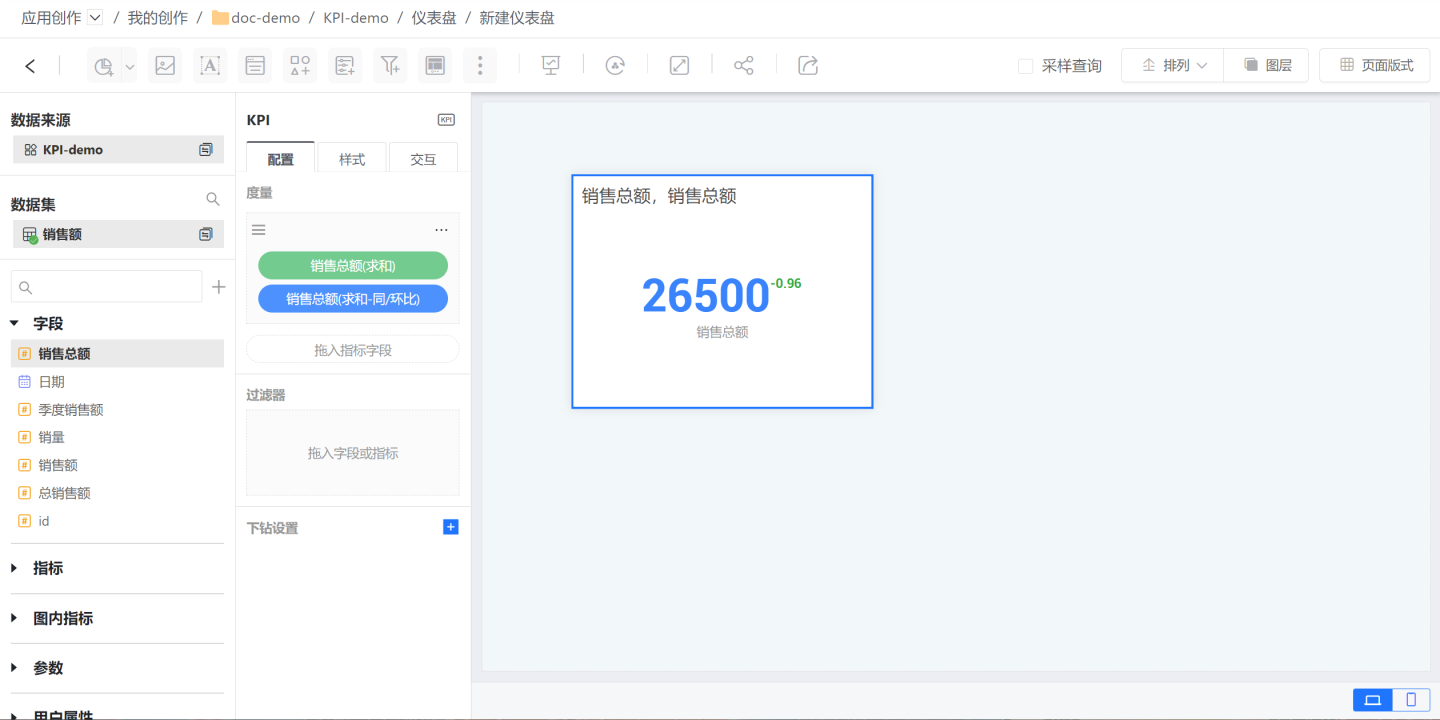
Drag the metric field "Total Sales" into the metric area, and drag the comparison metric field "Total Sales" as well to calculate the year-over-year or month-over-month change in total sales.
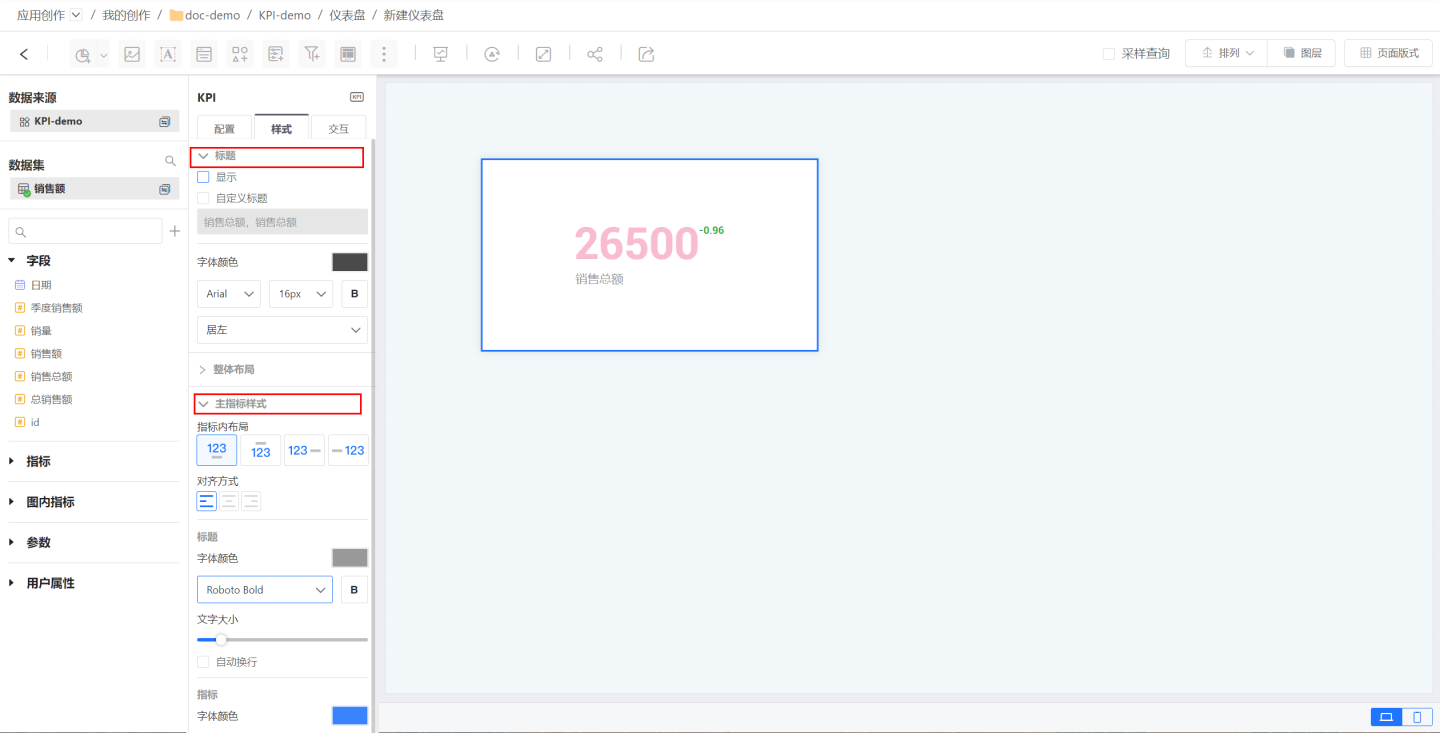
Adjust the KPI style. Set the title, main metric style, and comparison metric style.
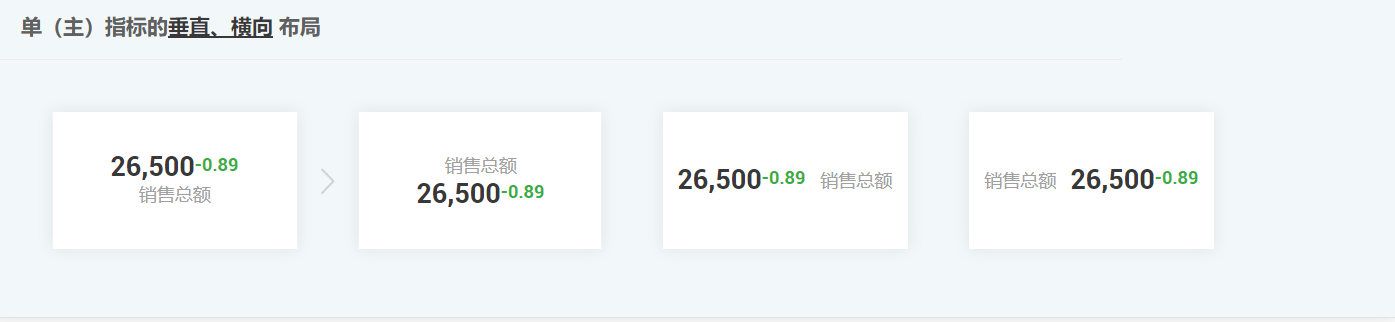
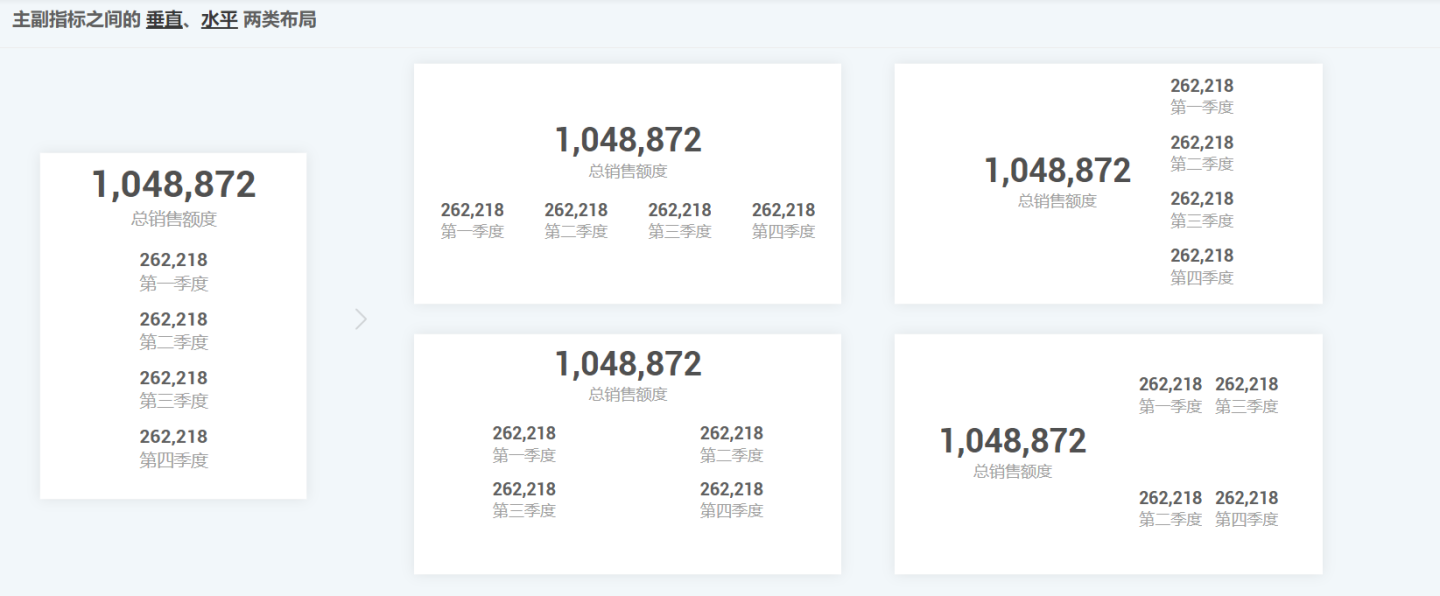
A simple KPI chart is now complete. For single-metric KPIs, you can use either vertical or horizontal layouts.
Multi-Metric KPI Chart
A multi-metric KPI chart contains multiple metrics within a single chart. In this case, the first metric is the primary metric, while the others are secondary metrics. You can change the order of the metrics to adjust which is the primary or secondary metric.
The creation process for a multi-metric KPI chart is the same as that for a single-metric KPI chart. The difference is that a multi-metric KPI chart requires you to set the overall layout, as well as the styles for the primary and secondary metrics. Common multi-metric layout styles include the following:
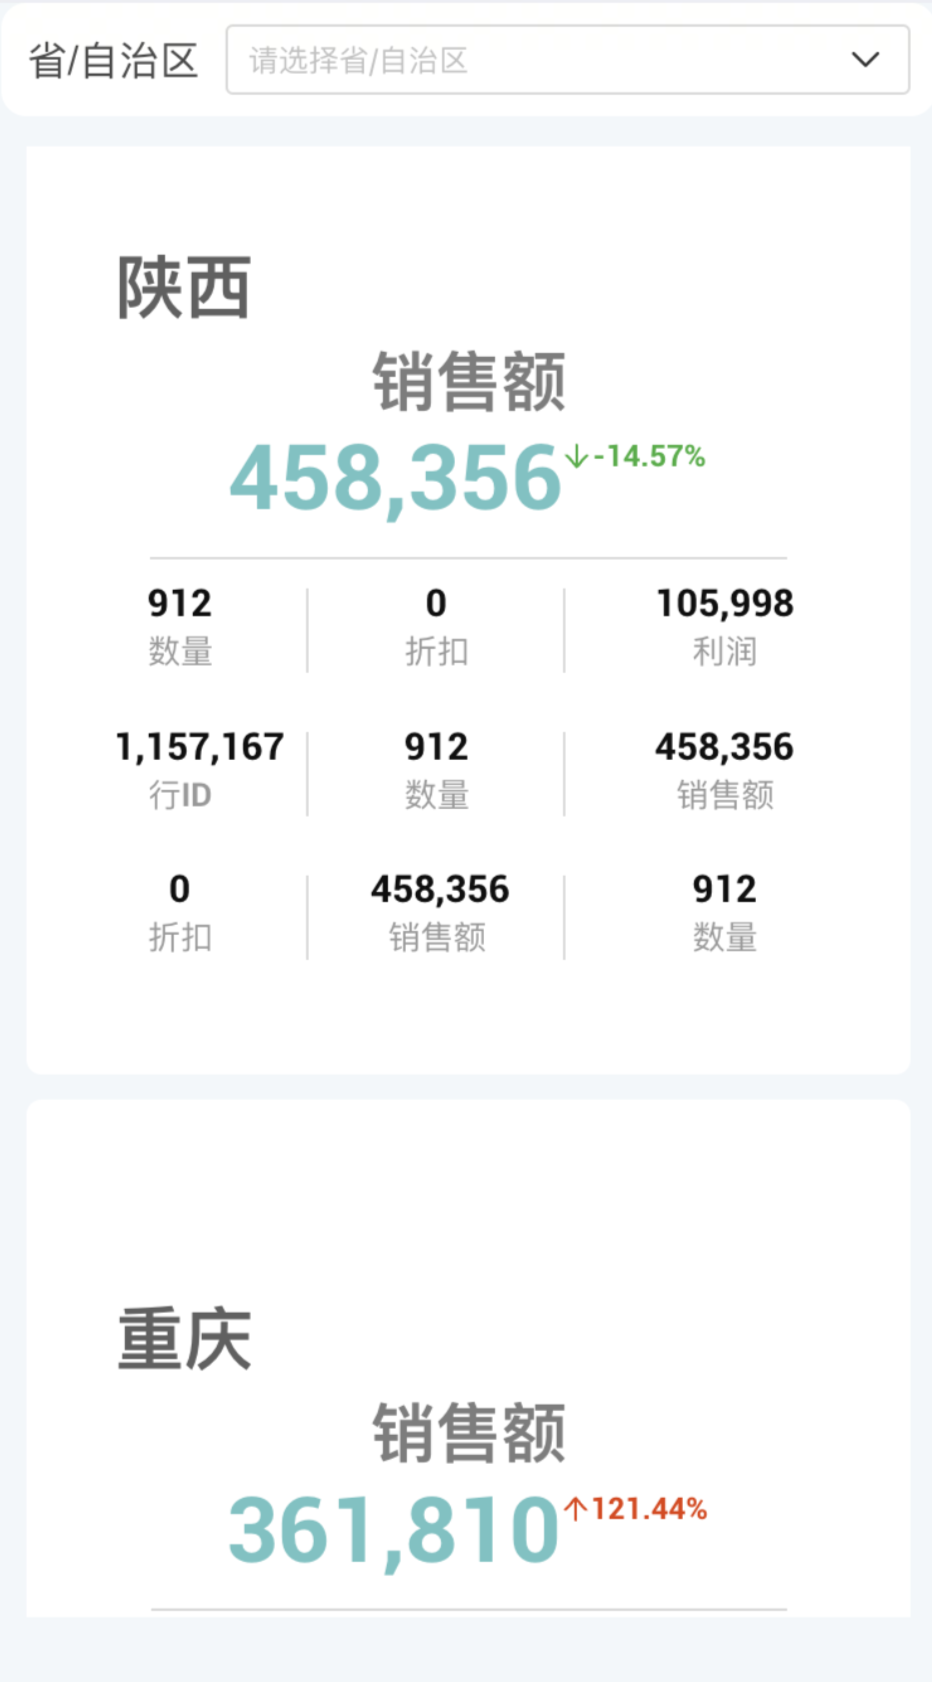
KPI Chart Supports Dimension Grouping
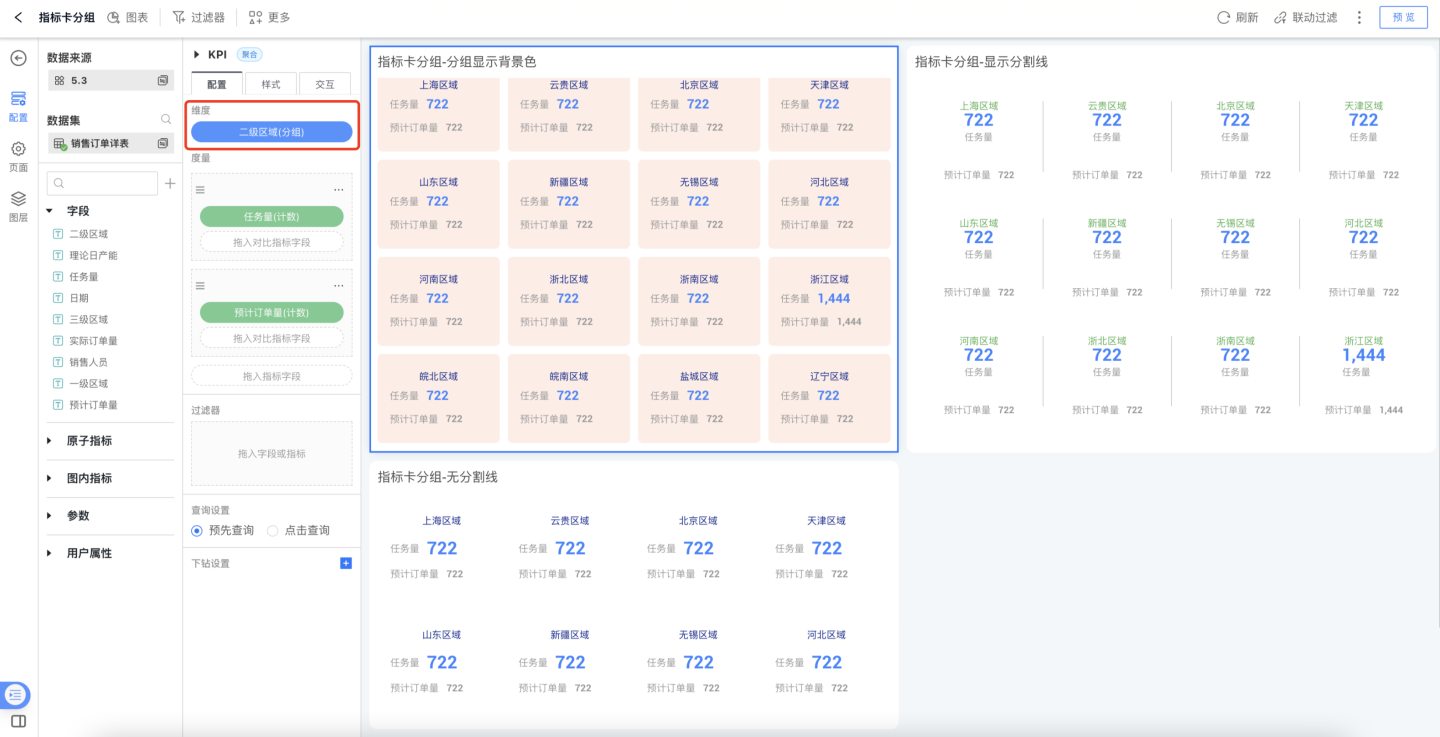
In analytical scenarios, there is often a need to compare KPI metrics horizontally under a certain dimension, such as viewing metrics by city. To meet this requirement, KPI charts now support displaying grouped by dimension. You only need to add a dimension field, and with a single step, you can achieve grouped comparison display.
After KPI grouping, you can configure the style of the grouped metric blocks in KPI Chart > Style > Metric Block Layout.
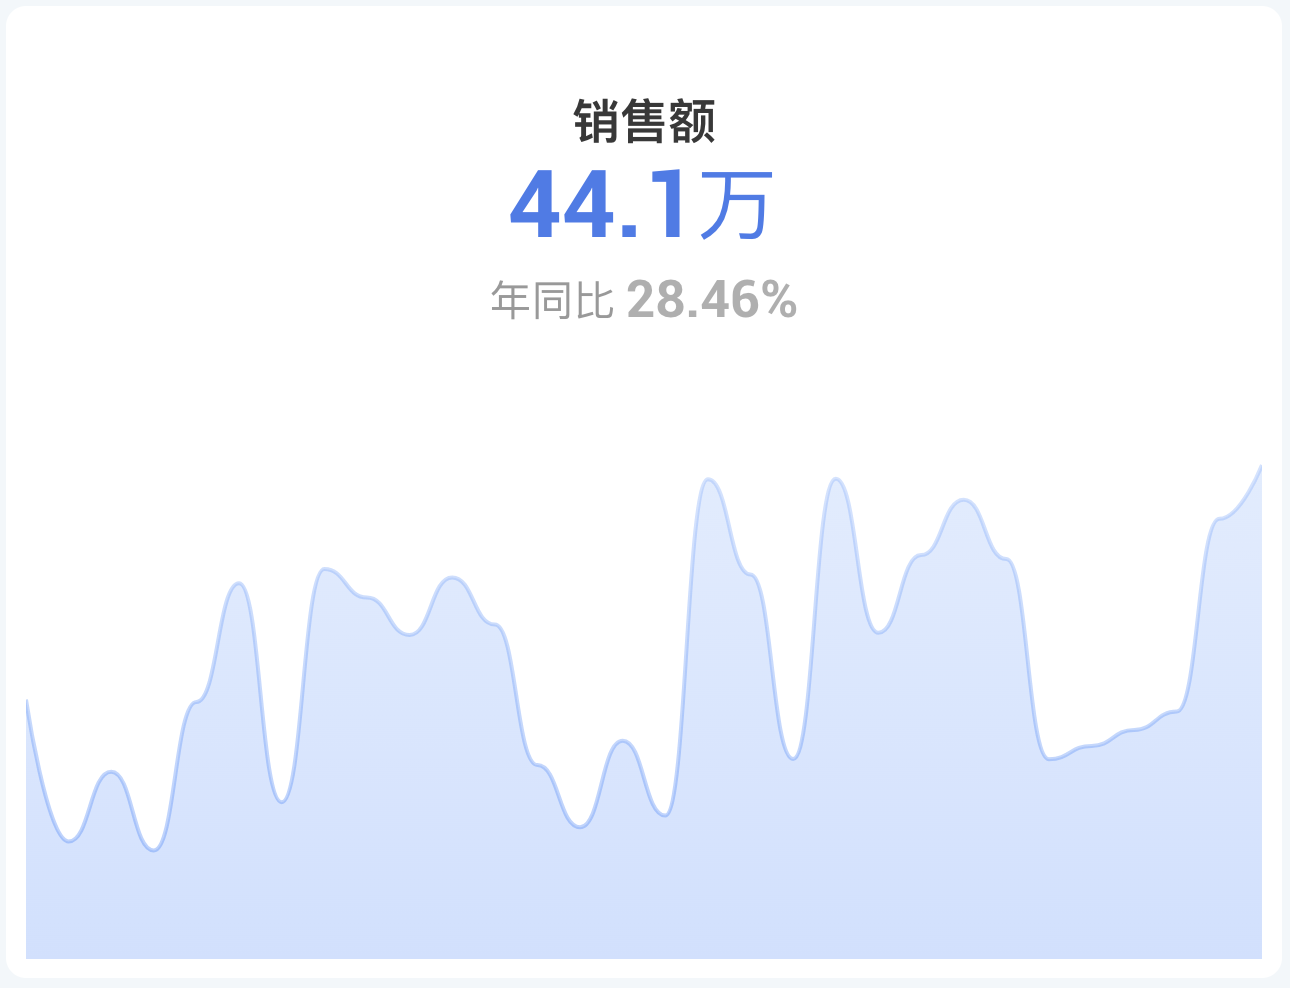
Metric Trend Card
The metric trend card allows you to view the metric value at the latest date node while also displaying the time trend of the metric.
KPI Control Interactions
KPI charts support interactive operations such as Linked Filtering, Drill Down, and Jump with other controls. Please click here for detailed interaction settings instructions.
Tip
After enabling dimension grouping for KPI, it supports linked filtering operations with other charts by dimension.