System Debugging
The system debugging page supports real-time debugging functionality. When enabled, it records logs from various system modules for developers to use in problem diagnosis.
Types and Levels of Debug Logs
During system debugging, logs related to the following modules are recorded, including:
- Global Logs
- Metadata Database Operation Logs
- Scheduled Task Logs
- Request Filter Logs
- User Authentication Component Logs
- Database Connection Pool Logs
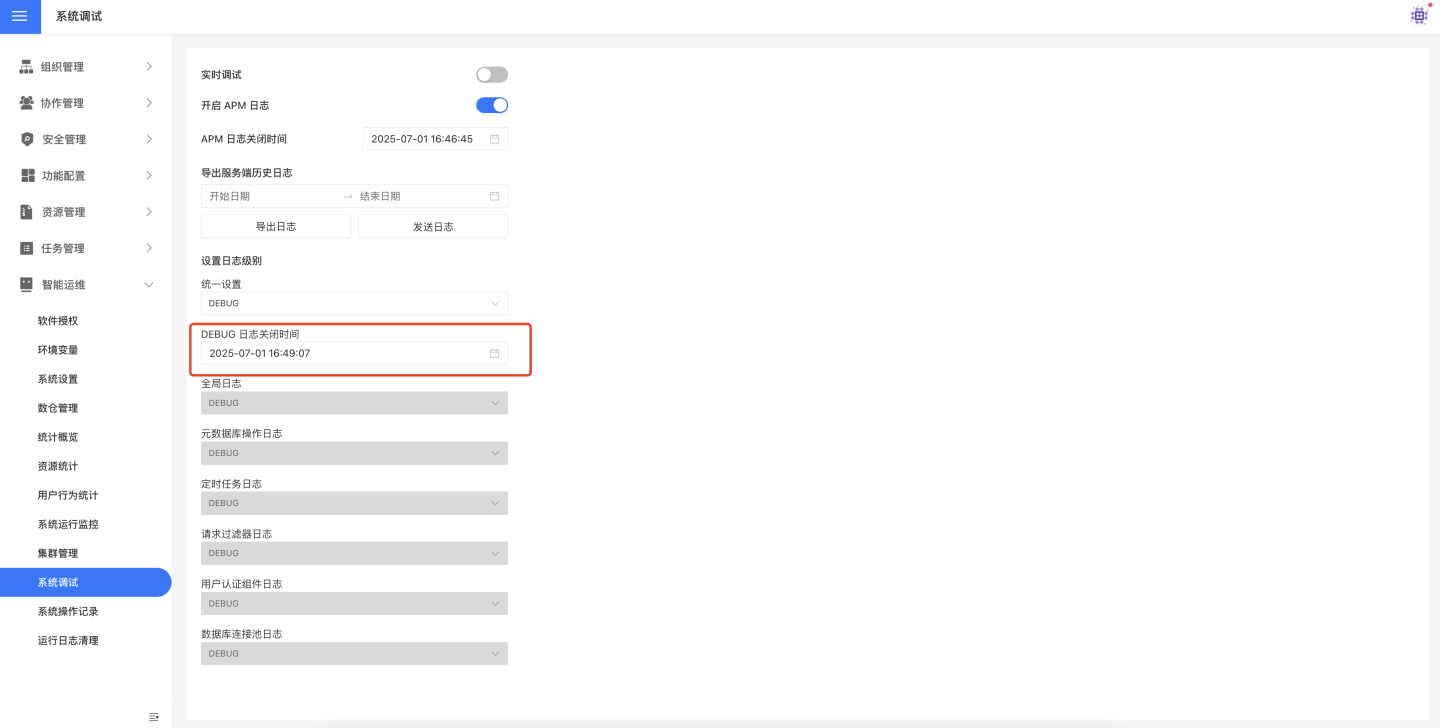
Each type of log can be set to one of five levels: INFO, WARN, ERROR, DEBUG, TRACE. These levels are suitable for different debugging scenarios and support unified settings across all modules. DEBUG logs can be configured with a unified shutdown time. 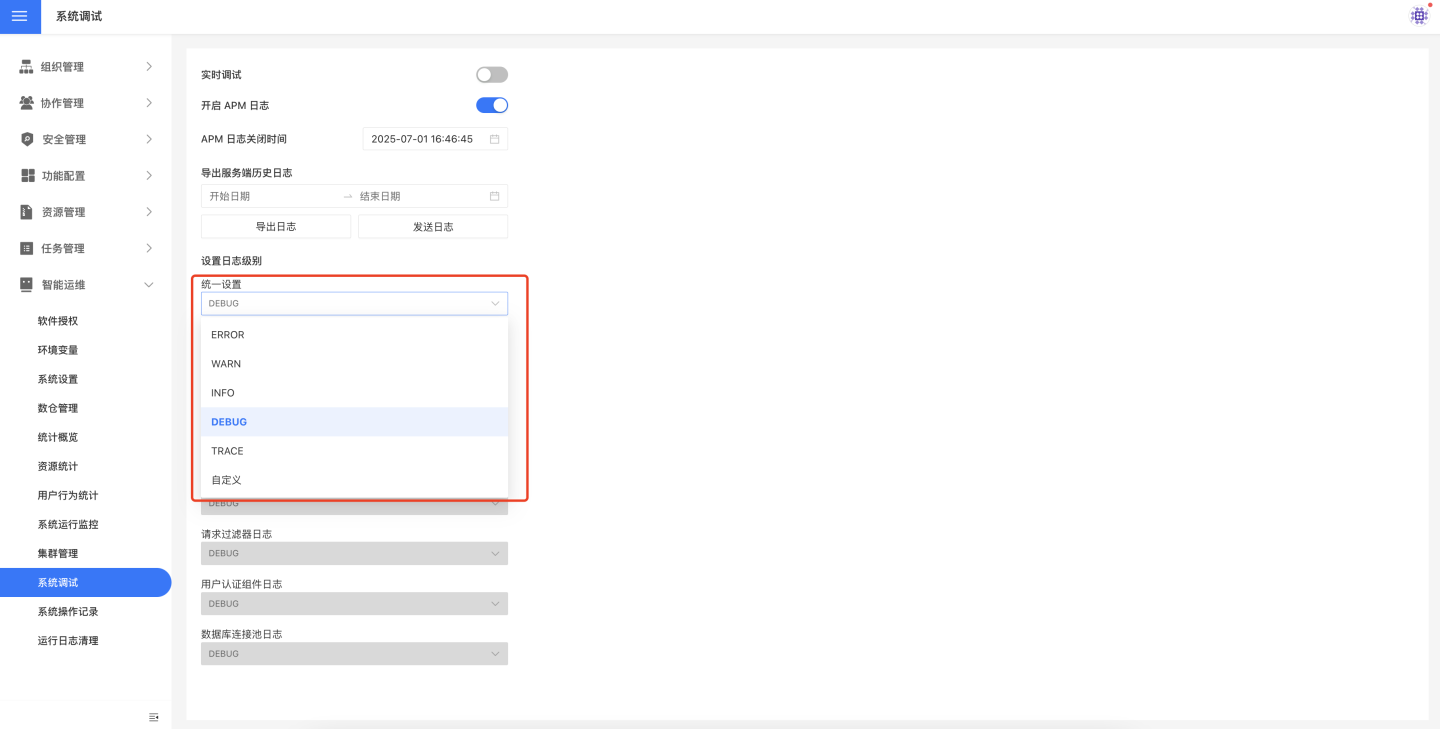
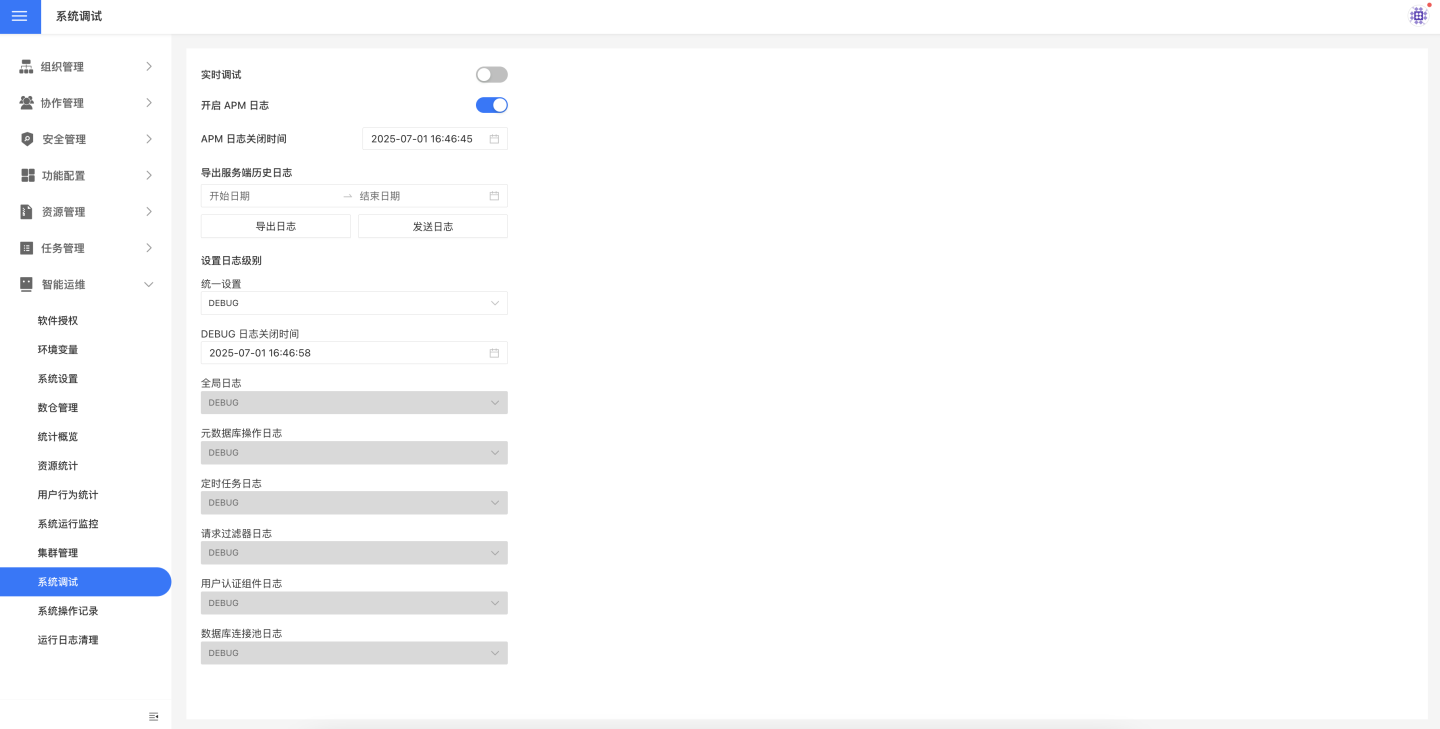
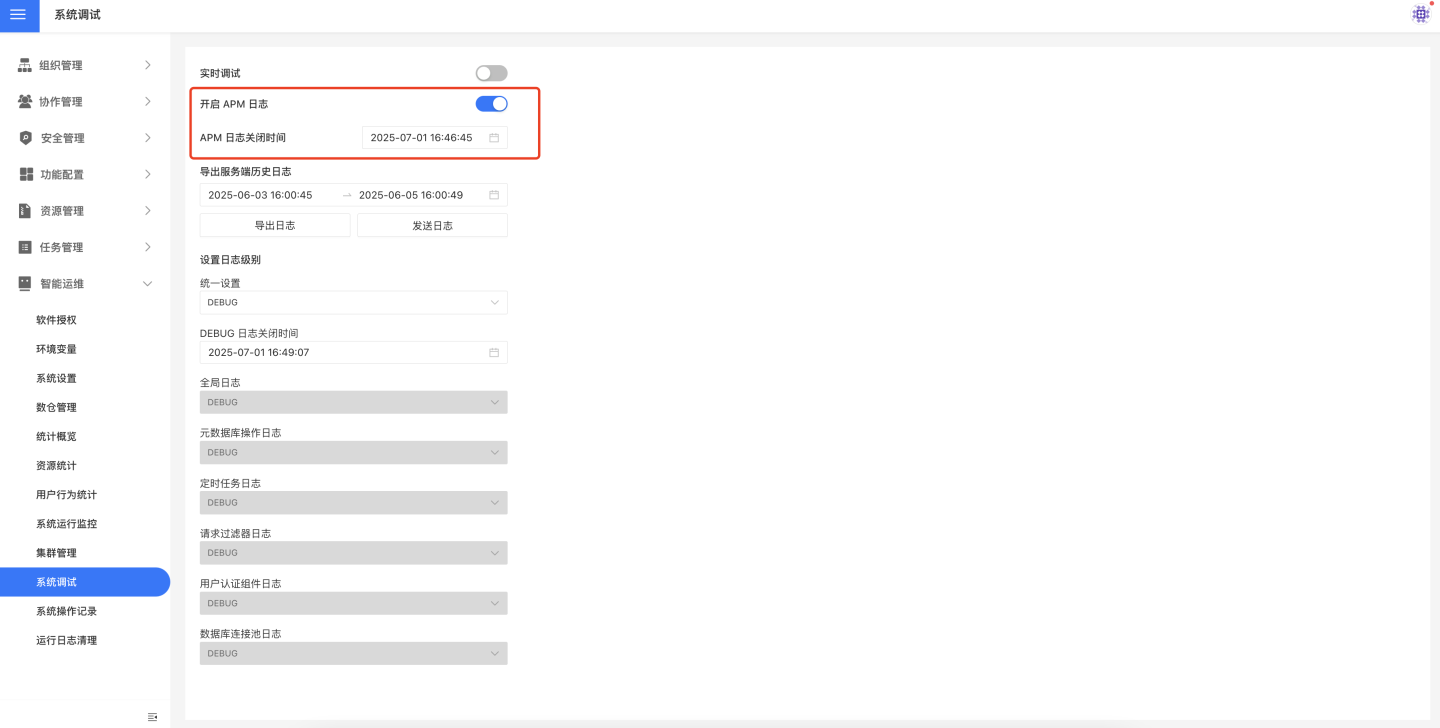
Enable APM Logs
Monitor system performance and health status to identify performance bottlenecks, abnormal trends, and user experience issues. Once enabled, you can set an automatic shutdown time.
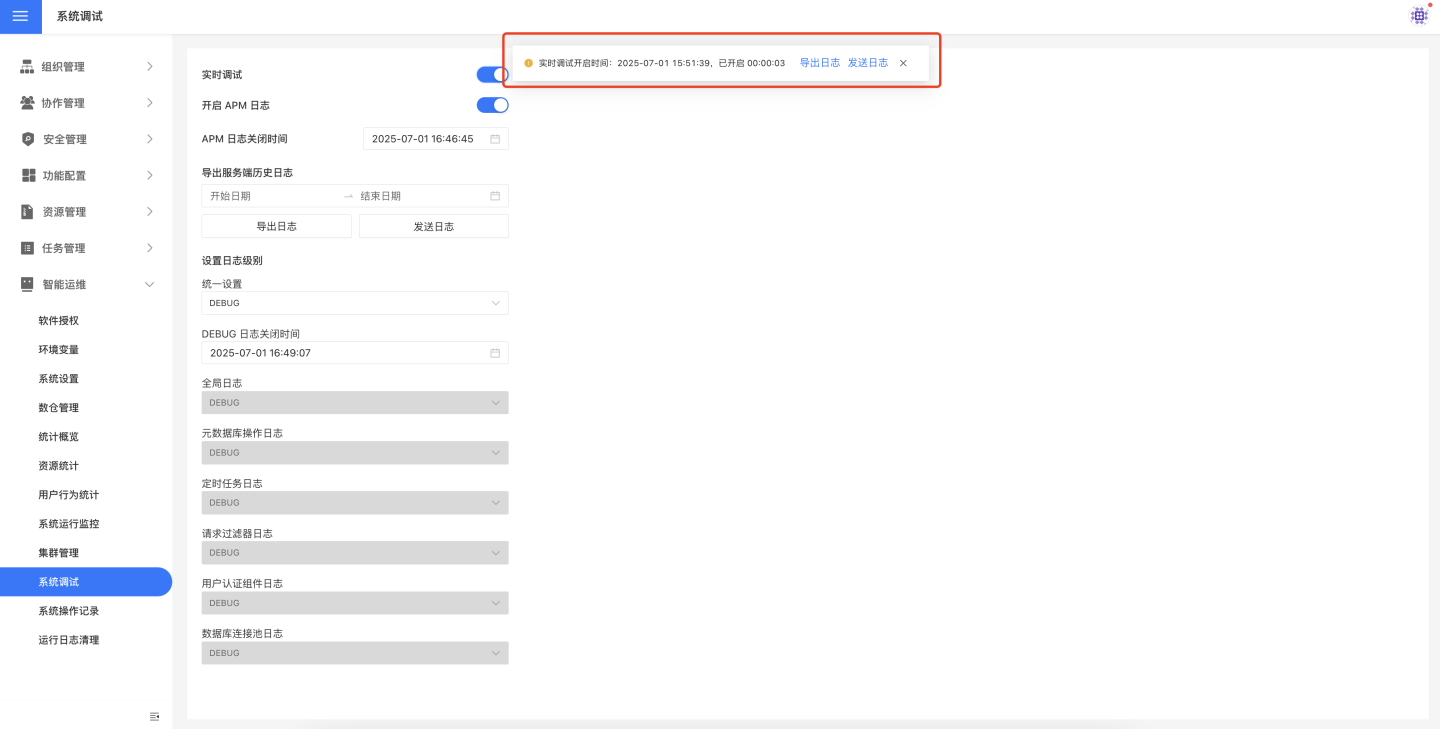
Real-time Debugging
When the real-time debugging switch is turned on, the system starts recording debugging-related logs. The top of the page displays the start time and duration of debugging. Once the operation is complete, you can click Export to download the logs locally. After exporting, you can click Exit to close real-time debugging.
Tip
- When the real-time debugging switch is turned on, the system starts recording logs immediately. Therefore, please set the log levels properly before enabling it.
- If you close real-time debugging without exporting the logs during the operation, you can export them from the historical logs.
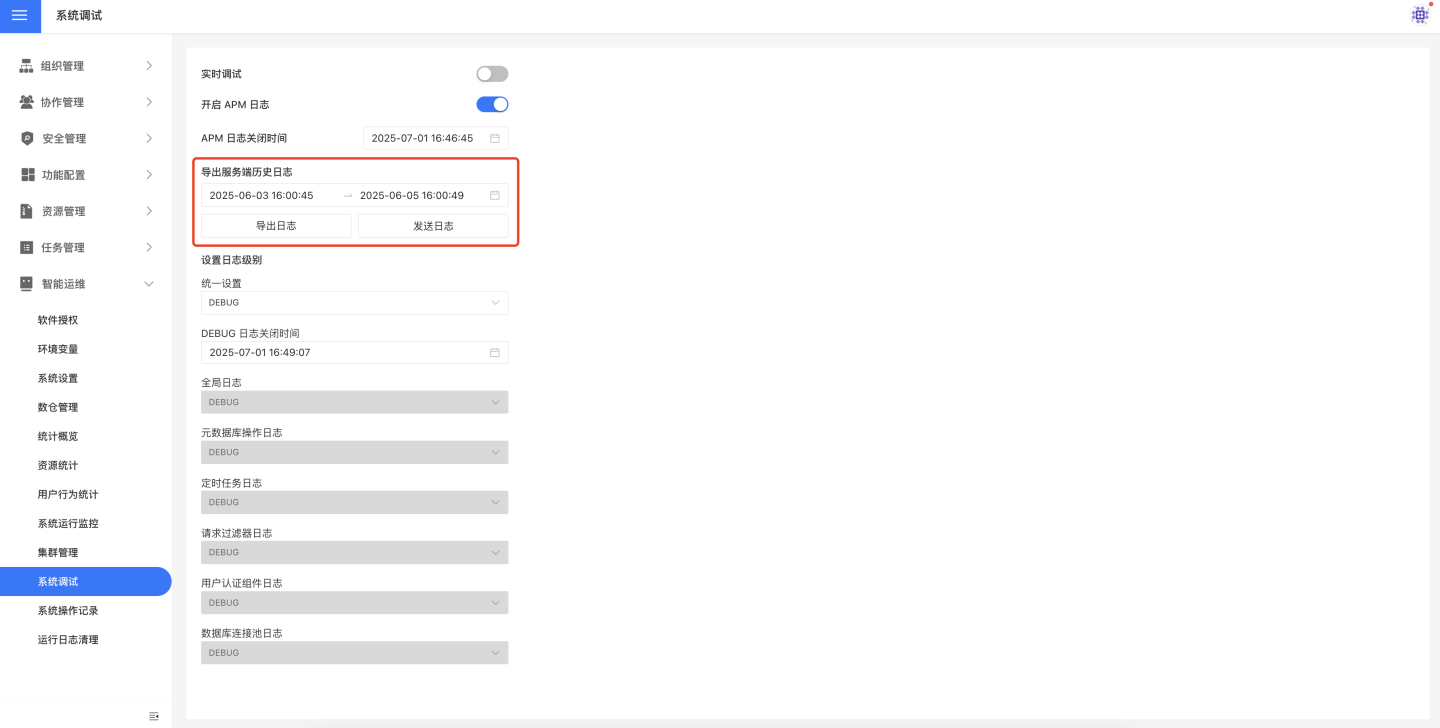
Export Server-Side Historical Logs
The system supports exporting historical debugging information. Click the calendar icon to select the start date and end date, then click Export to download the debugging logs for the selected date range. If the real-time debugging feature was not enabled during the selected date range, the system will display a prompt message.