Custom Charts
HENGSHI SENSE supports dozens of chart types, including bar charts, pie charts, line charts, relationship graphs, scatter plots, heat maps, tables, maps, and more. Each chart type offers a variety of rich presentation forms, meeting the needs of most data analysis scenarios. However, in certain specific situations, users may have special, customized chart requirements. To address this, HENGSHI SENSE has introduced the Custom Chart feature, allowing users to write their own JS code to achieve chart customization.
Creating a Custom Chart
Custom charts differ from other charts in that, while other charts are created via drag-and-drop, custom charts are implemented by writing JS code. Therefore, the creation process is also different. The following describes the process of creating a custom chart.
Design the chart.
Before creating a custom chart, please design the chart first. This includes chart style, dimensions, measures, interaction operations, and other relevant information.
For example, if a chart displays the sales of various product categories for each month of the year, a single chart can show twelve pie charts. Drag the product category into the dimension, and drag the sales data for each month into the measures.Create a JS chart.
After completing the chart design, proceed to the coding phase. In the App's dashboard creation interface, click New Chart and select JS Chart.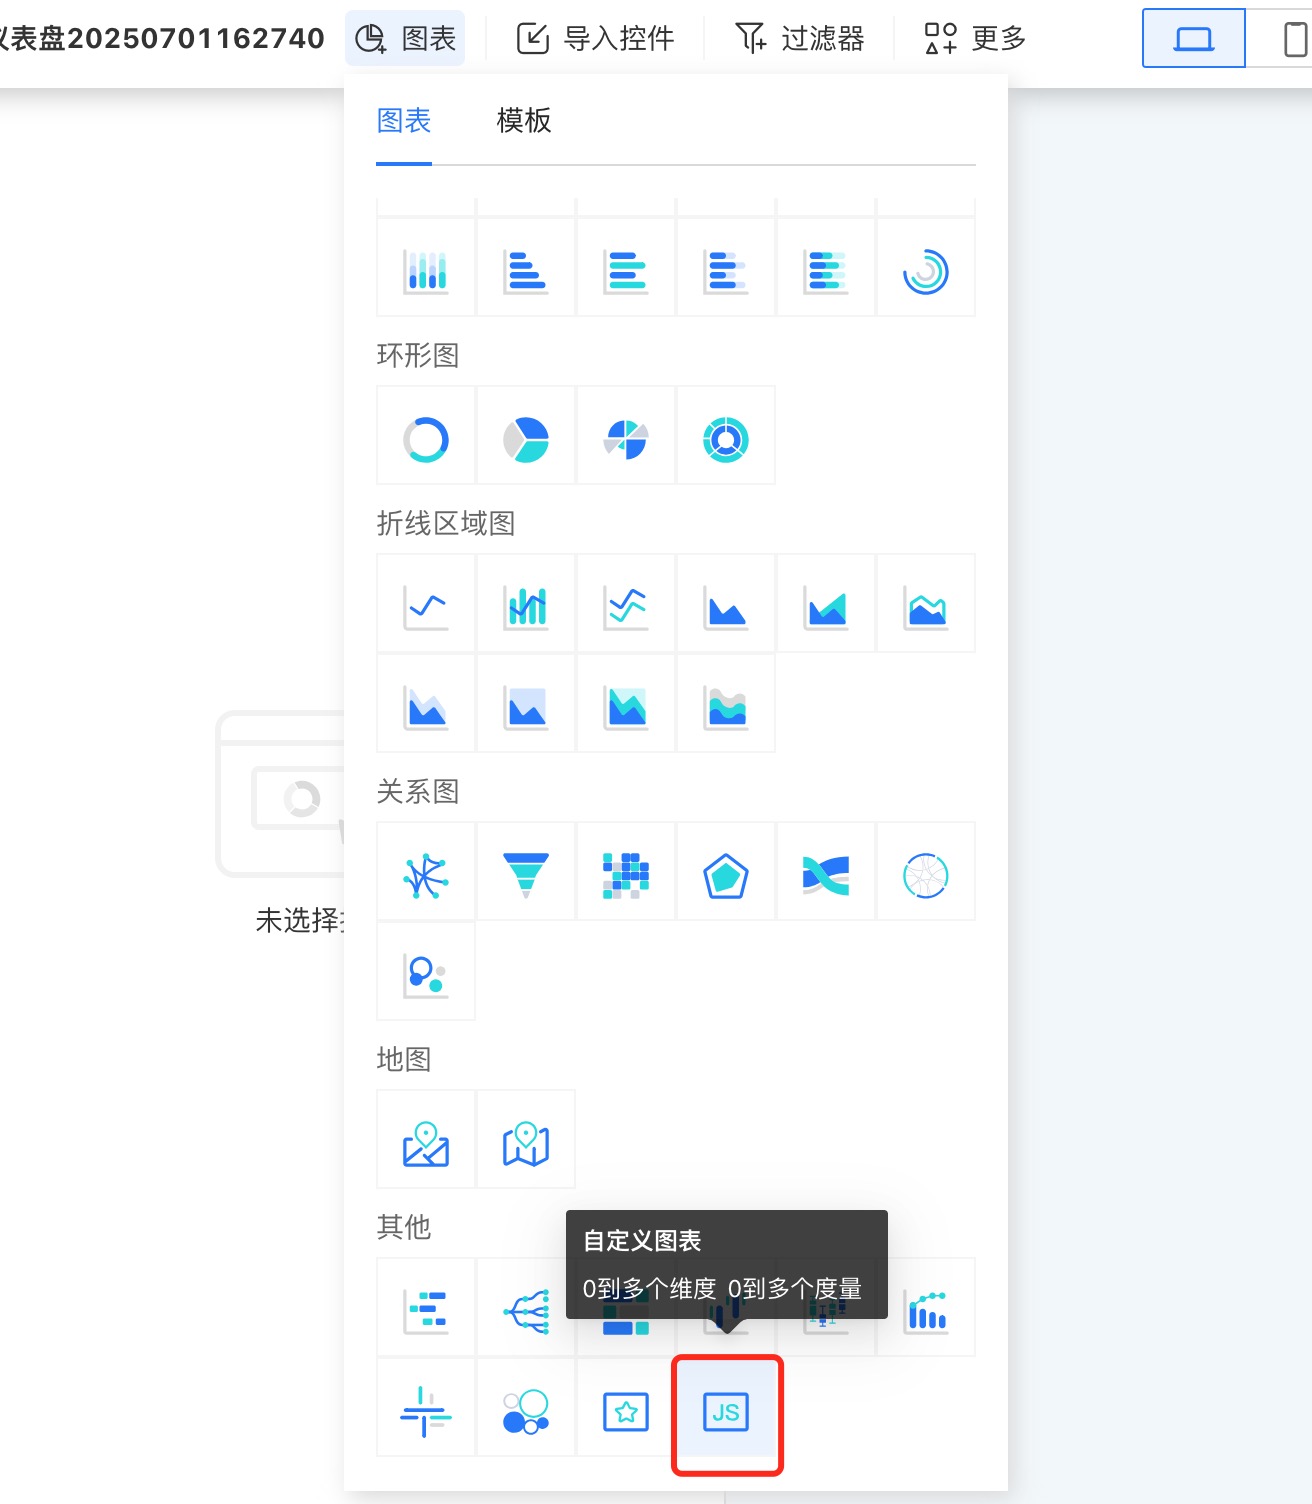
Write code.
In the style section, click Write Code to enter the code editor. Please refer to the Custom Chart API for the available API interfaces.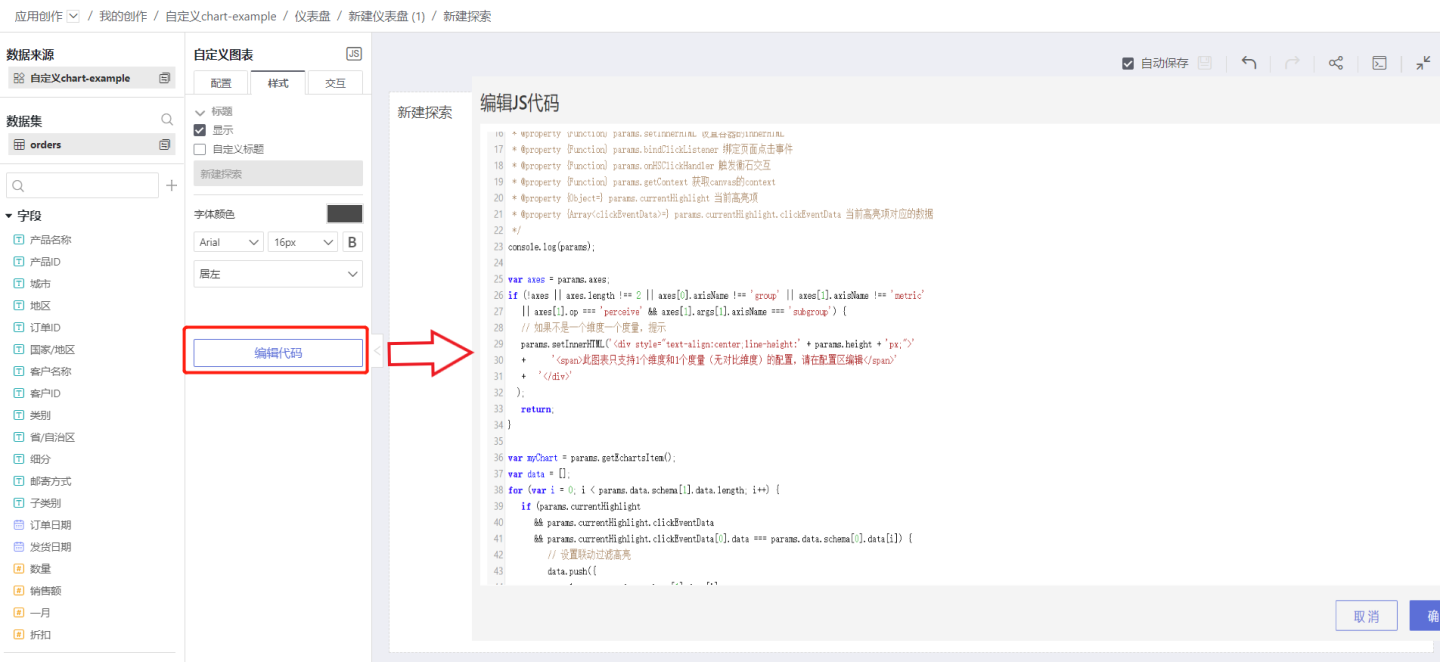
Debug.
After implementing the code, drag in the relevant dimensions, measures, etc., and check the chart's display style and interaction operations. Continuously debug the code until the chart meets the design requirements.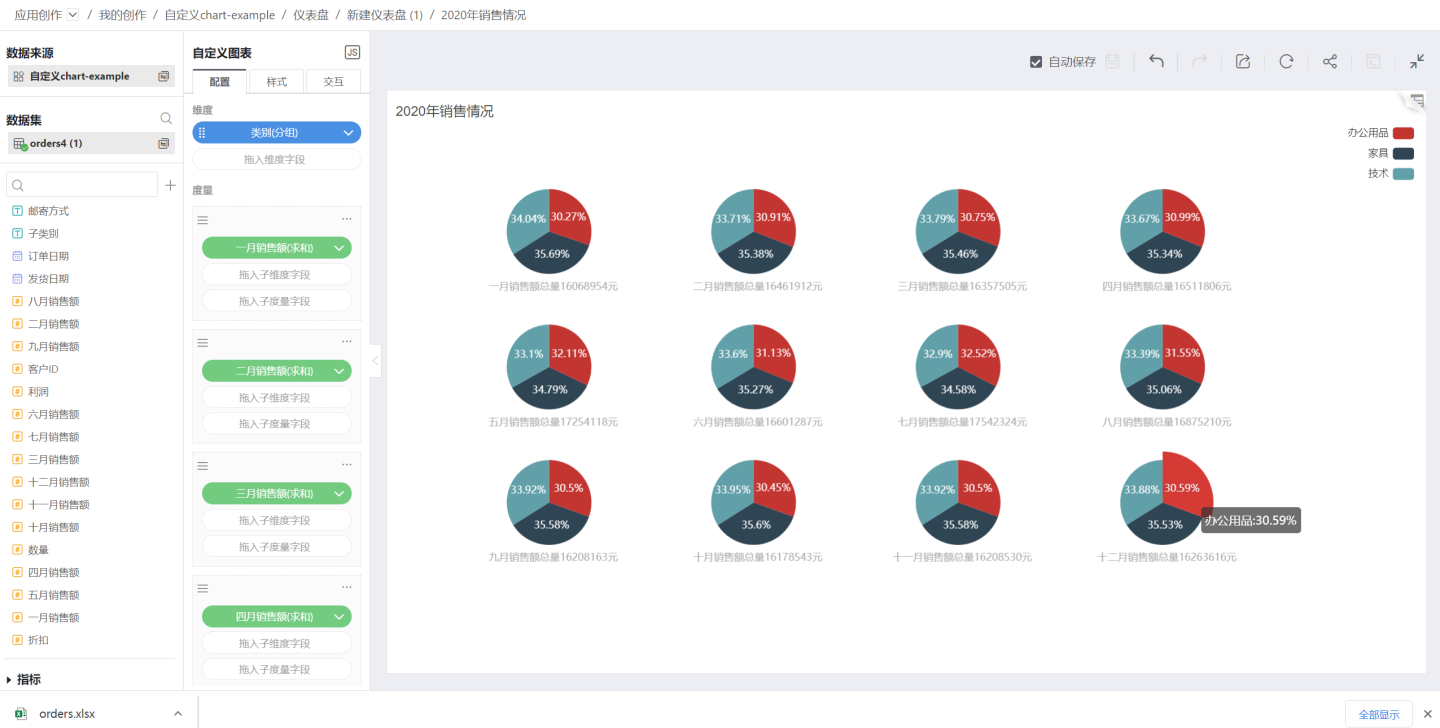
Tip
- Please pay attention to the versions of third-party libraries supported in custom charts. The chart's functionality should be implemented within the supported version range.
Custom Chart Interactions
Custom charts support in-chart filters, drill-down, and interactions with other charts.
Custom Chart Examples
This article provides several examples of custom charts, which you can download and try out directly.
Example 1
This example dynamically displays the changes in average age per capita alongside GDP from 1800 to 2015, allowing you to view data for any given year. This example is implemented using ECharts third-party related functions. The effect is shown in the figure below.  Example 1 Data and Code.zip
Example 2
This example demonstrates a 3D rotation animation scene of a world map, suitable for large-screen displays. The example is implemented using relevant third-party D3 functions. The effect is shown below.  Example 2 Data and Code.zip
Example 3
Dynamic leaderboard, dynamically displays data within a specified time period, widely applicable. Online demo: Online demo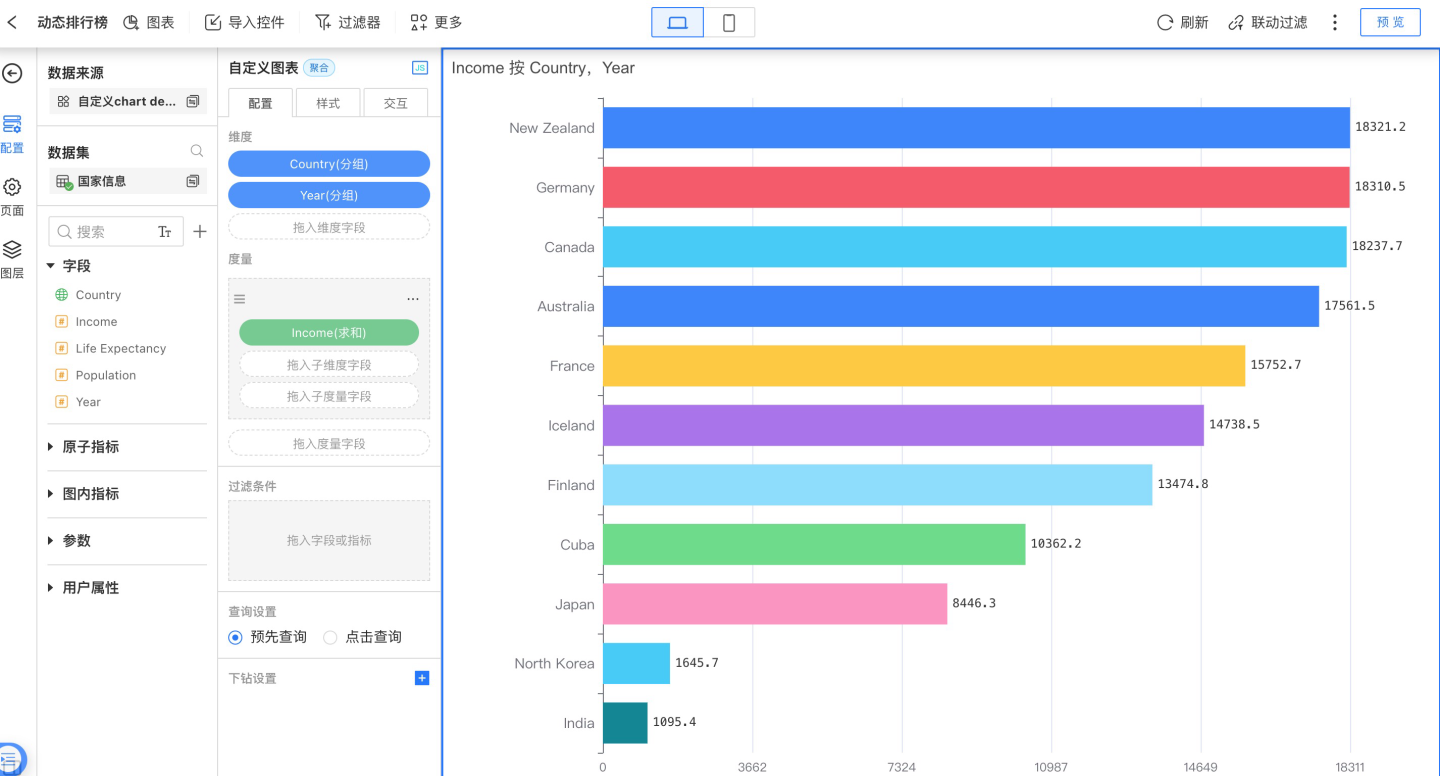 Example 3 Data and Code.zip
Example 4
Periodic Table, implemented with Three.js.
Online demo: Online Demo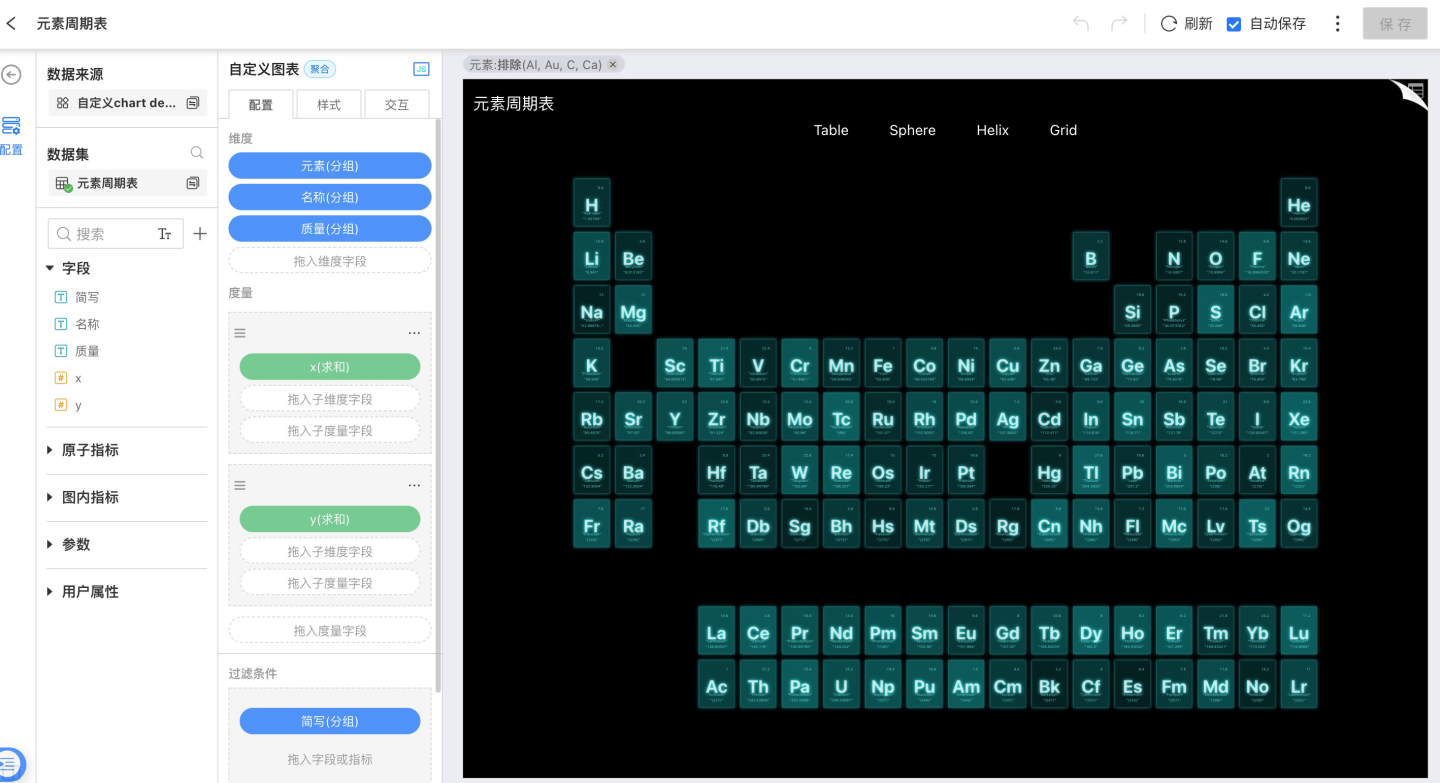
Example 4 Data and Code.zip
Example 5
3D bar chart, implemented using EchartsGL.
Online demo: Online Demo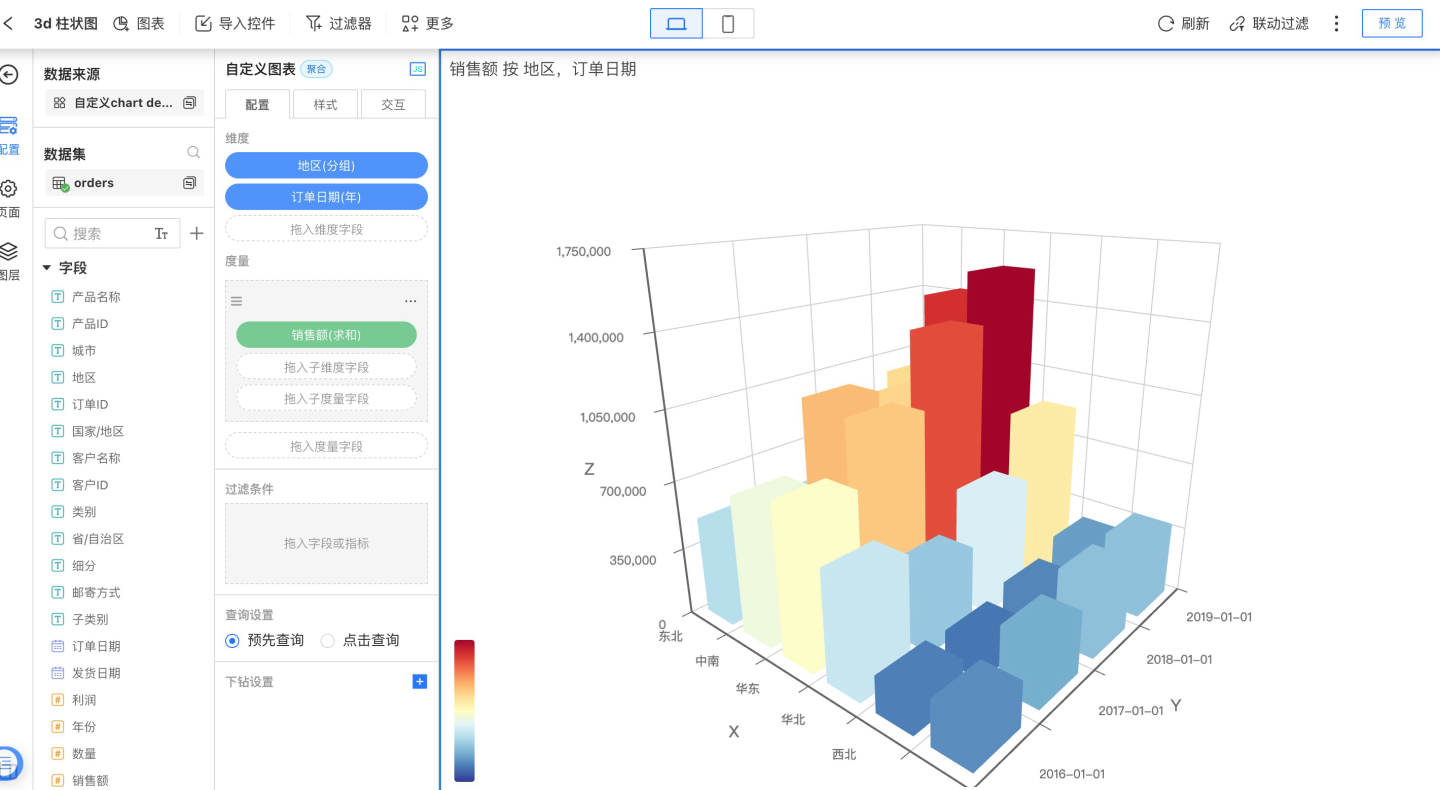
Example 5 Data and Code.zip
Custom Chart API
Below are the APIs provided for custom charts and their usage instructions.
params.axes
- Function Description Axis configuration in the chart, corresponding to the dragged axes. The axisName for dimensions is 'group', and for measures is 'metric'.
- Parameters None.
- Example
params.axes[0].axisNameparams.data
Function Description The data returned by the interface, corresponding to the axes that have been dragged in.
params.data.data is the raw data returned by the interface.
params.data.schema returns the preliminarily processed data, where dataUniq is deduplicated and sorted according to the configuration.
Parameters None.
Example
data_Country = params.data.schema[3].dataUniq;params.width
- Function Description The width of the container.
- Parameters None.
- Example
const width = params.width;params.height
- Function Description The height of the container.
- Parameters None.
- Example
const height = params.height;params.getD3
- Function Description Retrieves the D3 utility library. The currently supported version is 7.0.1.
- Parameters None.
- Example
const d3 = params.getD3();params.getEcharts
- Function Description Retrieves ECharts. The currently supported version is 4.9.
- Parameters None.
- Example
var EChart = params.getEcharts();params.getEchartsItem
- Function Description Retrieves the ECharts instance.
- Parameters None.
- Example
var myChart = params.getEchartsItem();params.getThree
- Function Description Retrieves Three.js. The currently supported version is 0.132.2.
- Parameters None.
- Example
const THREE = params.getThree();params.getTween
- Function Description
Retrieves Tween.js. The currently supported version is 18.6.4. - Parameters
None. - Example
const TWEEN = params.getTween();params.createElement
Function Description
A method for creating elements.Parameters
{string} strReturn Value
{HTMLElement}Example
var divElement = params.createElement('div');params.appendChild
- Function Description Adds a DOM element to the container.
- Parameters An element of type HTMLElement.
- Example
var divElement = params.createElement('div');
params.appendChild(divElement);params.getParentDOM
- Function Description Retrieves the parent element, up to the container node.
- Parameters An element of type HTMLElement.
- Return Value An element of type HTMLElement or null.
- Example
var divElement = params.createElement('div');
params.appendChild(divElement);
params.getParentDOM(childElement); // Returns divElementparams.setInnerHTML
Function Description
Sets the container's innerHTML.Parameter
The HTML fragment to be set in the container.Example
if (!axes || axes.length !== 2 || axes[0].axisName !== 'group' || axes[1].axisName !== 'metric') {
  // If there is not one dimension and one metric, show a prompt
  params.setInnerHTML(
    '<div style="text-align:center;line-height:' + params.height + 'px;">'
      +    '<span>This chart only supports a configuration of 1 dimension and 1 metric. Please edit in the configuration area.</span>'
      +  '</div>'
  );
  return;
}clickOptions
Function Description
Click event.Parameters
* @property {string} className  The className of the current element for the click event
* @property {string} id The id of the current element for the click event
* @property {number} x The horizontal relative position of the mouse within the container
* @property {number} y The vertical relative position of the mouse within the container
* @property {string} data The content of the attribute named data bound to the element- Example
None.
params.bindClickListener
- Function Description Binds a click event.
- Parameters
param {Function} clickHandler The handler function for page clicks, receives one parameter clickOptions- Example
params.bindClickListener(function(clickOptions) {
	if (clickOptions.data) {
    params.onHSClickHandler([{
      data: clickOptions.data,
      path: 0
    }]);
  }
})params.currentHighlight.clickEventData
- Function Description Click event data.
- Parameters
param {string} data  Dimension value
param {string | number} path Axis position corresponding to the dimension value, e.g.: 0 (the first axis); '1.1' (the second sub-axis of the second axis)- Example
for (var i = 0; i < params.data.schema[1].data.length; i++) {
  if (params.currentHighlight
    && params.currentHighlight.clickEventData
    && params.currentHighlight.clickEventData[0].data === params.data.schema[0].data[i]) {
    // Set linkage filter highlight
    data.push({
      value: params.data.schema[1].data[i],
      itemStyle: {
        color: '#6173c9'
      }
    });
  } else {
    data.push(params.data.schema[1].data[i]);
  }
}params.onHSClickHandler
- Function Description
Triggers HENGSHI interaction. - Parameters
param {Array<clickEventData>} clickData Data to be passed- Example
myChart.on('click', function (option) {
  params.onHSClickHandler([{
    data: option.name,
    path: 0,
  }])
});params.getContext
- Function Description Retrieves the background of the canvas.
- Parameters Parameter: Background type '2d' | 'webgl' | 'webgl2'
- Return Value
CanvasRenderingContext2D
WebGLRenderingContext
WebGL2RenderingContext- Example
var context = params.getContext('2d');
params.bindUnmountHandler
- Function Description params.bindUnmountHandler binds a method to be executed upon unmounting, such as unmounting components or clearing setTimeout, etc.
- Parameters None.
- Example
var timer = setInterval(function () {
  .......
}, 100);
params.bindUnmountHandler(function () {
  clearInterval(timer);
});