Metrics
Metrics are a series of standard data used to measure business performance. In business analysis, the truly dynamic part lies in the flexible definition of metric calculation logic. By managing this aspect centrally through formulas and enhancing the expressive power of metrics, it is possible to build a business metric system without extensive pre-computation.
Metrics include atomic metrics and business metrics. Atomic metrics involve metric definitions, where users select relevant business information fields in the dataset based on the business scenario during usage. Business metrics differ from atomic metrics; in addition to metric definitions, they also configure business-related information, such as dimensions and constraints related to the business. This forms metrics that represent specific business scenarios and have clear analytical contexts.
This document provides a detailed introduction to the process of creating metrics and related operations.
Indicator Creation
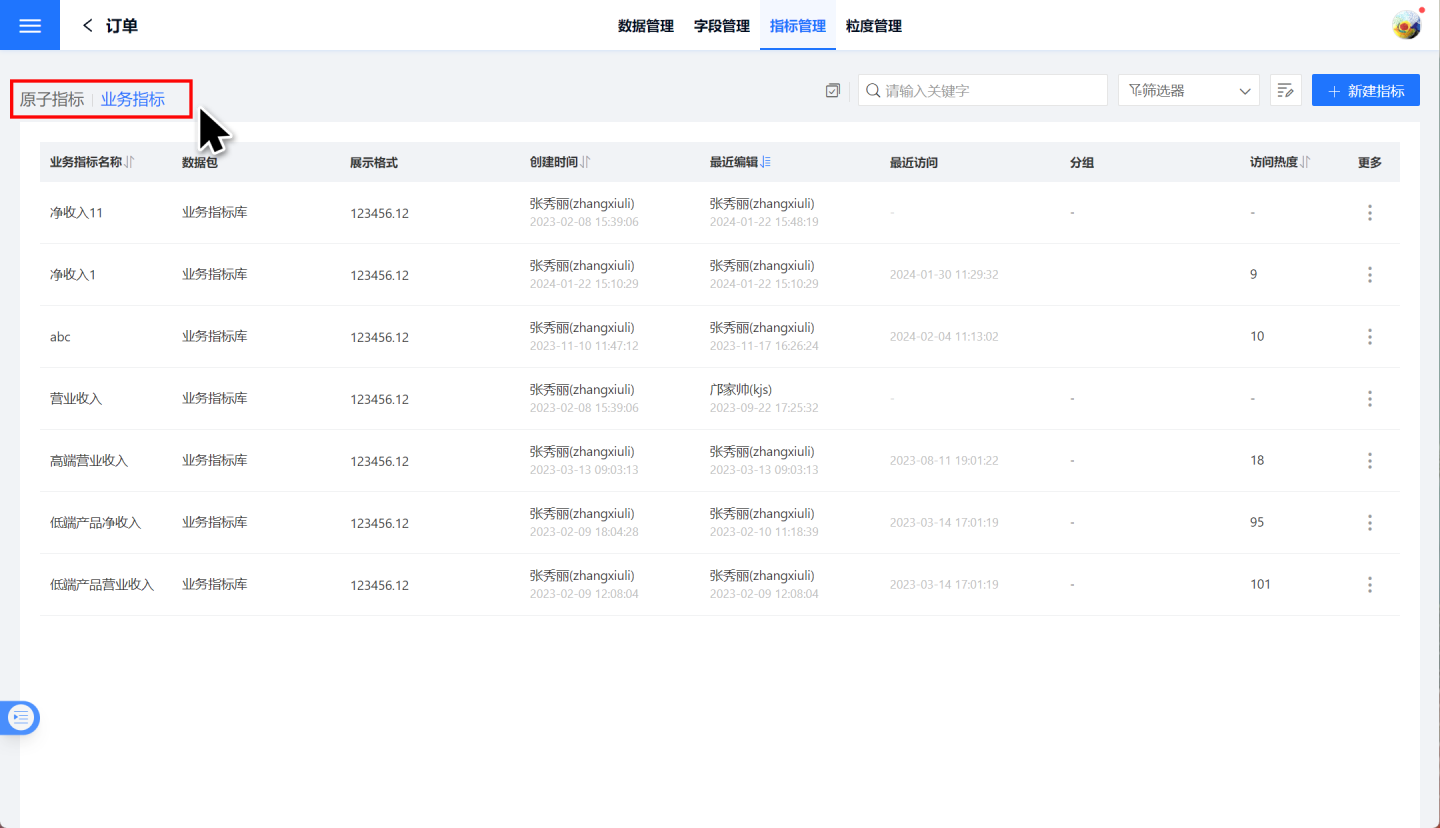
Indicator creation can be divided into two parts: indicator definition and business configuration. Atomic indicators only include indicator definitions, while business indicators include both indicator definitions and business configurations. Therefore, business indicators can also be considered as atomic indicators + indicator configurations. Both atomic indicators and business indicators are created and managed uniformly on the Dataset -> Indicator Management page.
Metric Definition
The process of defining metrics is relatively simple. Please follow the steps below to define a metric.
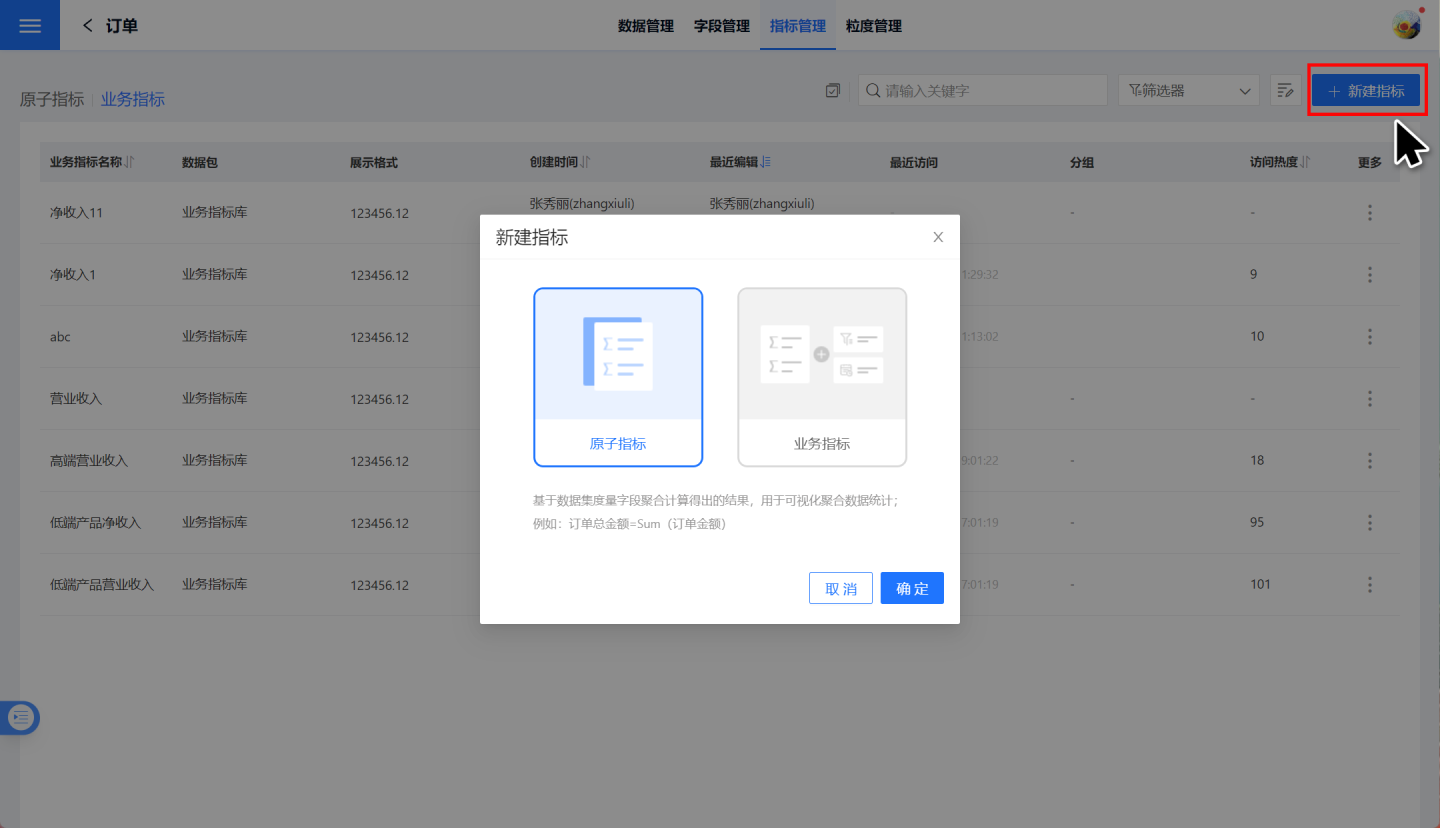
Under Dataset -> Metric Management, click "Create Metric" and select the metric type. Here, choose Atomic Metric.
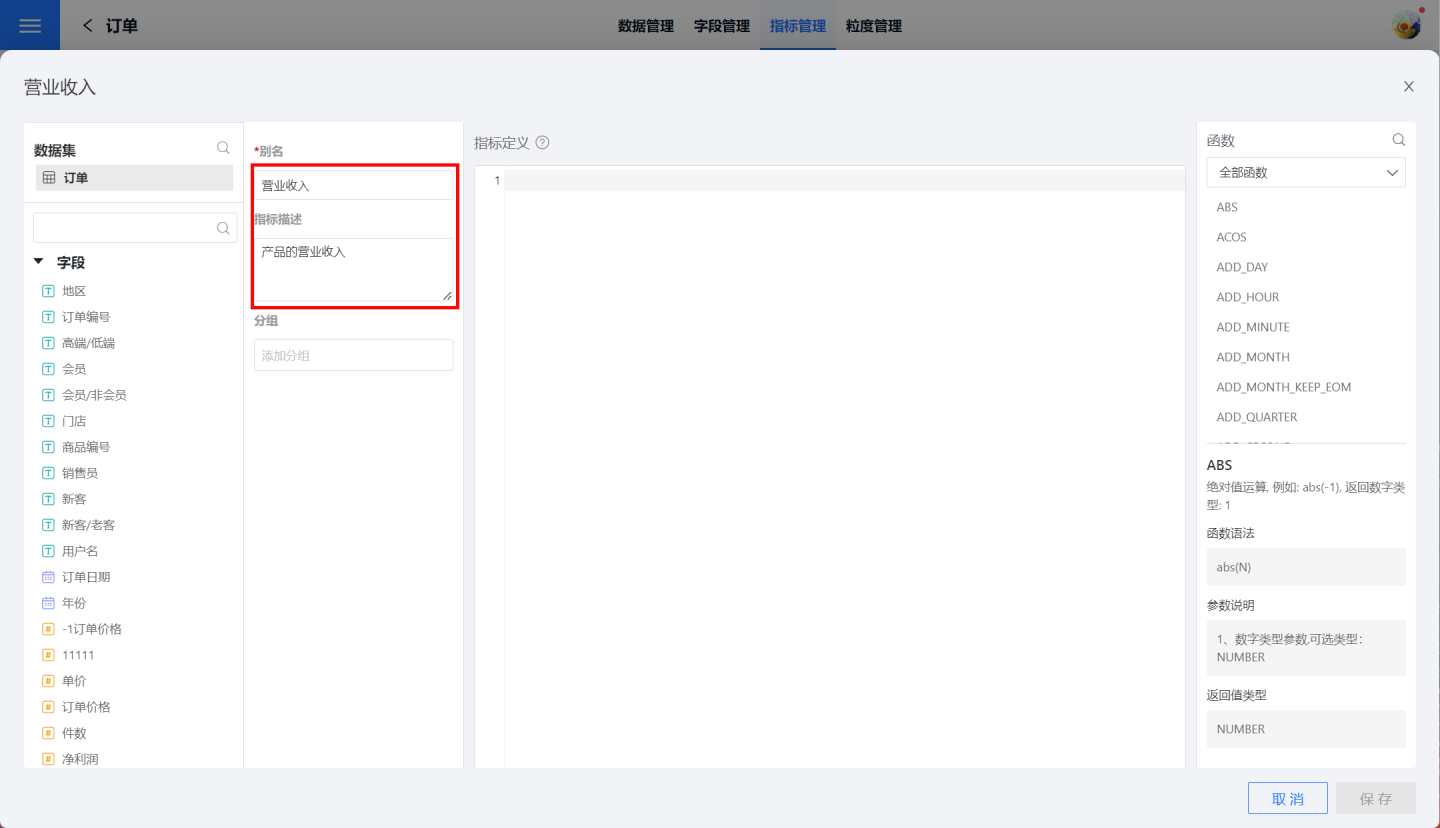
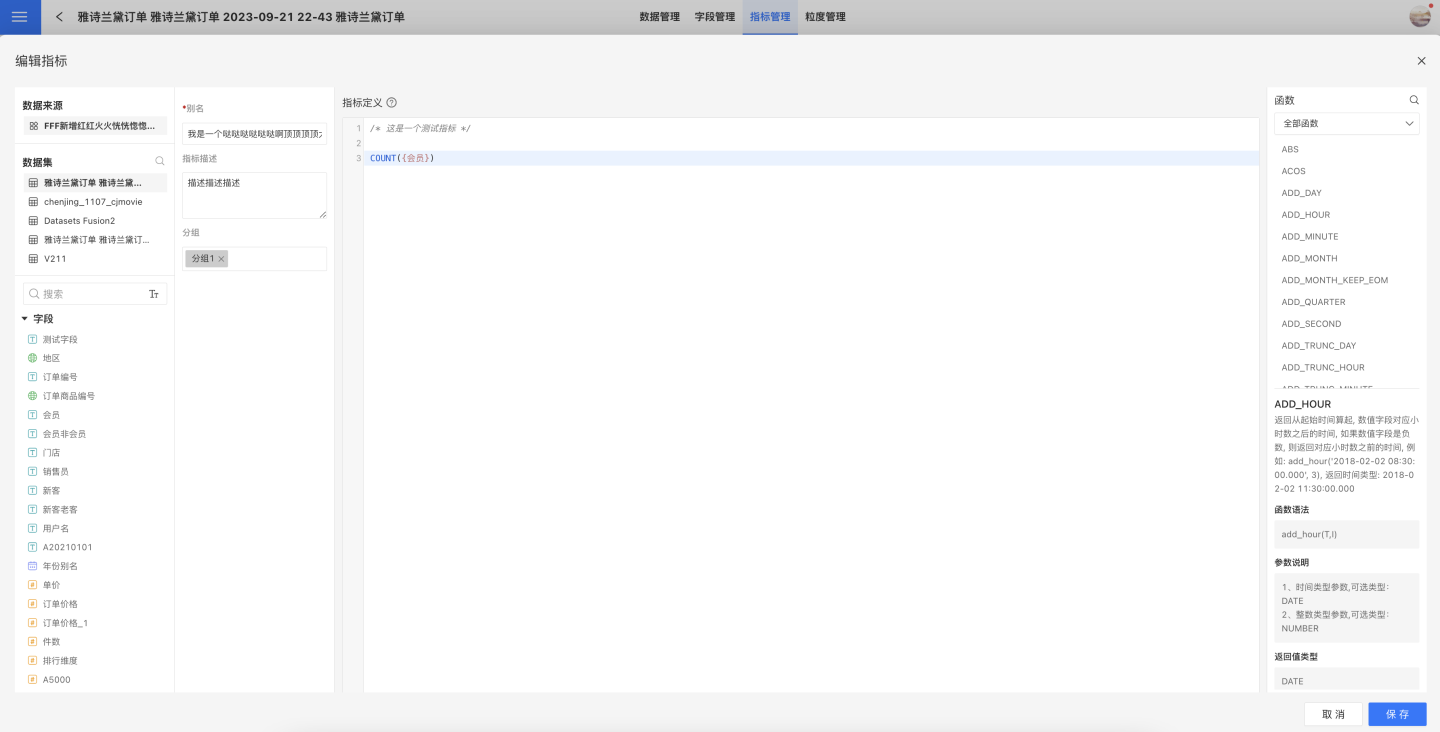
Enter the metric editing page and fill in the metric alias and description information.
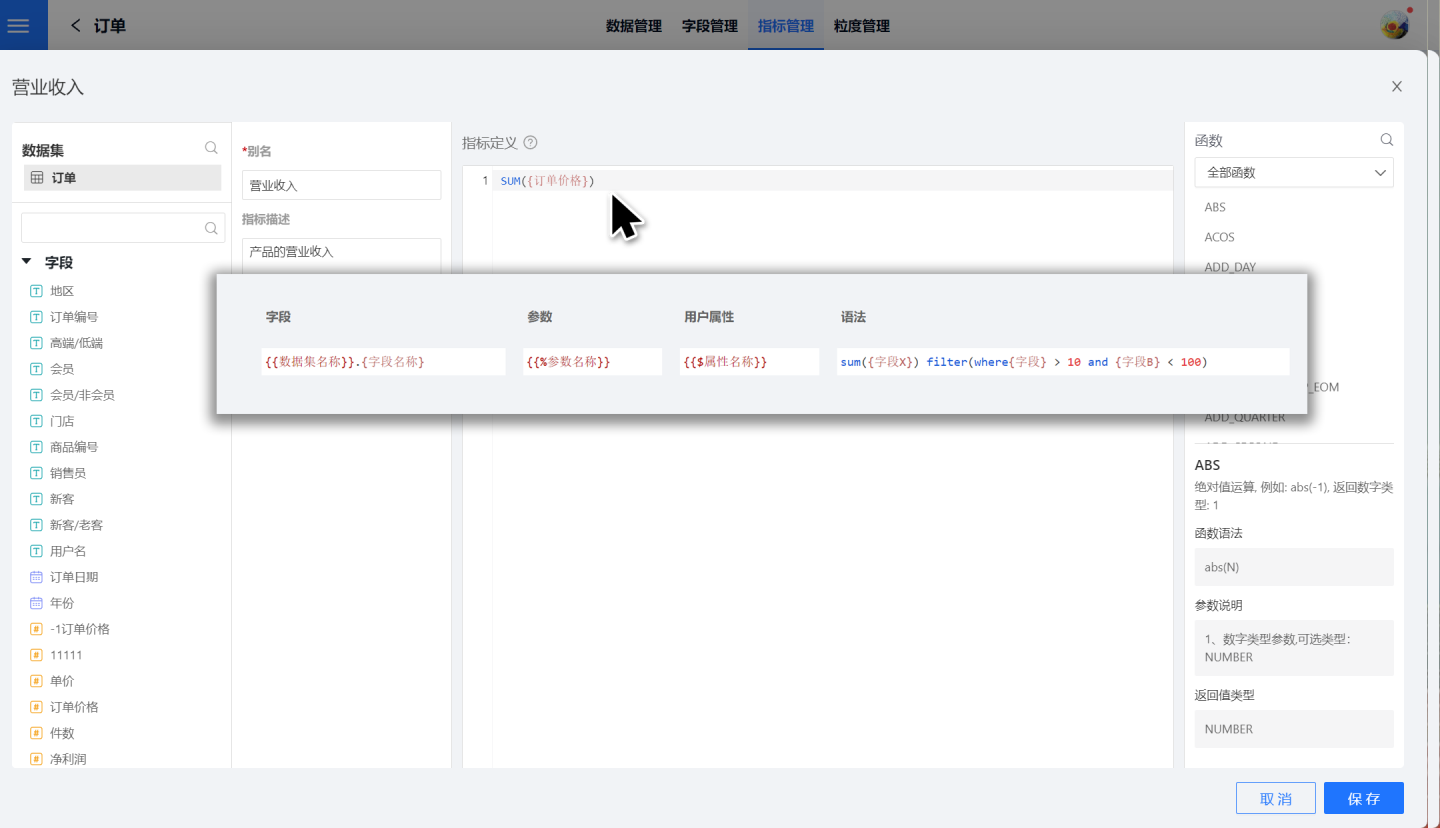
Write functions in the metric definition area and preview the metric data. The metric definition process supports the use of fields, parameters, and user attributes. Metric definition functions must be of aggregate type and support the use of filter operations.
Click "Save Metric."
The above steps complete the metric definition. At this point, the metric only contains numerical information. The example metric expresses the total revenue of all products without distinguishing between years, products, stores, etc.
Atomic metrics only include metric definitions, so the creation of an atomic metric is completed through the above four steps. Business metrics, in addition to metric definitions, also include business configuration parts.
Business Configuration of Metrics
After defining business metrics, it is necessary to perform business configuration for the metrics, adding dimensional information to enrich their business significance. This allows for analysis of specific business scenarios. Business configuration includes constraints, analytical dimensions, timeline, and path attribution.
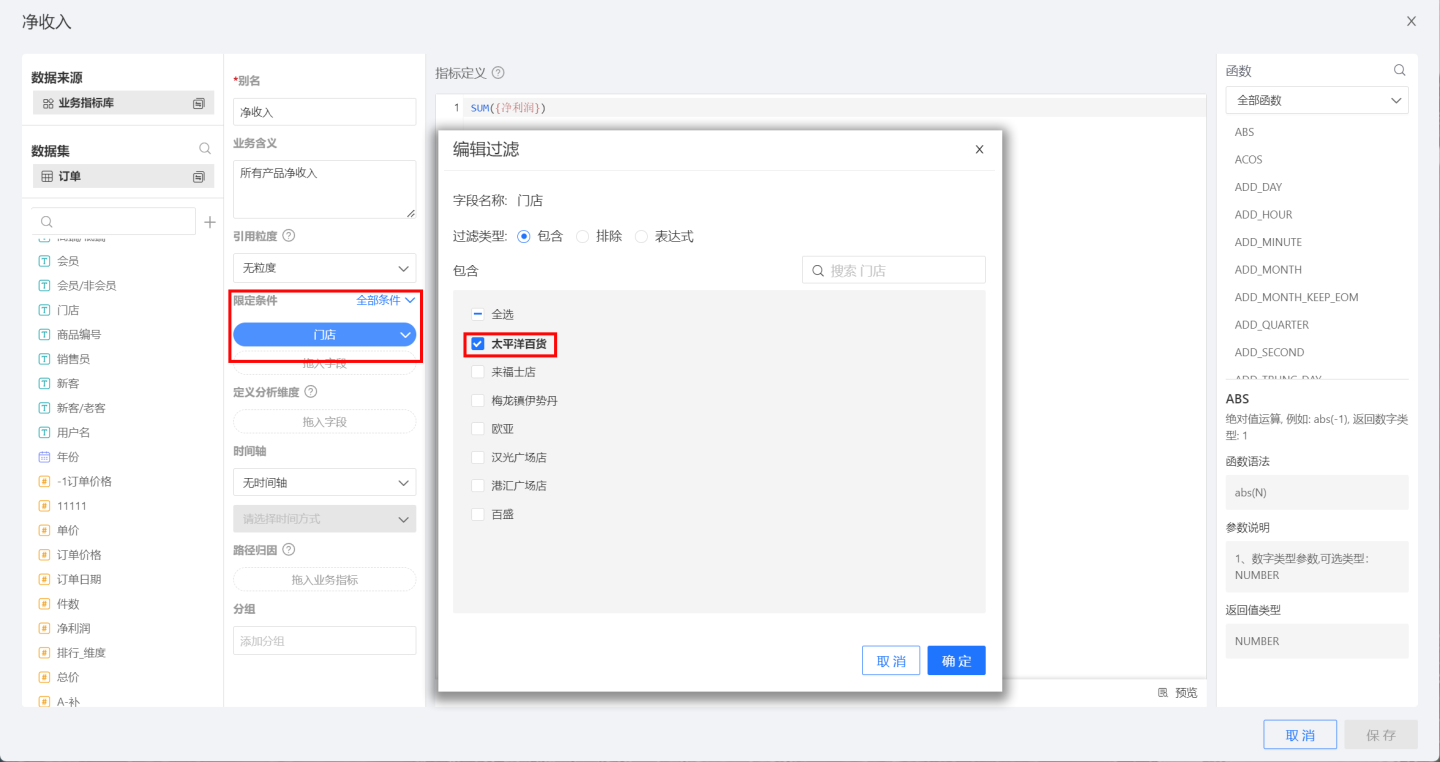
Constraints
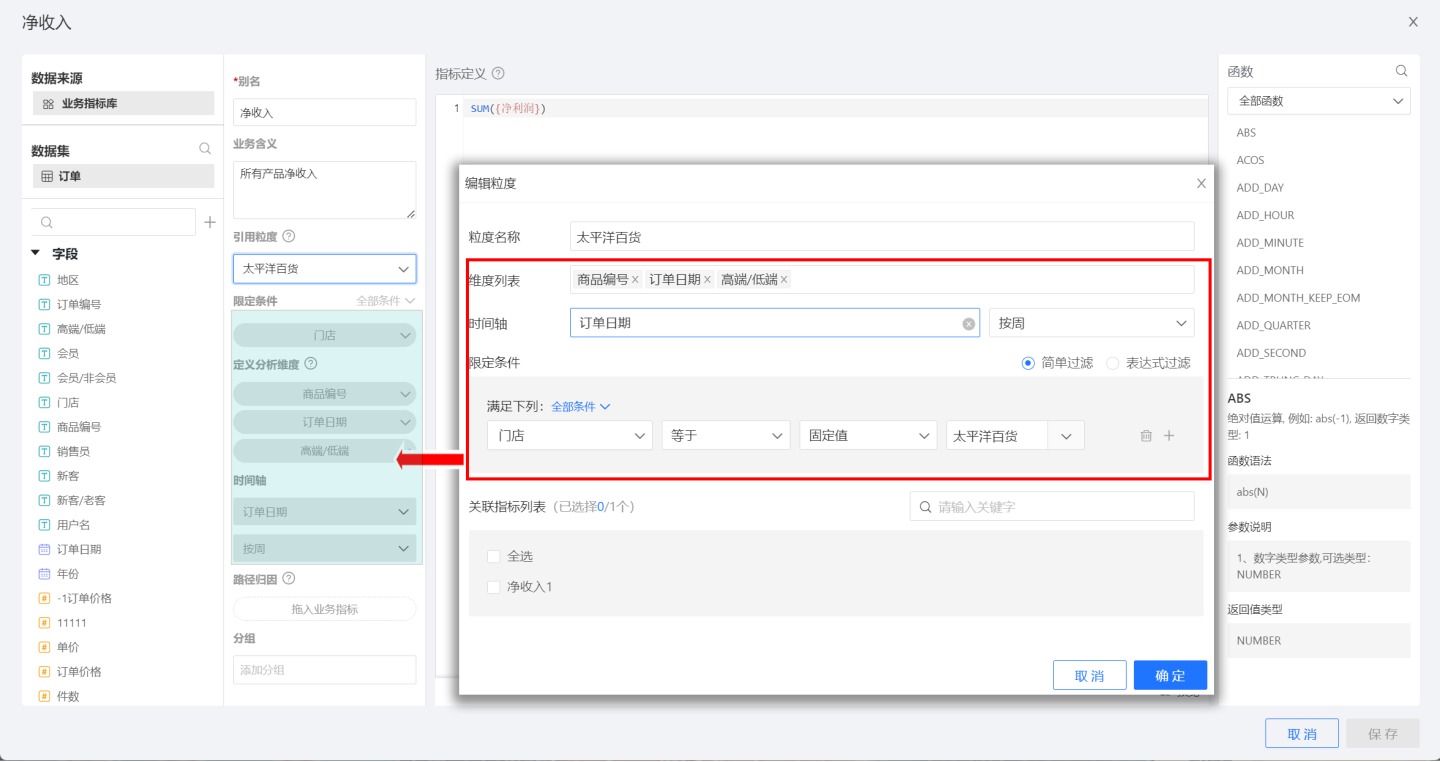
Set constraints for the metrics to generate business metrics under specific conditions. As shown in the figure, when the constraint is set to "Store = Pacific Department Store," the revenue specifically refers to the revenue of the Pacific Department Store.
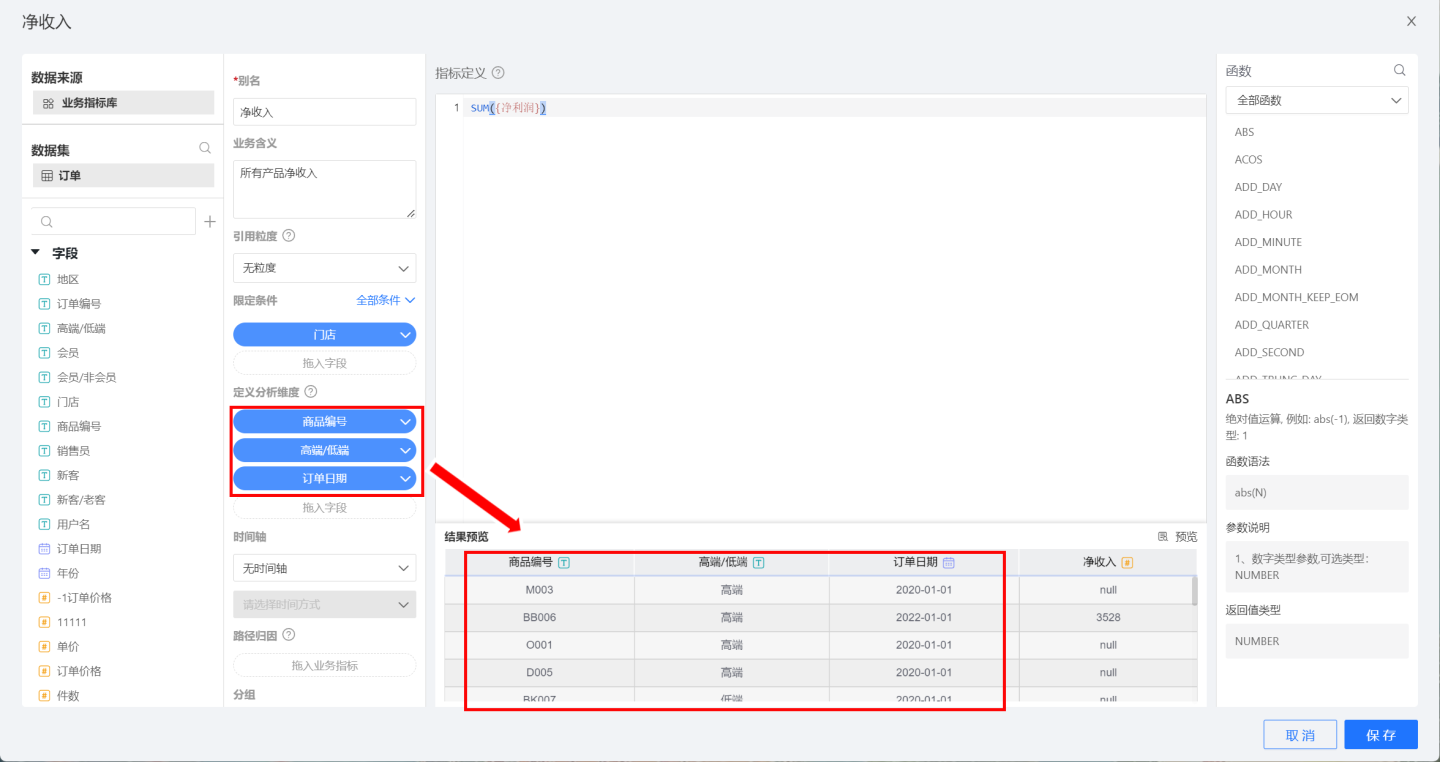
Define Analysis Dimensions
Defining analysis dimensions involves incorporating dimension information into business metrics to form metrics for specific business scenarios. During analysis, dimensions can be used for further exploration. In the example, the specified dimensions are Product ID, High-end/Low-end, and Order Date. Clicking "Preview" allows you to see that the business metrics include these dimension details.
Timeline
The timeline is a method for setting time analysis for business metrics. It is only supported when the analysis dimensions of the metric include a date-type dimension. As shown in the figure, after dragging the order date into the dimension, the timeline can select the order date and set the time mode. 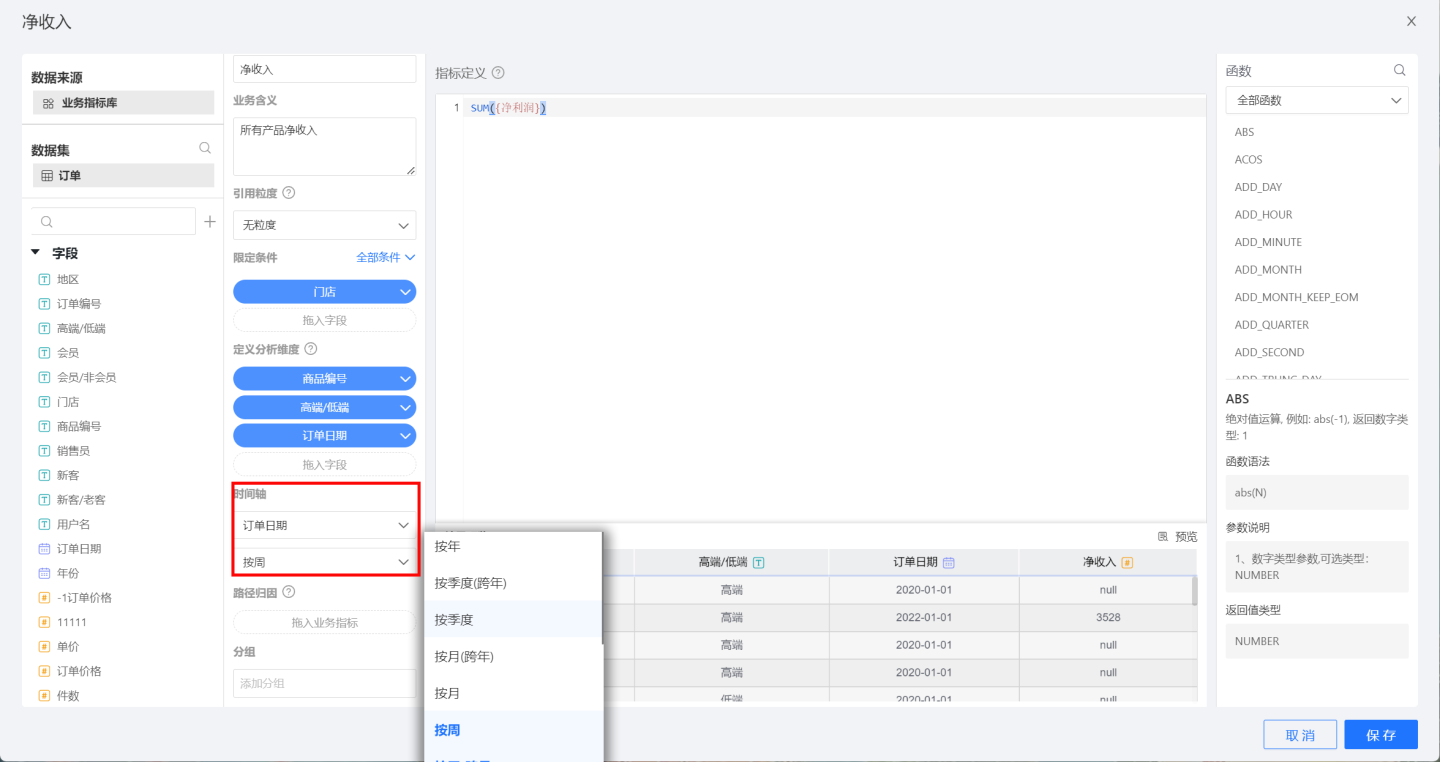
Tip
If there is no date-type field information in the dimension, the timeline cannot be set.
When there are multiple date-type fields in the dimension, only one date field can be selected as the timeline.
Path Attribution
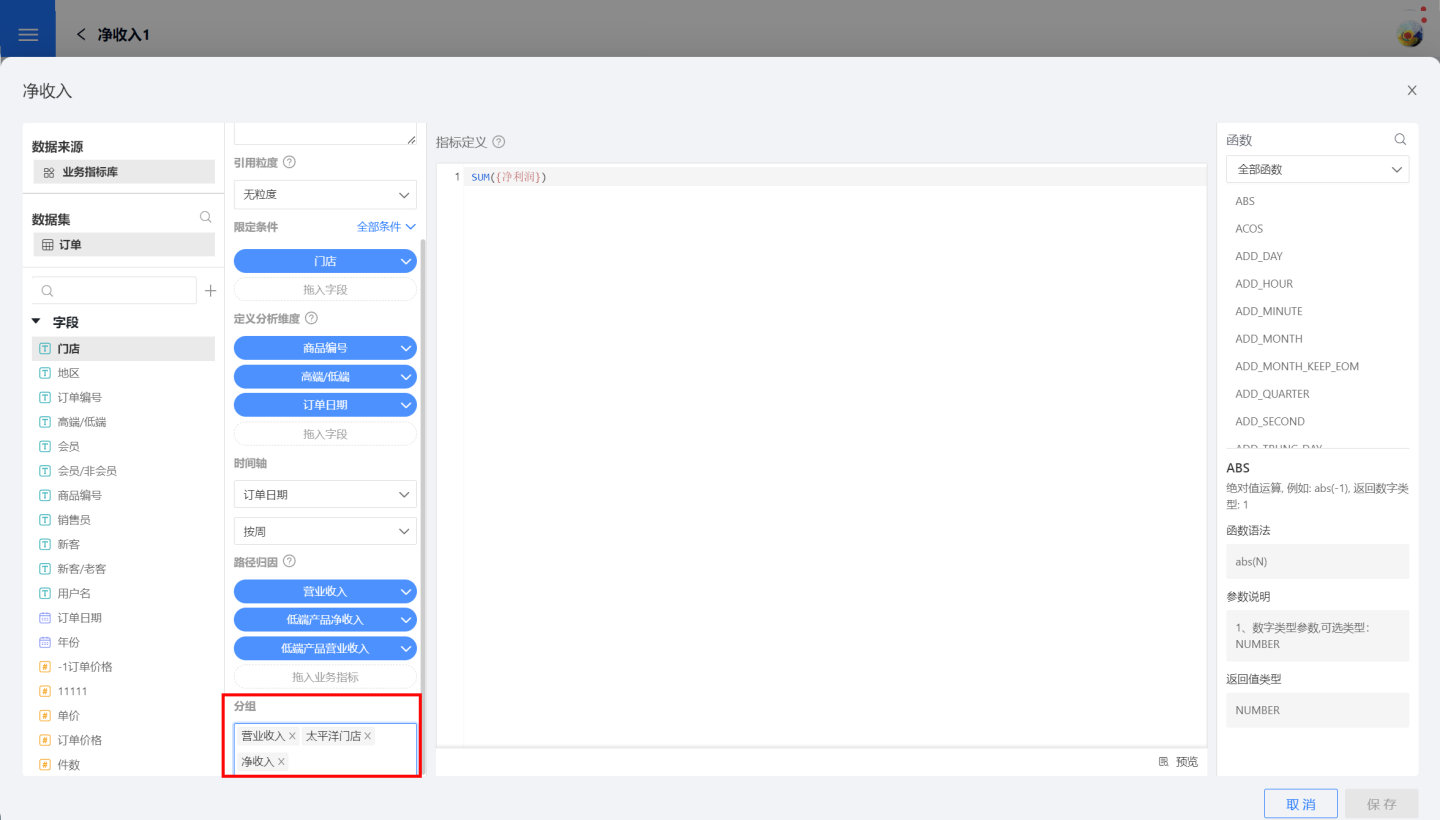
Path attribution associates interrelated metrics. When analyzing business scenarios, related metrics can be analyzed together to observe the mutual influence between business metrics.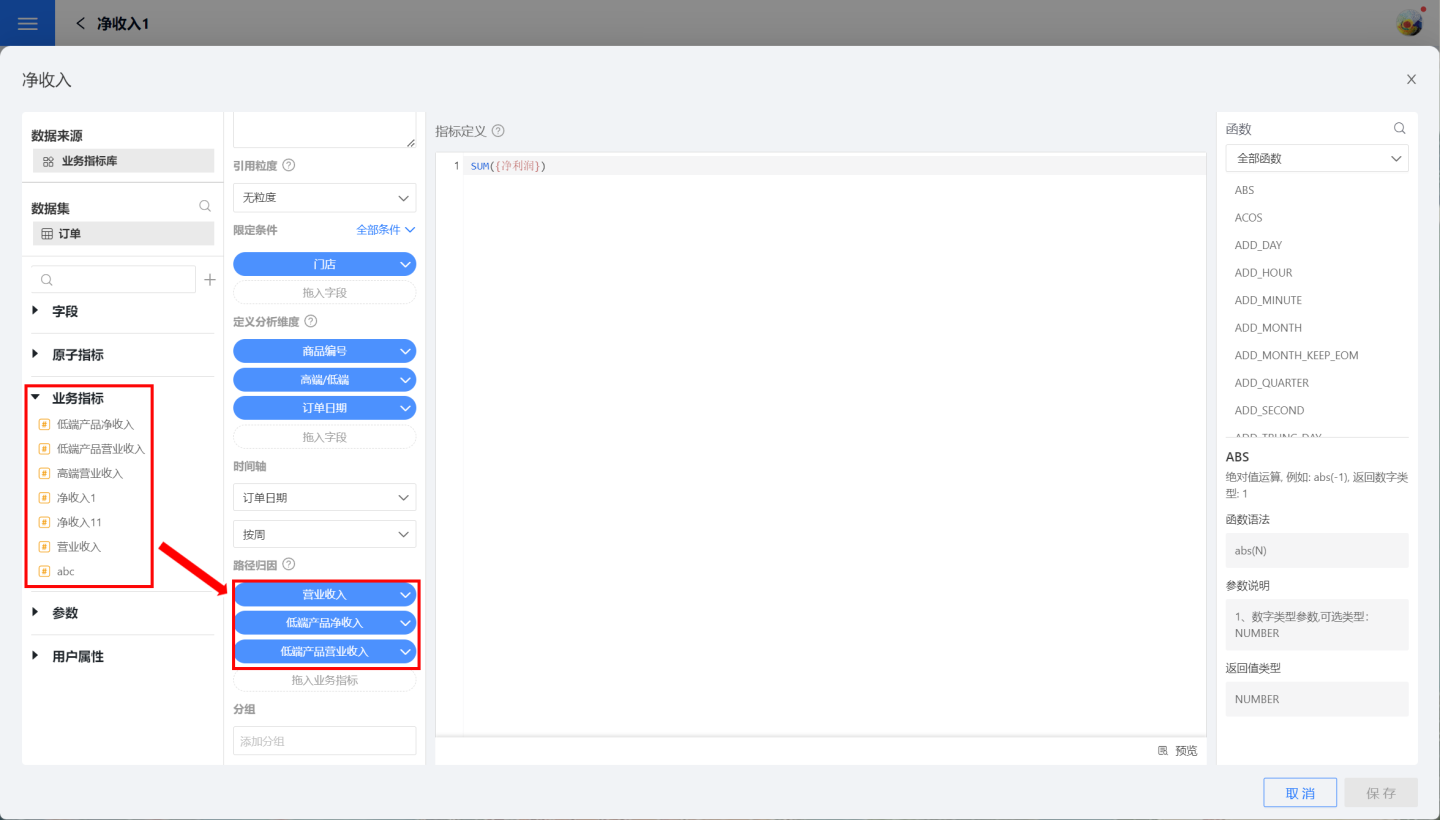
Metric Granularity
When creating each business metric, it is necessary to configure business information such as dimensions and constraints. If multiple metrics share the same configuration information, this information can be managed through metric granularity.
Metric granularity is a way to manage the dimensions, timelines, constraints, and other related settings defined during the creation of business metrics using a unified granularity. During the creation of business metrics, you can directly reference the granularity corresponding to the business scenario, reducing the need to set dimensions and other information, making the creation of business metrics more convenient and efficient.
Create Granularity
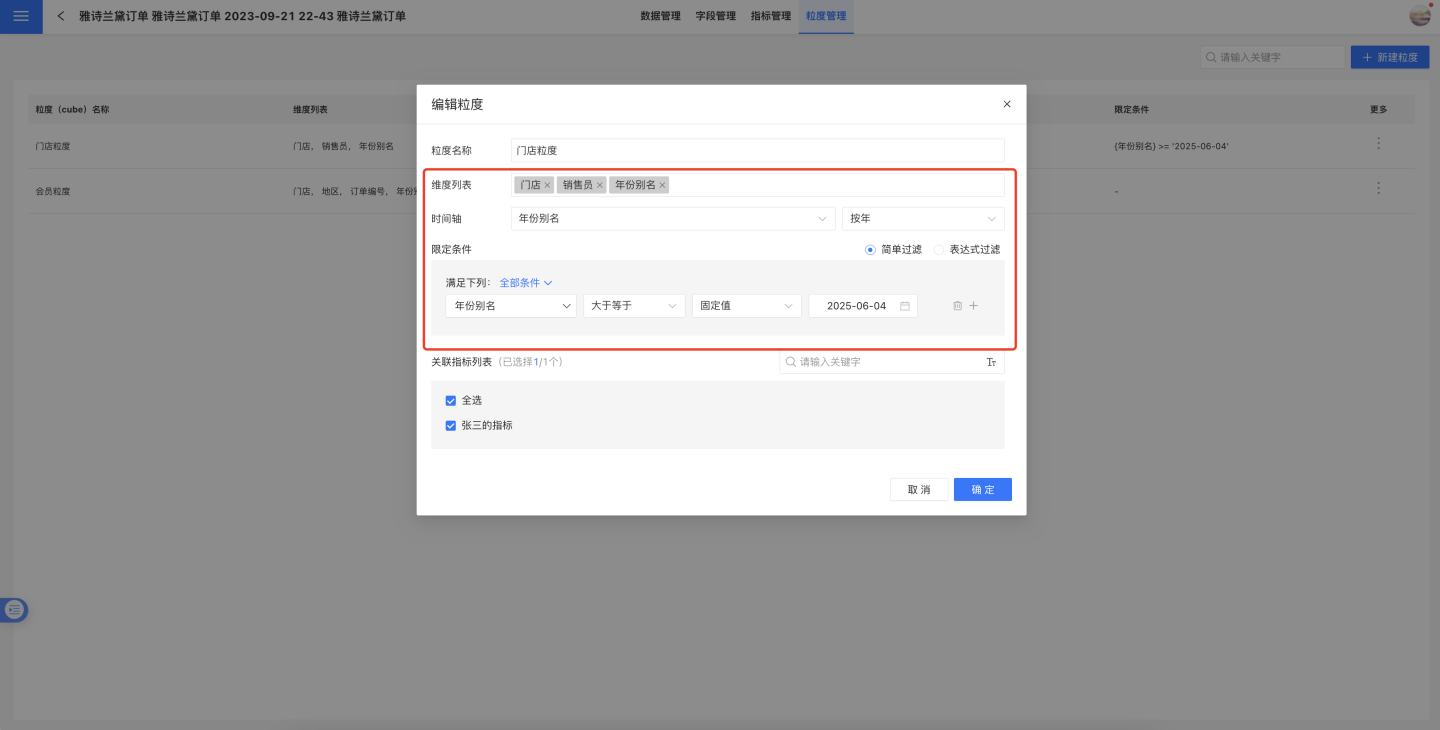
Indicator granularity is created and managed within the dataset. As shown in the figure, open the dataset "Orders," navigate to the granularity management page, and click "Create Granularity" in the upper-right corner of the page to open the granularity creation page.
Granularity requires input for three parts: dimension list, timeline, and constraints. These three parts are set in the same way as during indicator creation. Note that the timeline setup requires the dimension list to include a date field; otherwise, it cannot be configured. The granularity definition process is relatively simple and can refer to the explanation in the indicator configuration process for Dimension List, Timeline, and Constraints.
Reference Granularity
Metrics can reference granularity, using the dimension list, timeline, and constraints defined in the granularity. As shown in the figure, granularity is referenced on the metric editing page. Once a metric references granularity, it will synchronize constraints, analysis dimensions, and timeline from the granularity. At the same time, these contents on the metric page will be grayed out and cannot be edited.
After a metric references granularity, if the granularity information changes, such as adding or removing dimensions, the metric will automatically synchronize the updated granularity information.
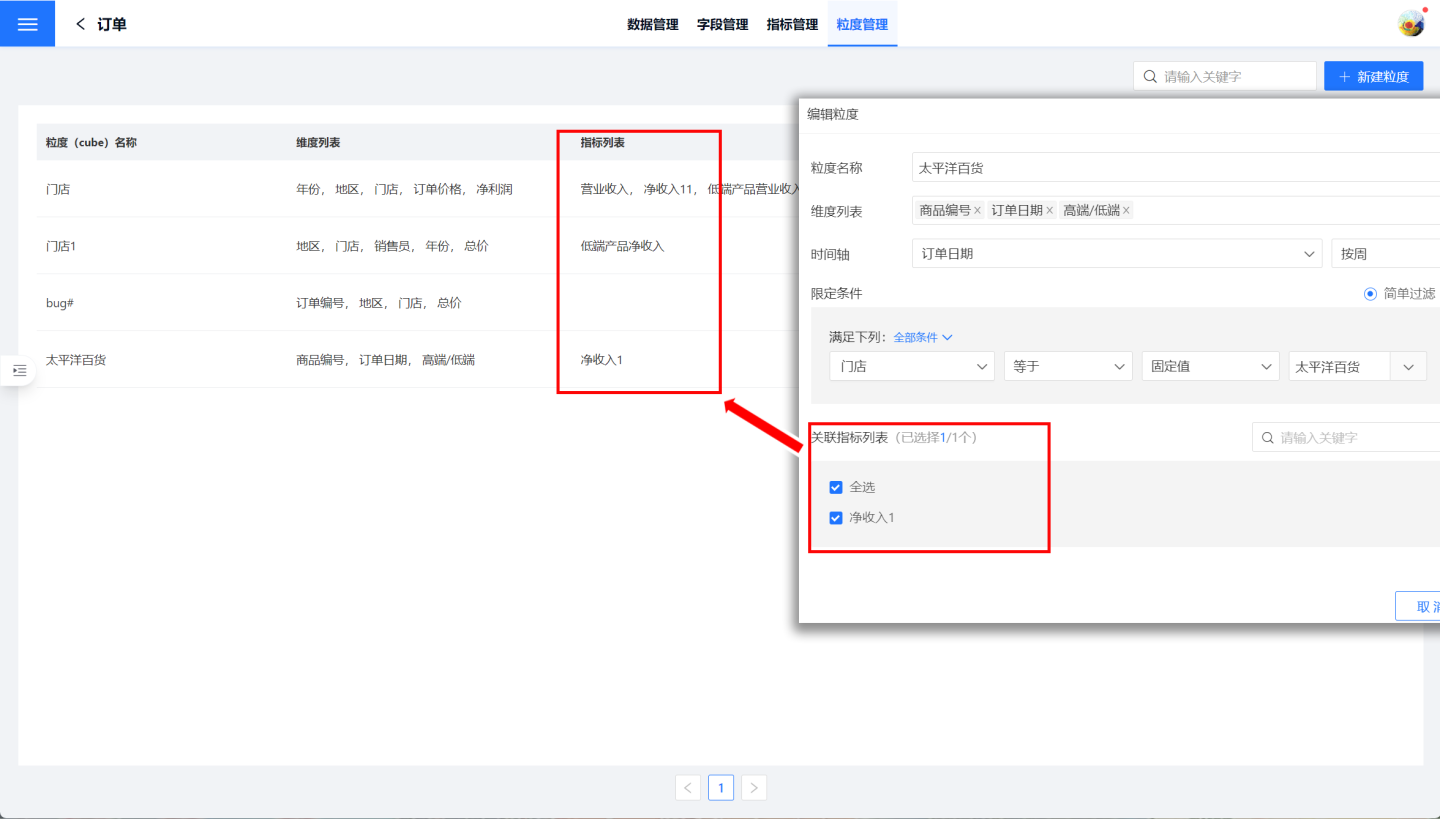
Granularity-Associated Metrics
Metrics can reference granularity, and similarly, granularity can also associate with metrics. When a metric is associated with a specific granularity, the information in the granularity will be synchronized to the metric, overwriting the previous configuration of the metric. This has the same effect as referencing granularity within a metric.
Tip
The functionality of granularity-associated metrics and metrics referencing granularity is identical; they simply use different methods to bind metrics and granularity.
Limitations of Granularity
The use of granularity provides convenience for configuring business metrics to a certain extent, but it also has certain limitations. When creating business metrics, model data information can be used to obtain business scenario metric information after multi-table joins. Dimensions and constraints can be set by selecting fields from the main table or subordinate tables. However, granularity currently supports only one dataset. Therefore, when the configuration information of business metrics is set across multiple tables in the model, the granularity method is not supported.
Metric Grouping
Metrics can be managed in groups. When creating a metric, you can assign it to a group, either by selecting an existing group or by creating a new group on the same page. If you enter a group name that does not exist, the system will prompt you to create a new group. A metric can belong to zero or multiple groups. During the metric management process, groups can be used to quickly locate metrics.
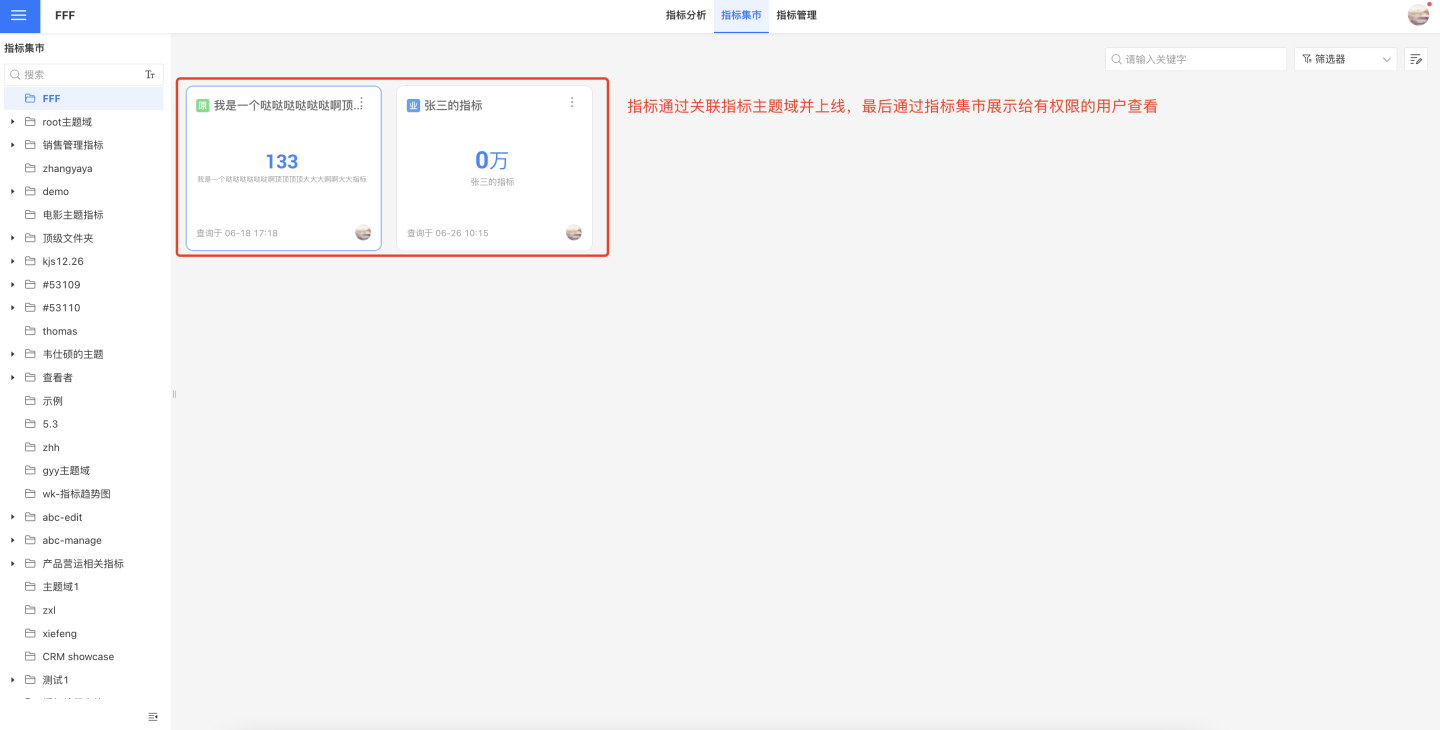
Indicator Display
In Indicator Analysis -> Indicator Marketplace, indicators associated with thematic domains and already online are displayed, including atomic indicators and business indicators. Each indicator is presented in the form of a chart. Clicking on an indicator allows you to view detailed information about the indicator, including the indicator chart, indicator lineage, and indicator definition information.
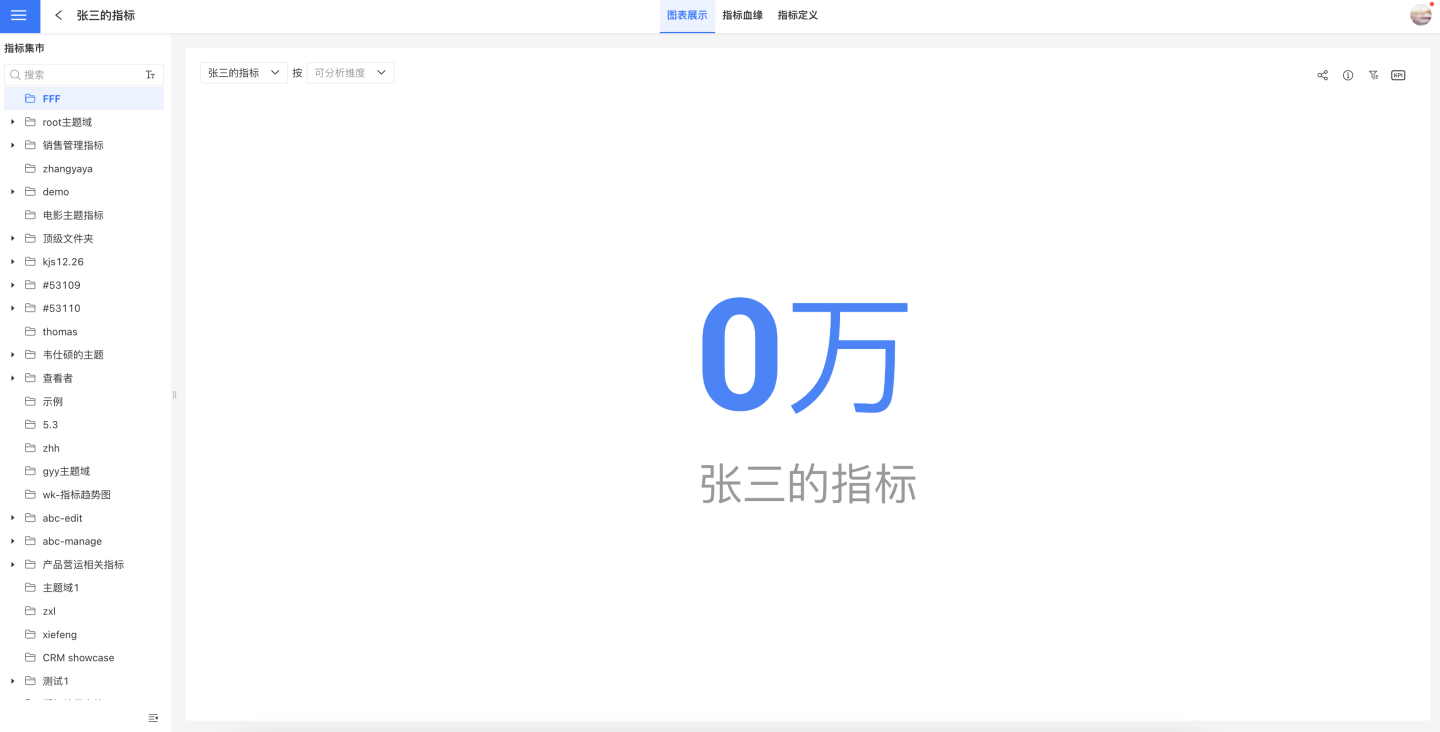
Metric Chart Display
Each metric is displayed in the form of a chart, with the default display being a KPI chart. It supports switching chart types based on business requirements. In the chart, you can set metric calculation methods, metric dimension information, and filter conditions. After editing the chart, it can be set as the default display for the metric.
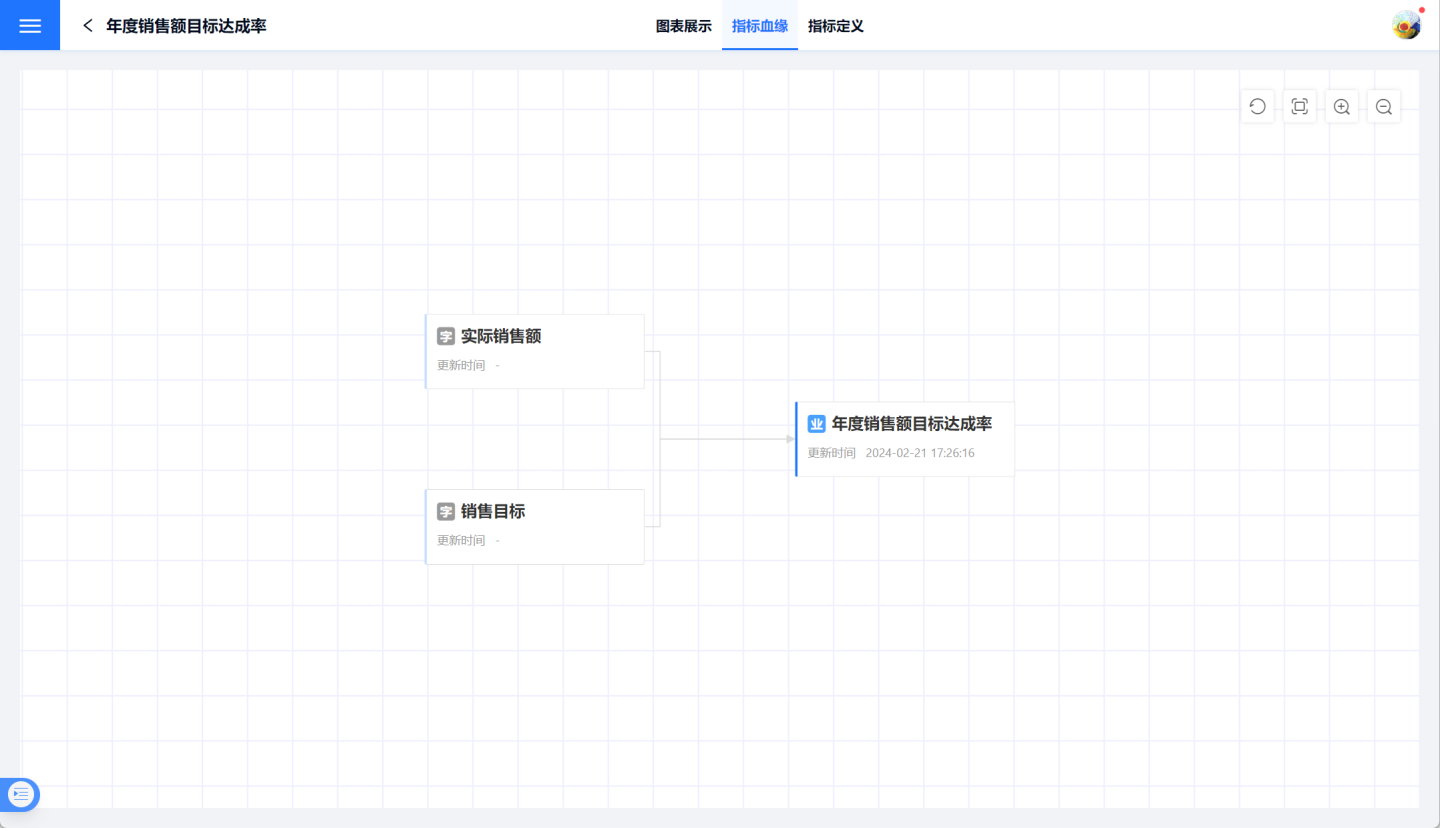
Indicator Lineage
The Indicator Lineage page displays the upstream and downstream production relationships of indicators.
Metric Definition Display
The metric definition page displays the basic information of the metric, including basic information, expression, granularity information, and display format.
Indicator Operations
Common operations for indicators include:
Copy as New Indicator: Indicators support copying, allowing you to redefine the indicator and modify its name and other information during the process.
Rename: Business indicators can be renamed.
Delete: Delete business indicators.
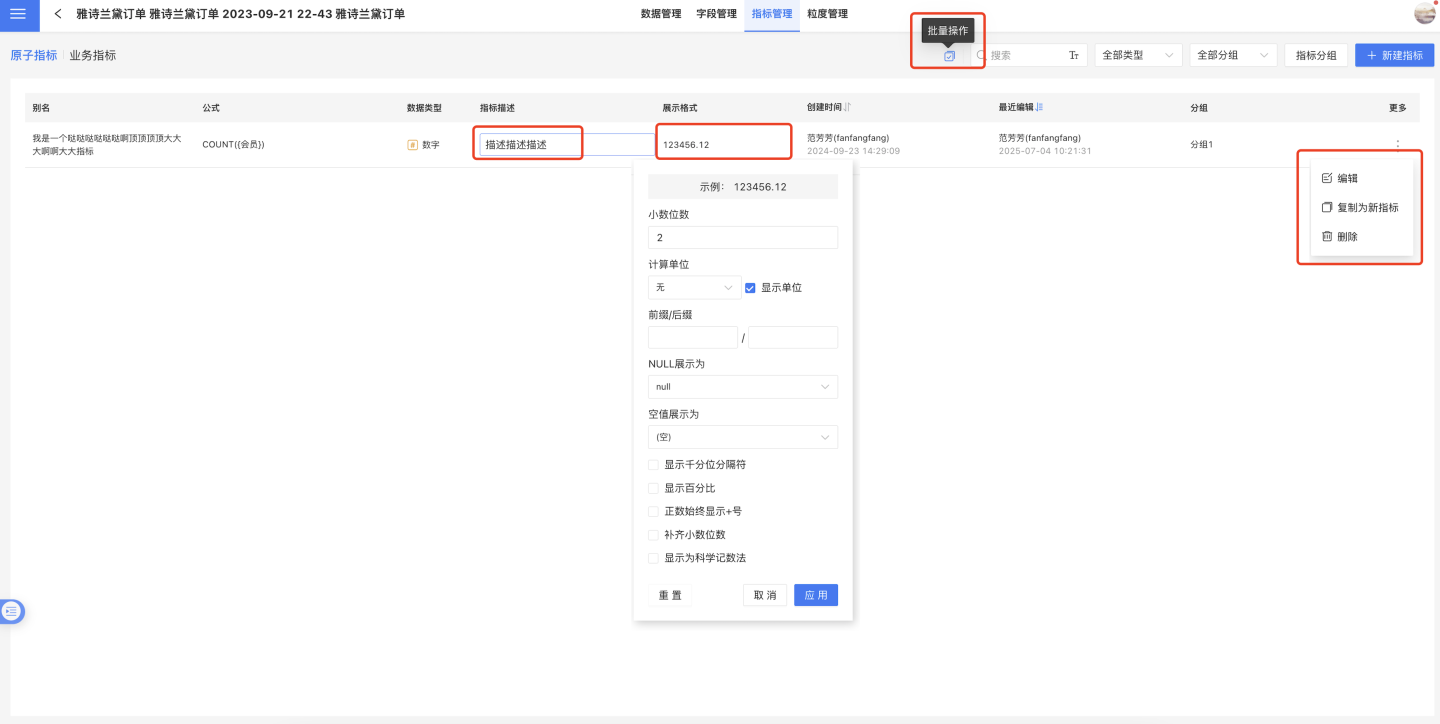
Modify indicator display format.
Edit indicator description (applicable only to atomic indicators).
Batch Operations: Batch modify indicator display formats, batch delete indicators.
Indicator Usage
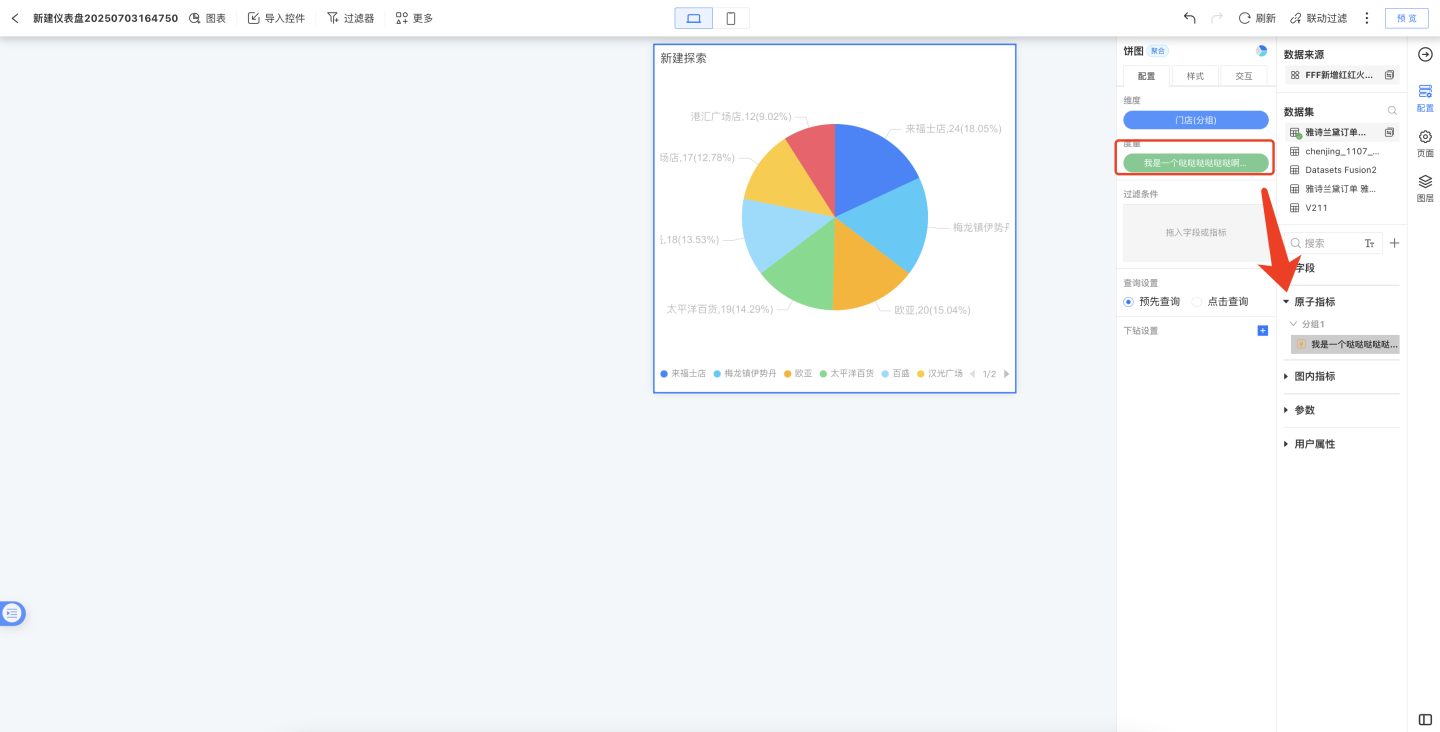
Atomic indicators can be analyzed and used in the Creation dashboard. In charts, indicators can be dragged into measures or filters, but cannot be dragged into dimensions.
They can also be analyzed and used in the Indicator Analysis Dashboard.
Indicator Related Instructions
- After creating a business indicator, each edit and update requires a data preview before saving, while atomic indicators do not.
- A previous pain point in indicator definition was that the system would automatically format expressions and store them in a simplified standard format. In this version, the system will store expressions in their original format as provided by the user, preserving comments and other details. However, if field names or dataset names are modified, the system will automatically rename them.
This feature is also supported in other application scenarios:
- Creating new fields in a dataset
- Join conditions and filter conditions in data models
- Row-level permissions in applications
- Row-level permissions in data connections
- Expression filters for new datasets
- Adding expressions and filters in charts