Go Analyze
Go Analyze is an enhanced feature for charts. The system integrates the Metrics Analysis Function with published applications, enabling published charts to have secondary analysis capabilities.
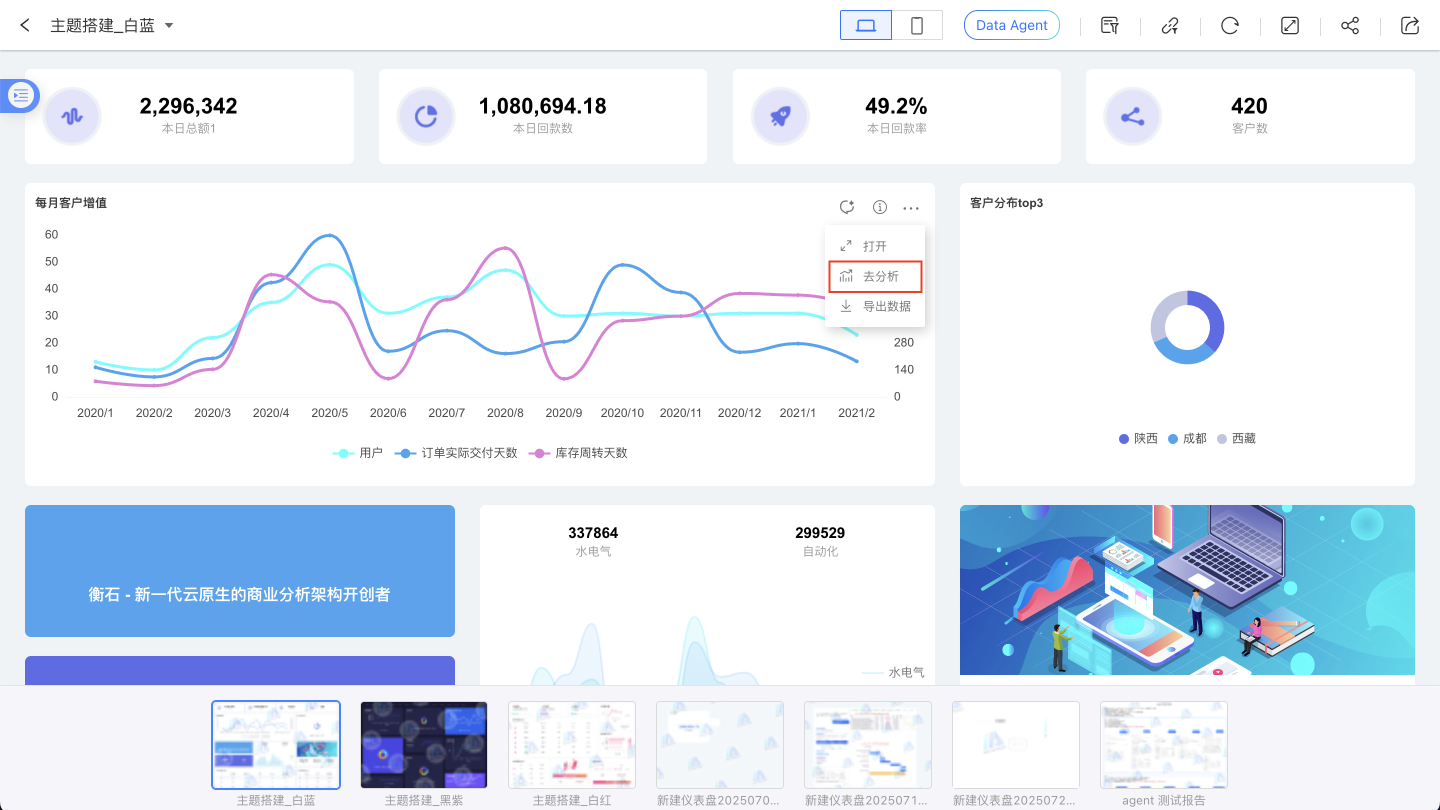
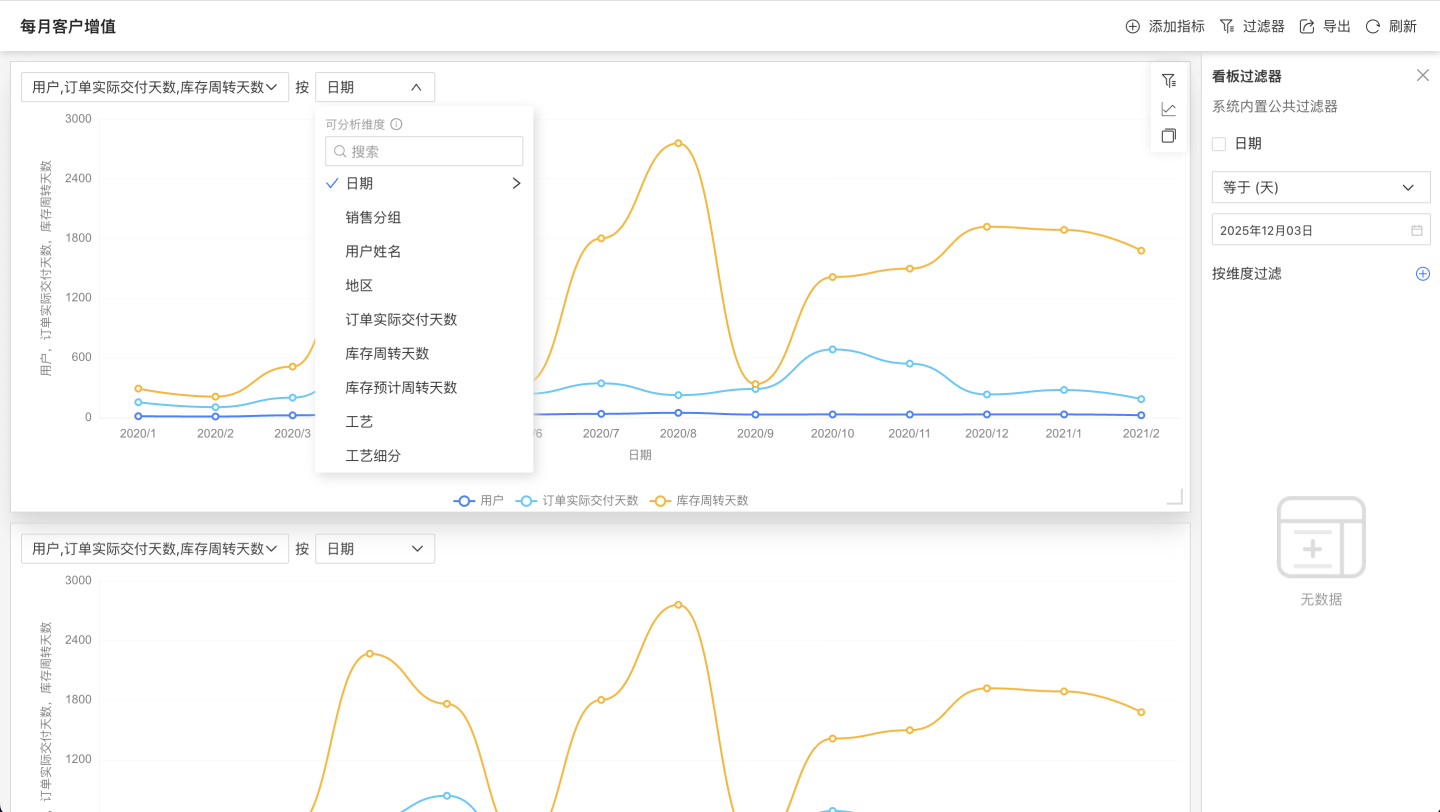
Self-Service Analysis of Chart Metrics
On the "Go to Analysis" page (red box in the image below), users can select chart metrics and their analysis dimensions to display new business chart information. This allows users to analyze business data from multiple perspectives. Users can copy multiple charts for comparative analysis, and features such as dimension filtering are supported. The entire operation process is point-and-click, requiring no prior data analysis knowledge from the user. For detailed guidance on the metric analysis feature, refer to Metric Analysis.
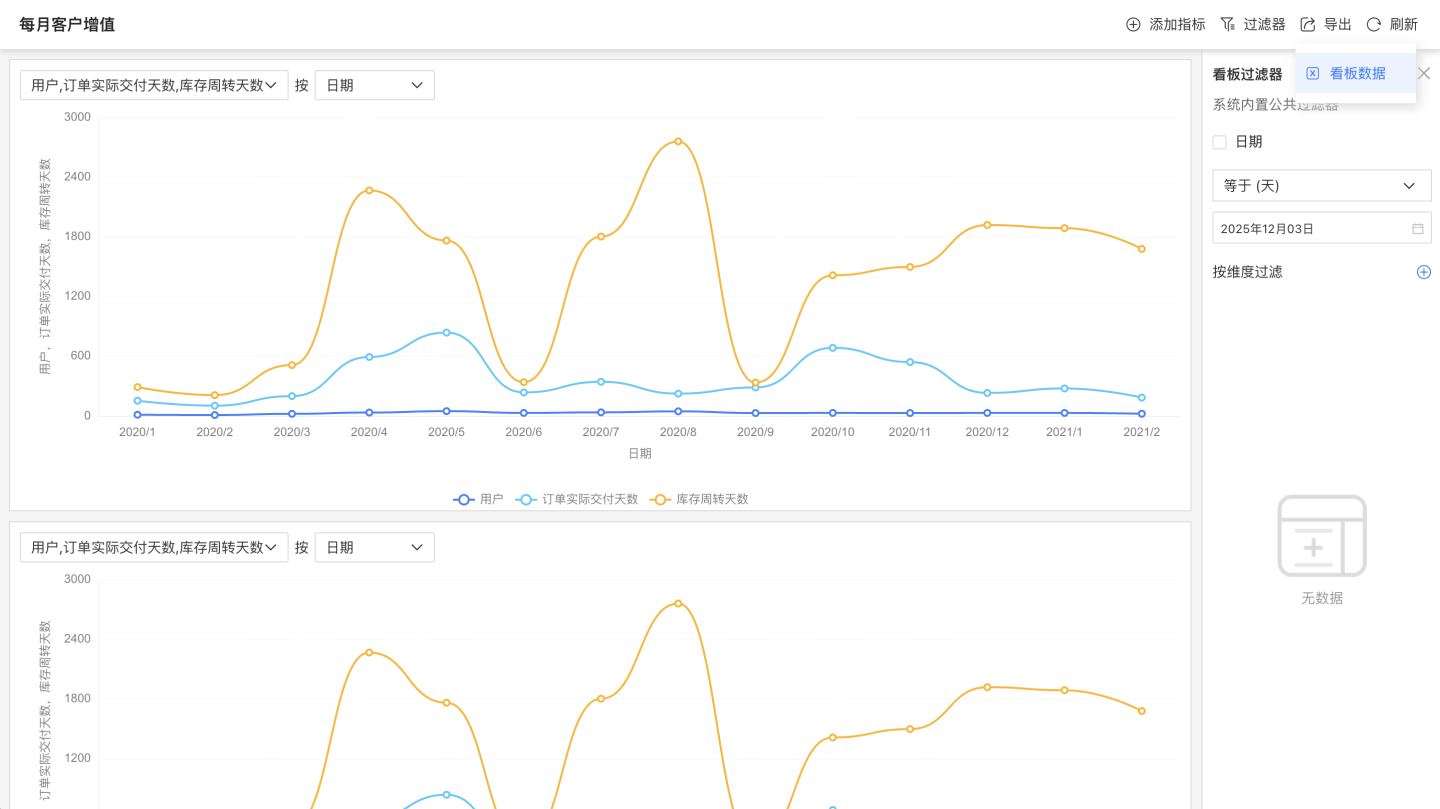
Export
After analyzing the charts within the app in the App Market, it supports exporting the data of the analyzed dashboard results.