Application Display Interaction
When displaying applications in the App Marketplace, interactions with dashboards and charts are involved, mainly including Go to Analysis, saving the current filter snapshot, field settings, refresh, fullscreen, embed, and export functionalities.
Save Current Filter Snapshot
When displaying data on a dashboard, filters are often used to view analytical data under different scenarios. Users need to adjust the corresponding filter option values when switching from one scenario to another. Frequent filter operations may be required when there are many filters or when the display scenarios change constantly.
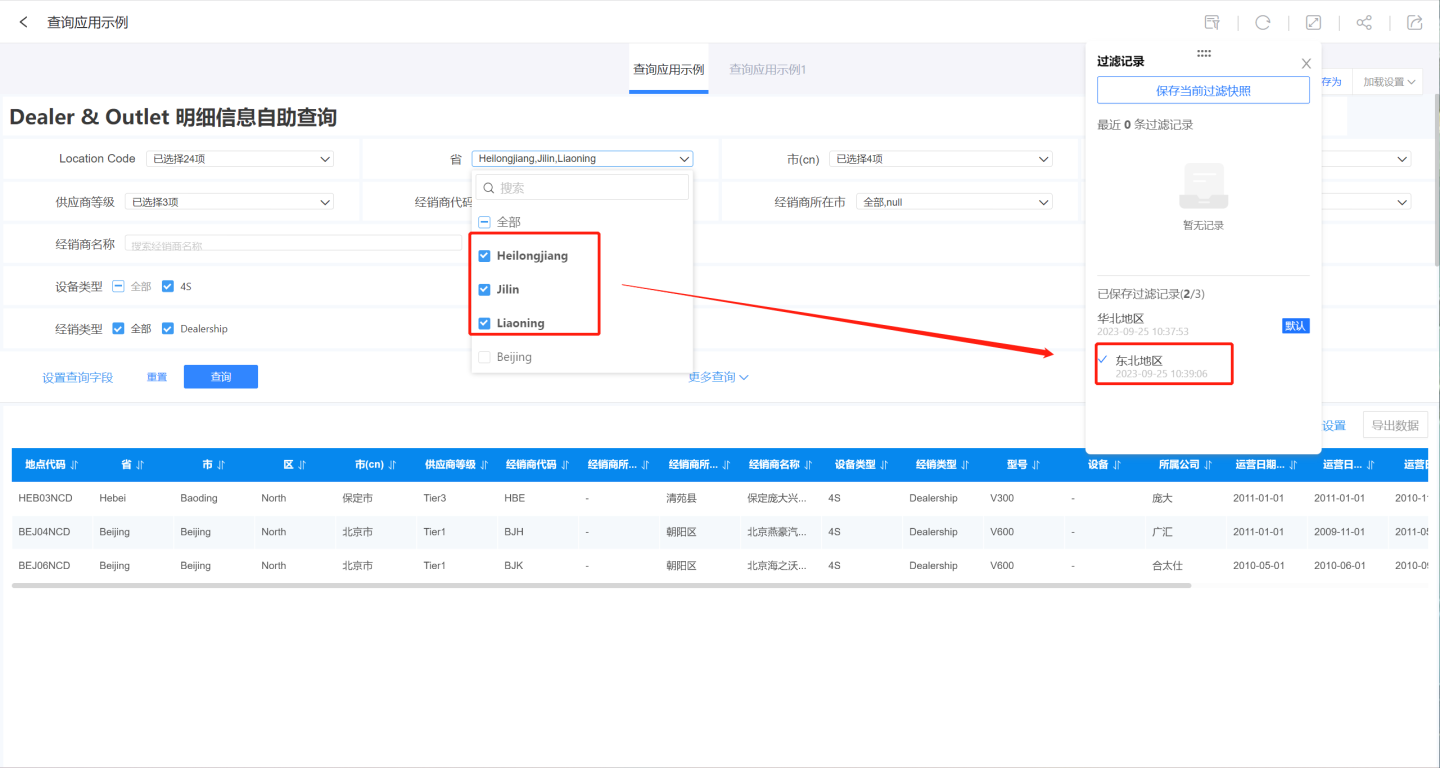
The dashboard's filter snapshot saving feature allows users to save filter conditions for different business scenarios. During display, users can simply import the snapshot for the corresponding scenario without needing to operate the filters again, enabling quick switching between different business scenarios. As shown in the figure, User A is responsible for sales information in the Northeast and North China regions. When viewing the dashboard, they want the filters to display information for these regions. By saving the filter configurations for Northeast and North China, they can simply import the snapshot each time to view the relevant information without needing to filter again.
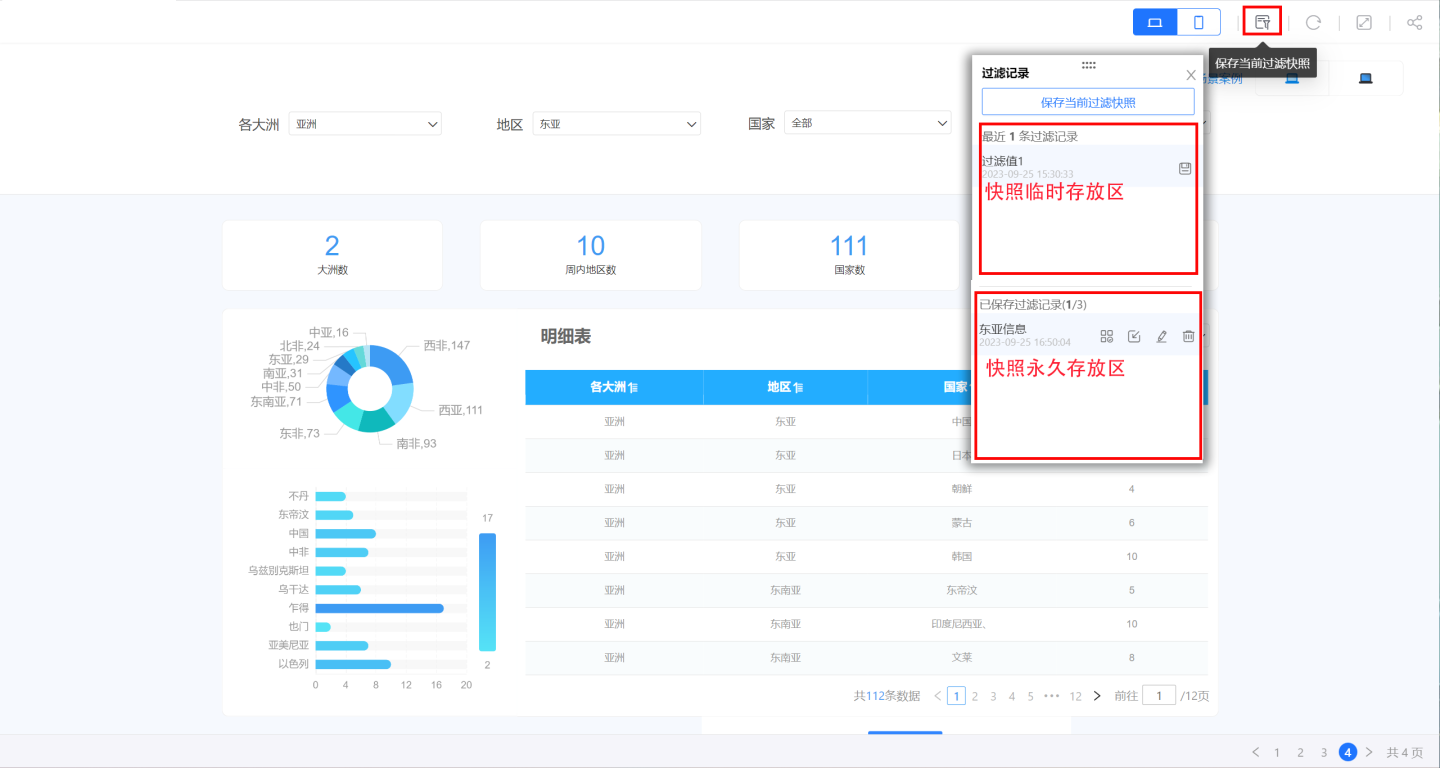
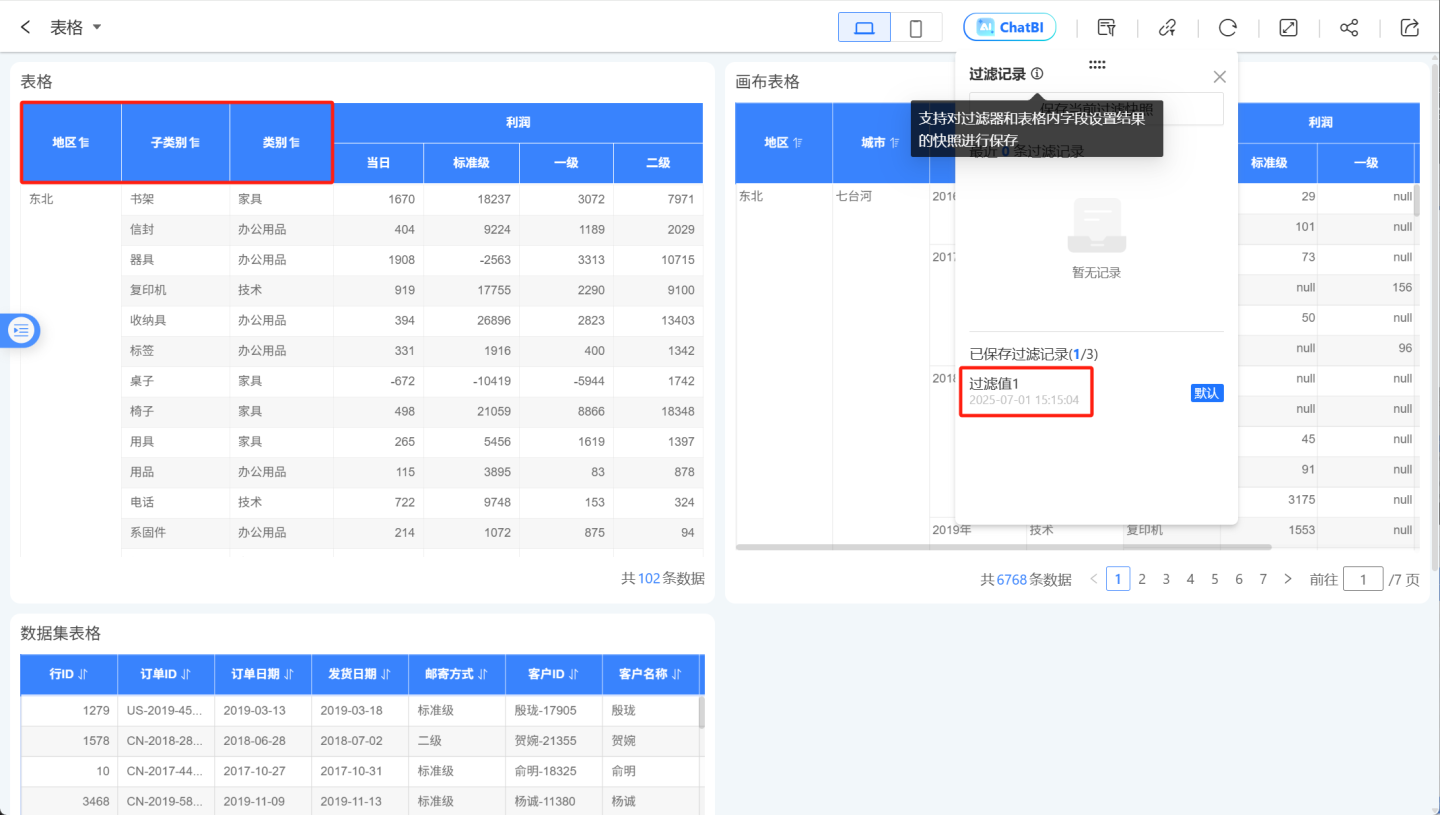
Saving the current filter snapshot is relatively simple. When users encounter a snapshot they need to save while filtering, they can click to store the filter snapshot in a temporary storage area. Once the snapshot window is closed, the snapshots in the temporary area will be lost. By clicking save in the temporary area, users can save the snapshot to their system (permanent storage). When reopening the dashboard, users can find the saved snapshot information in the permanent storage area.
Snapshots saved in the system support operations such as setting as default, importing, renaming, and deleting.
- Set as Default: Use the filter options in the snapshot as the default filter option values. Each time the dashboard is opened, it will read the information from the snapshot instead of the initial settings of the dashboard. This feature allows users to customize the business scenarios displayed on the dashboard.
- Import: During dashboard display, import the filter information from the snapshot to display the corresponding data.
- Rename: Rename the filter snapshot.
- Delete: Delete the snapshot information.
Please Note
- When logged in, if a user saves a filter snapshot, it will be permanently saved under the user's account. The next time the dashboard is opened, data will be loaded based on the default filter record.
- When not logged in, such as in public link or embedded scenarios, if a user saves a filter snapshot, it will be locally cached on the browser device. Clearing the browser cache, switching browsers, or using a different computer to open the dashboard will display the dashboard in its default state without any filter snapshot records.
Field Settings
When viewers view reports, they may hide certain fields in the table that are not frequently checked through field settings. At the same time, they expect the field settings to remain configured the next time they open the report. In the current version, you can use the save filtering snapshot feature to save table snapshots after configuring field settings in the table.
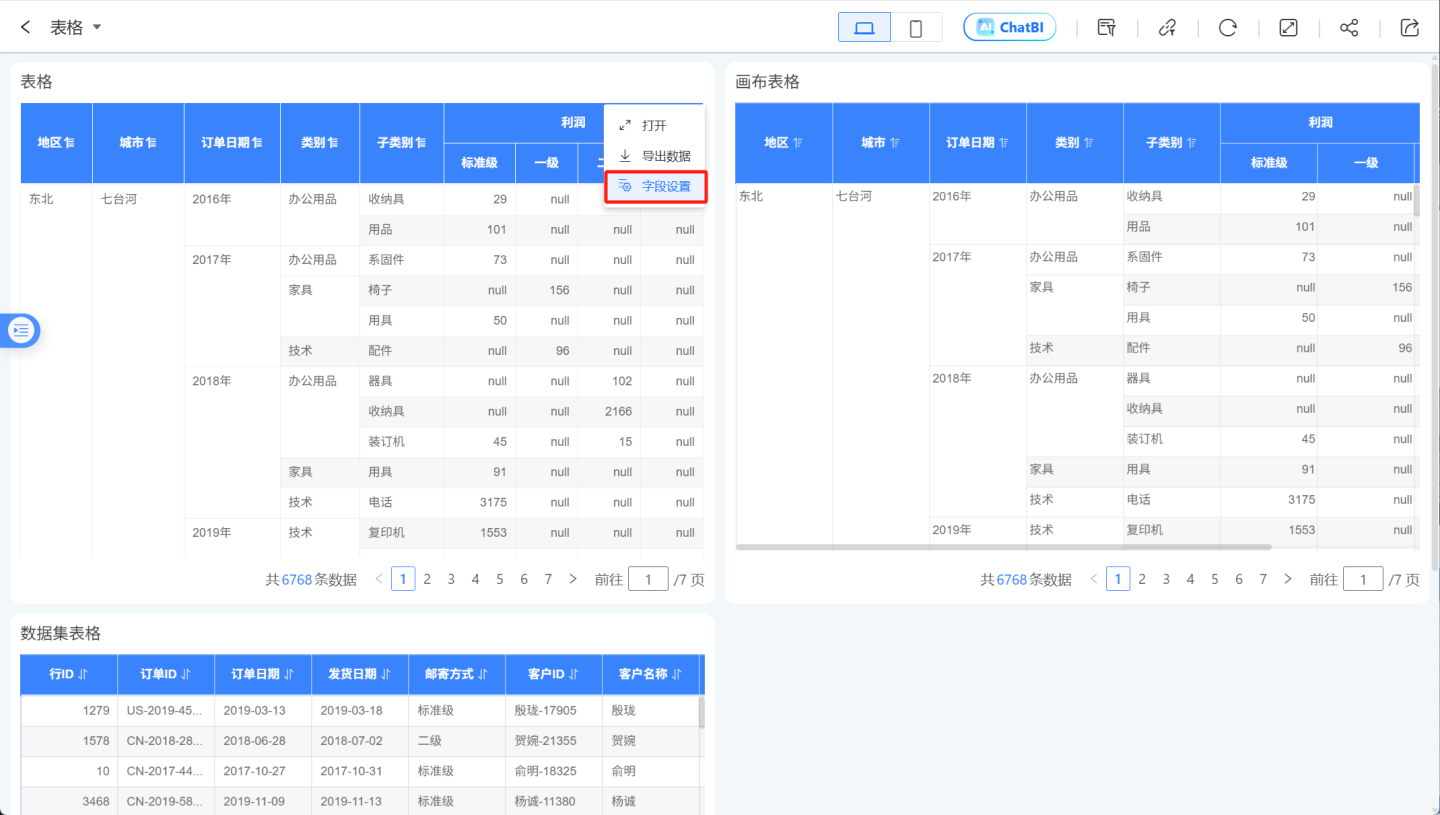
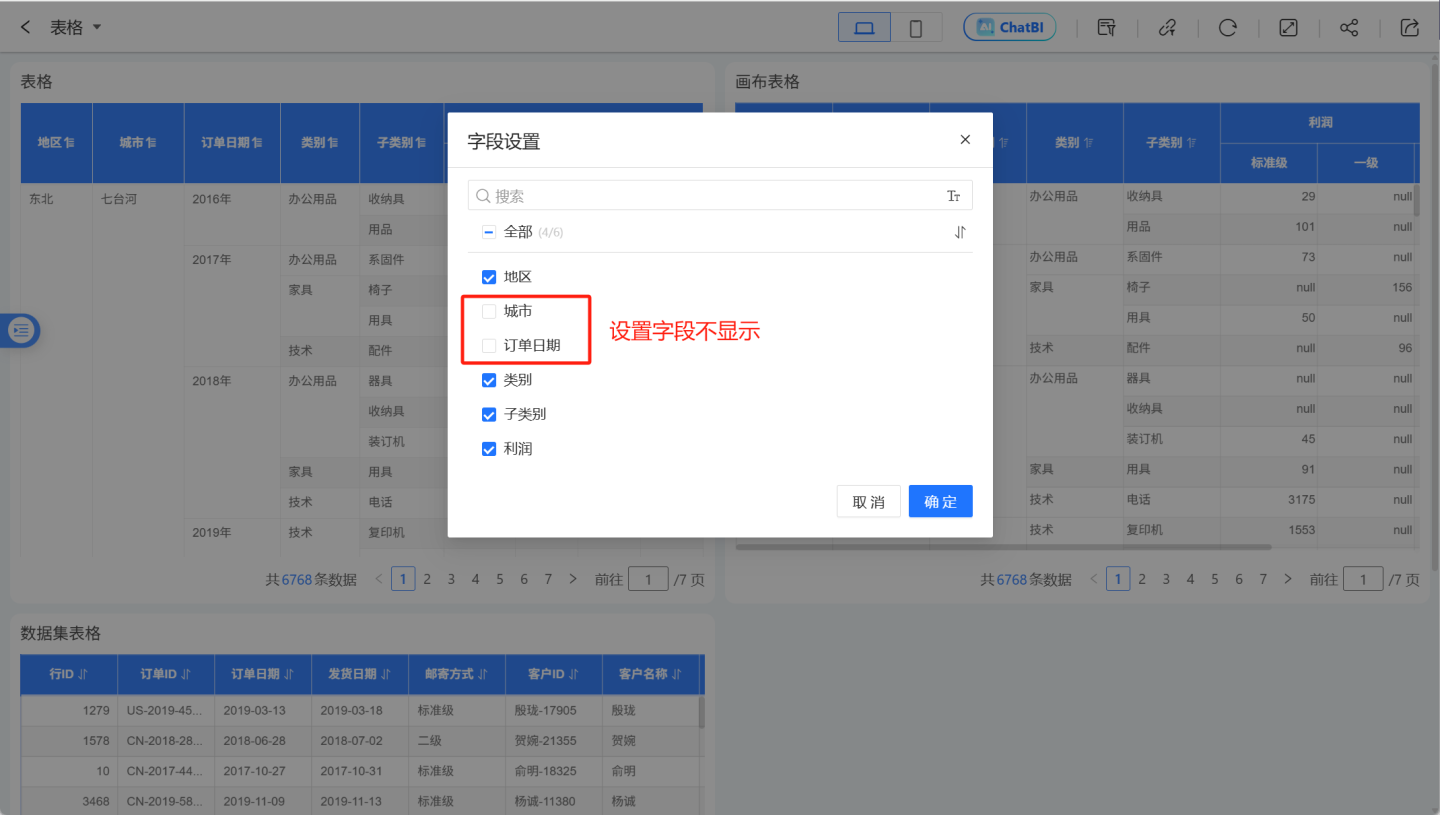
- Field Settings Entry
- Configure Field Visibility
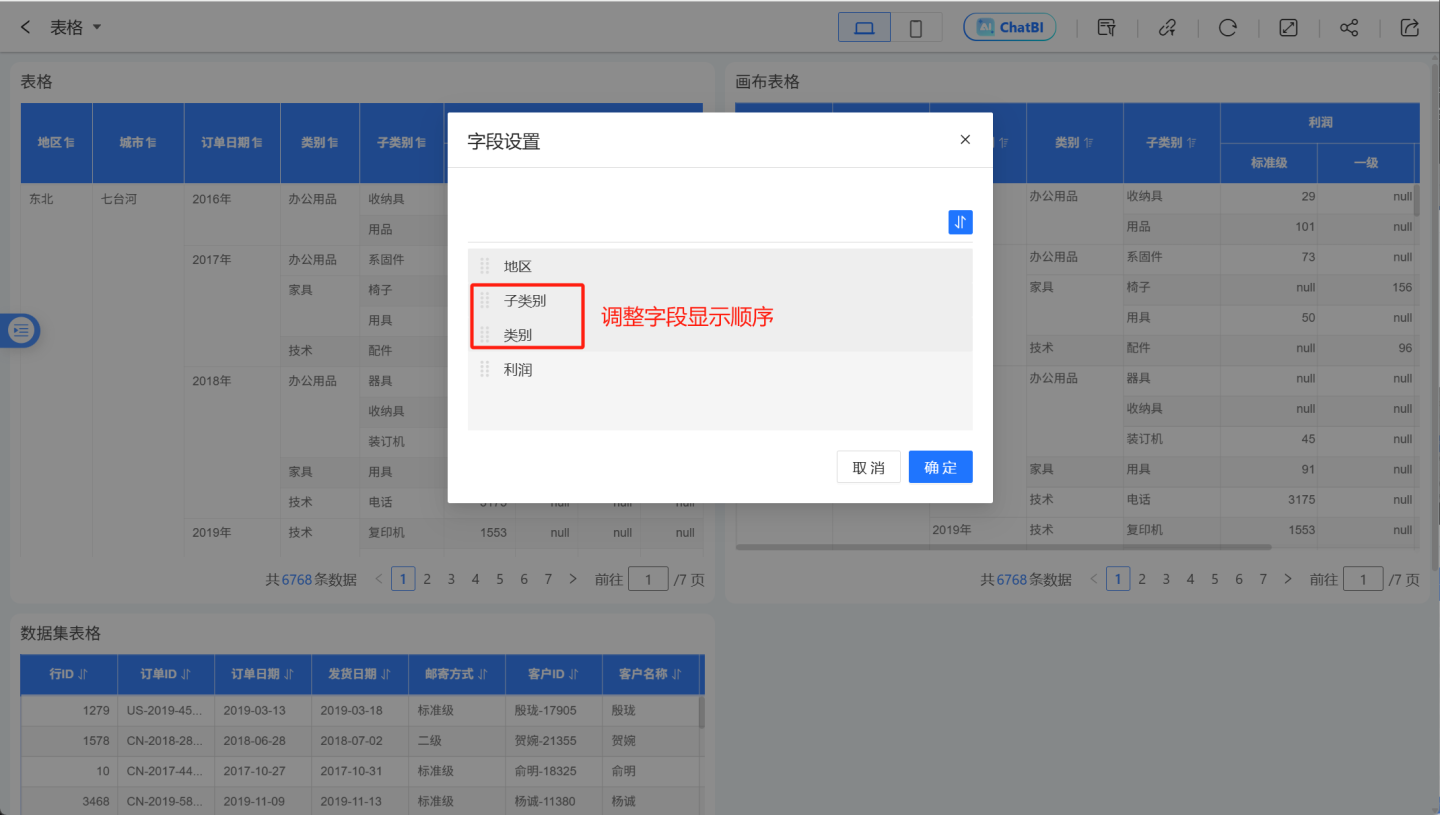
- Adjust Field Display Order
- Save Current Field Settings Snapshot
Tips
- In the App Market, table, canvas table, and dataset table, the field settings and sorting results can all be saved as snapshots. The cross table does not support the field settings feature.
- The field settings feature is not supported on mobile tables.
Refresh
Do not use cached chart data, but directly refresh the chart data.
Full Screen
Dashboard full-screen display. In full-screen mode, Auto Play can be set.
Embedding
Dashboards, charts, and the application itself within the app all support embedding. Users can perform embedding operations at different levels based on display needs. Both the App Marketplace and applications created in App Creation support embedding.
Iframe Embedding Guide
This section uses app embedding as an example to explain how to perform Iframe embedding. The embedding and sharing process for dashboards and charts is similar to app embedding and will not be elaborated here.
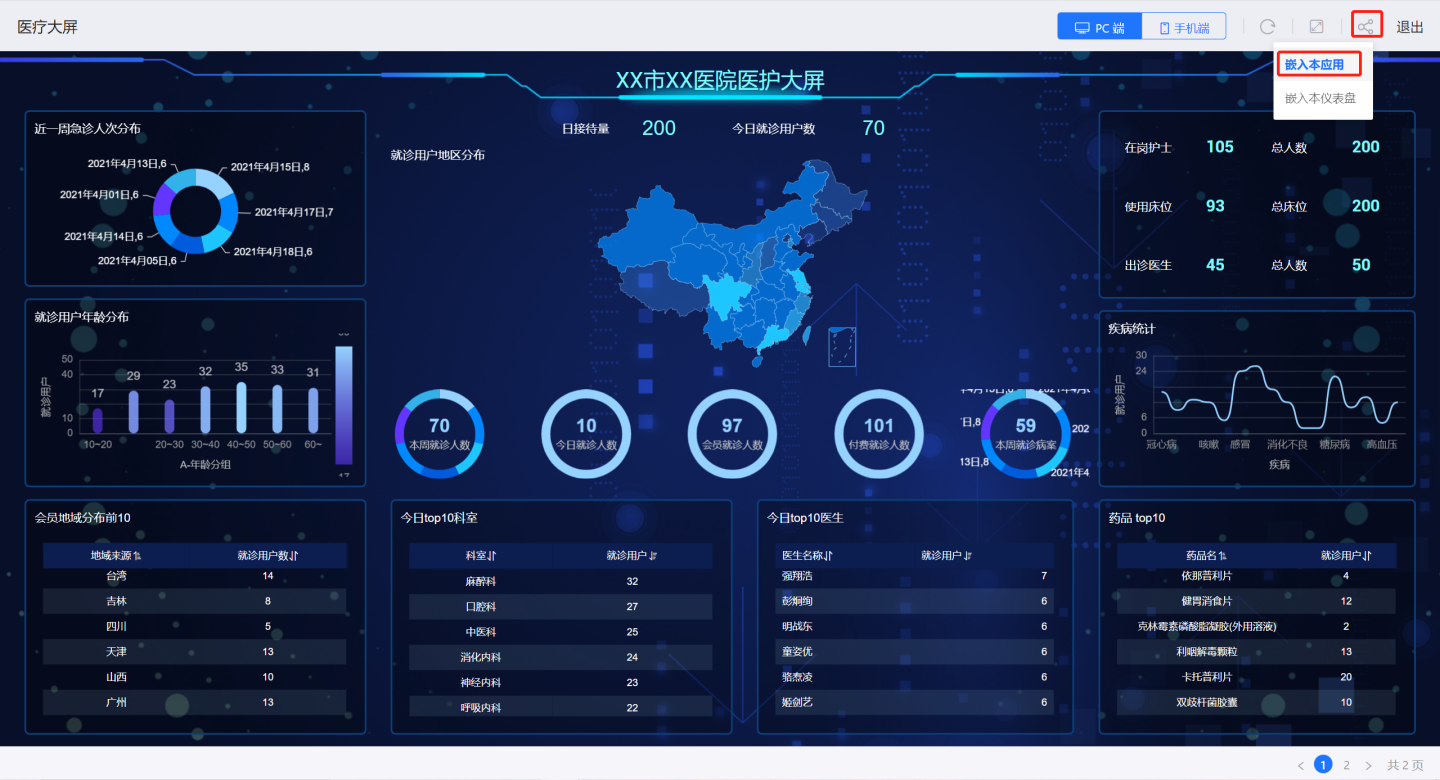
Click the embed button in the upper-right corner of the app and select "Embed This App."
The embedding window will appear, containing the embed URL and an iframe example.
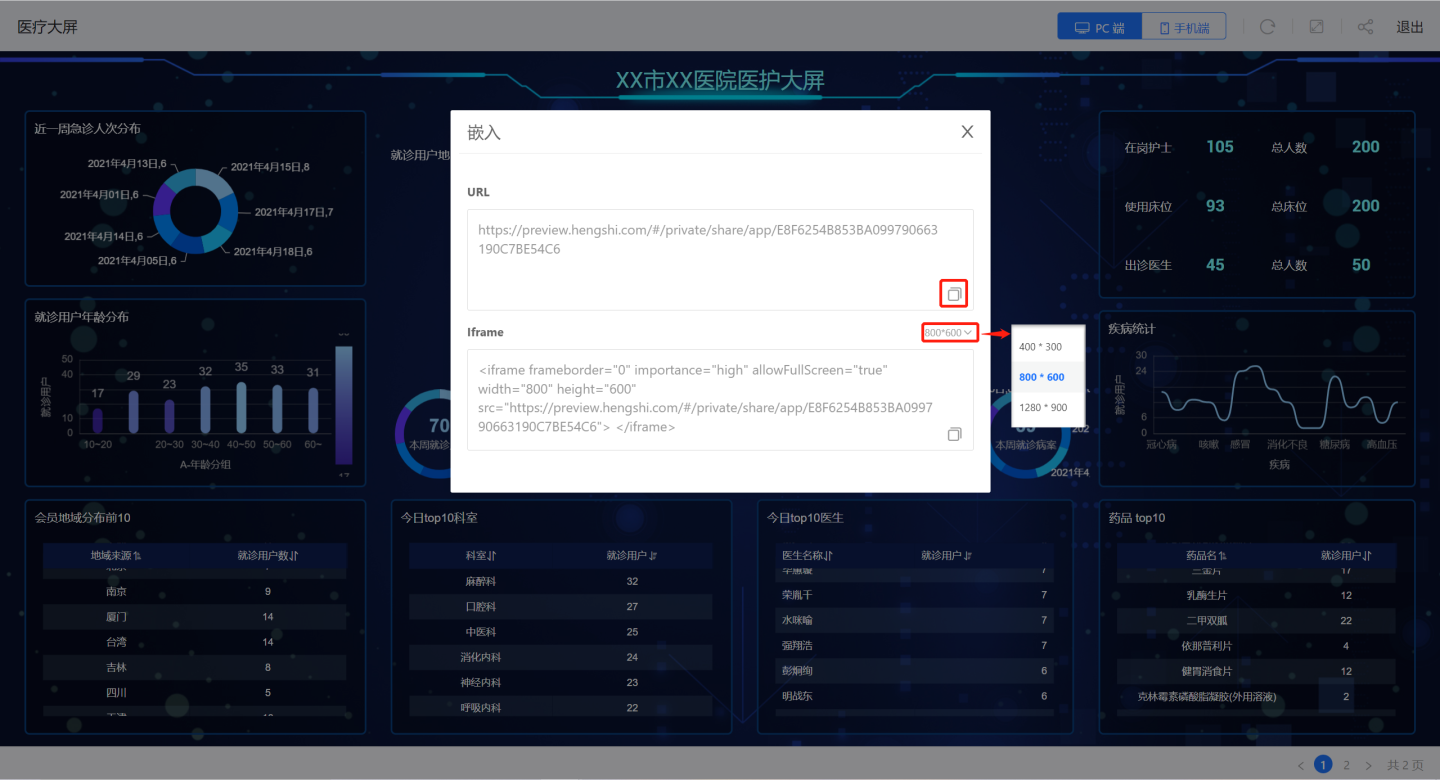
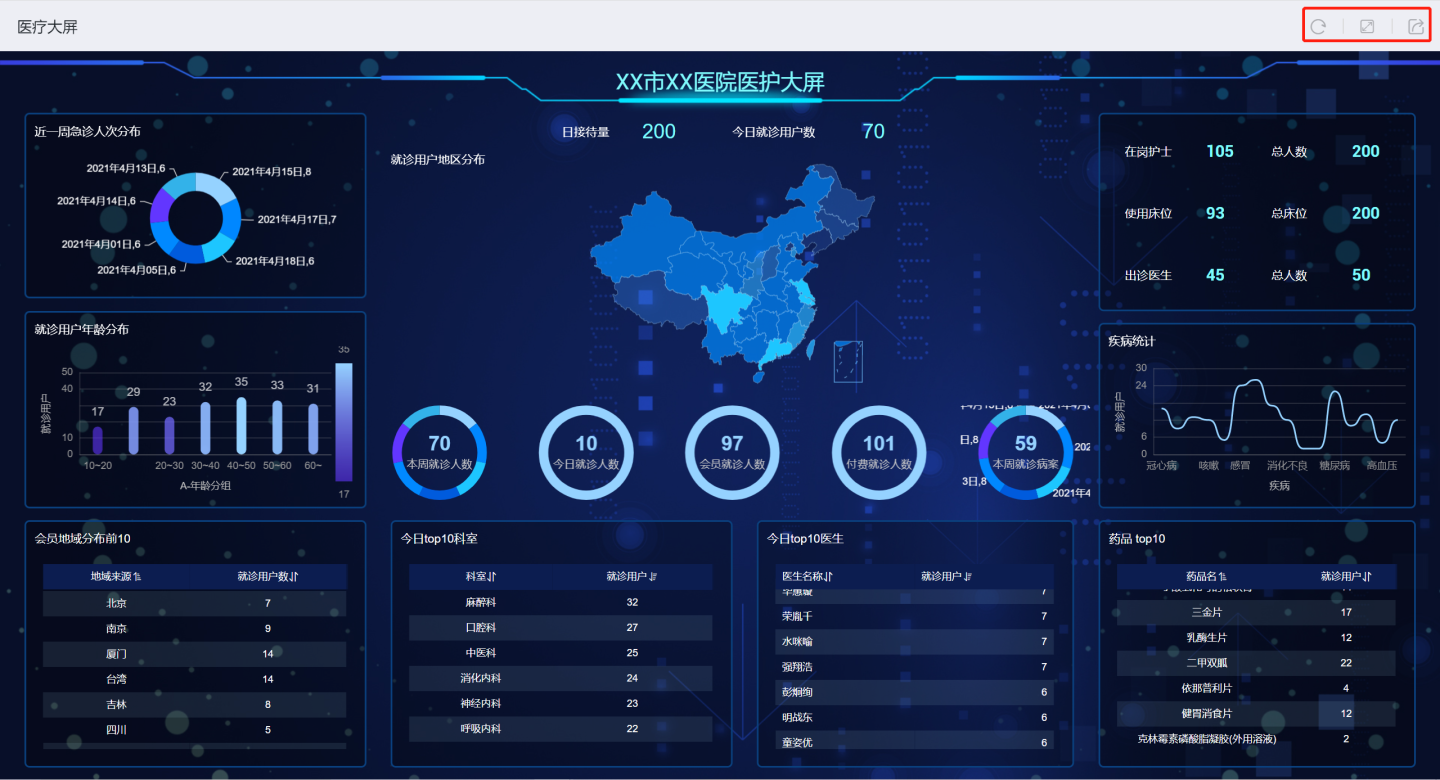
The URL in the embedding window can be directly shared, allowing users to display it in a browser using the link. As shown in the figure, the embedded page only includes refresh, fullscreen, and export buttons, without other functional operation buttons.
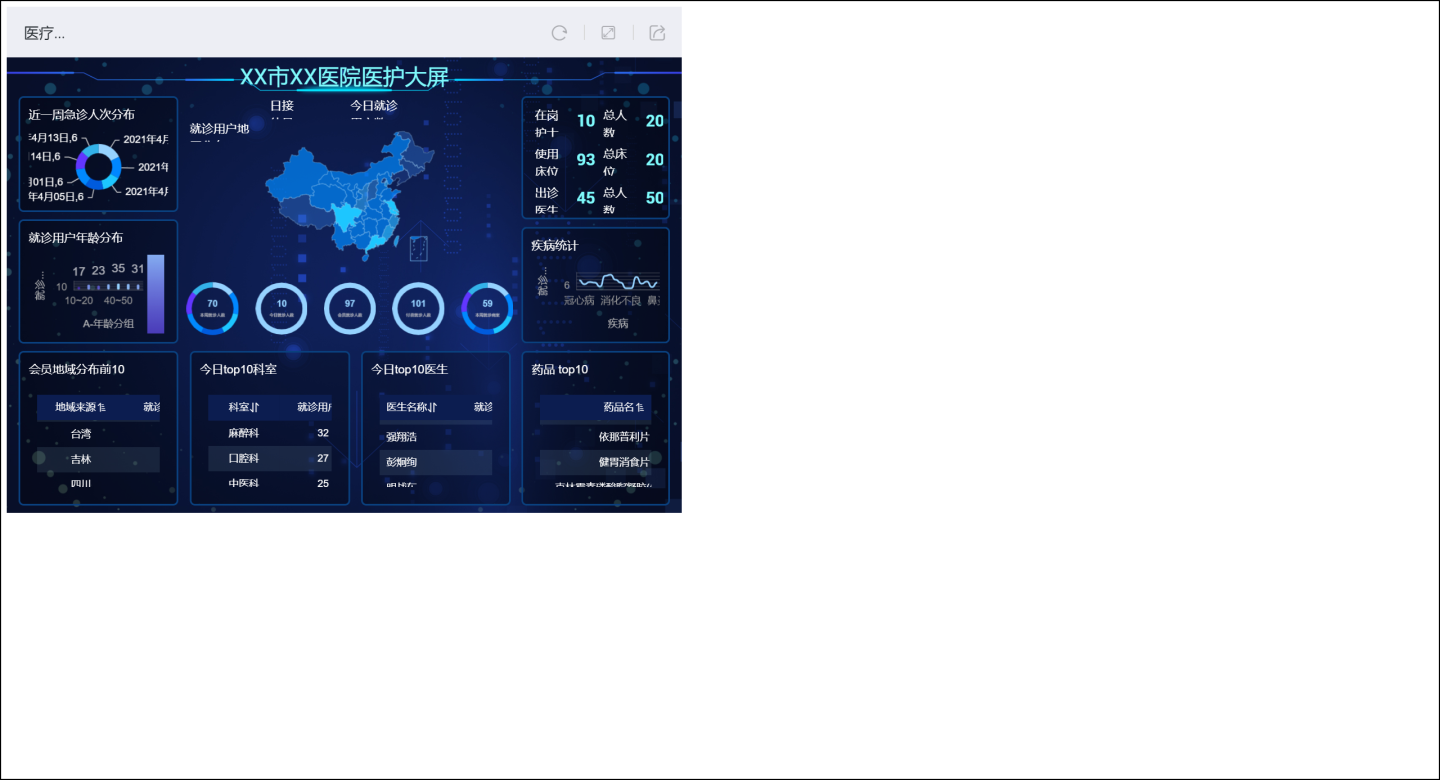
The iframe in the embedding window provides an example for embedding in code, supporting various custom parameters. Users can adjust the display style of the embedded content using these parameters. The example below shows the display effect of an iframe with a size of 800*600.
Notes
- When embedding apps or dashboards, only refresh, fullscreen, and export buttons are displayed, without PC-side functional buttons.
- For chart embedding, you need to open the chart first and then click the embed button to obtain the link content.
- Filters are not included during embedding.
Custom Parameters for Embedding Scenarios
Apps, dashboards, and charts support various custom parameters when embedded. Users can set embedding parameters as needed to influence the display effect after embedding.
Embedded Chart Parameters
| Parameter Name | Usage Example | Description |
|---|---|---|
| noTitle | 1. noTitle=true 2. noTitle=false 3. Default setting | Sets whether to display the title: true: Do not display the title false: Display the title Default setting: Display the title |
| titleColor | 1.titleColor=rgb(0, 0, 0) 2.titleColor=rgba(0, 0, 0, 1) 3.titleColor=red 4.titleColor=hsl(0,0,0) | Sets the color of the chart title. RGB hexadecimal color settings are not supported. |
| chartBackground | 1.chartBackground=rgb(0, 0, 0) 2.chartBackground=rgba(0, 0, 0, 1) 3.chartBackground=red 4.chartBackground=hsl(0,0,0) 5.chartBackground=transparent | Sets the background color of the chart. RGB hexadecimal color settings are not supported. When the parameter is set to "transparent," the chart displays a transparent background color. |
| chartPadding | 1. chartPadding=0 2. chartPadding=40 3. Default: 20px | Sets the padding around the embedded chart in pixels. Default is 20px. Users can set it to 0 for no padding or any positive number for custom padding. |
| noFilter | 1. noFilter=true 2. noFilter=false 3. Default setting | Sets whether to display filter tags: true: Do not display filter tags false: Display filter tags Default setting: Display filter tags. Charts typically inherit dashboard filters and display them as tags above the chart. In embedded scenarios, users typically do not want these filter tags to be shown. |
Embedded Dashboard Parameters
| Parameter Name | Usage Example | Description |
|---|---|---|
| copyright | 1. copyright=true 2. copyright=false 3. copyright=other values | Whether to display the header and footer: true: display false: do not display Default setting: display |
| background | 1.background=rgb(0, 0, 0) 2.background=rgba(0, 0, 0, 1) 3.background=red 4.background=hsl(0,0,0) | Dashboard background color, RGB hexadecimal color settings are not supported |
| padding | padding=5 | Sets the margin, unit is pixels (px) |
| scrollable | 1. scrollable=true 2. scrollable=false 3. scrollable=other values | Vertical scrollbar settings for the dashboard: true: scrollable false: not scrollable Other values: default setting is scrollable |
| chartBackground | 1.chartBackground=rgb(0, 0, 0) 2.chartBackground=rgba(0, 0, 0, 1) 3.chartBackground=red 4.chartBackground=hsl(0,0,0) chartBackground=transparent | Sets the chart background color, RGB hexadecimal color settings are not supported When the parameter is "transparent", the background color is transparent |
| chartGap | chartGap=5 | Sets the gap between charts, unit is pixels (px) |
| chartTitleColor | 1.chartTitleColor=rgb(0, 0, 0) 2.chartTitleColor=rgba(0, 0, 0, 1) 3.chartTitleColor=red 4.chartTitleColor=hsl(0,0,0) | Sets the chart title color, RGB hexadecimal color settings are not supported |
| chartAccessible | 1. chartAccessible=true 2. chartAccessible=false 3. chartAccessible=other values | true: accessible false: not accessible Other values: default setting is accessible |
| isMobile | name="isMobile" | When using this parameter, the dashboard is displayed in mobile style. Note that if the dashboard does not have a corresponding mobile display style, using this parameter will result in a 404 error. |
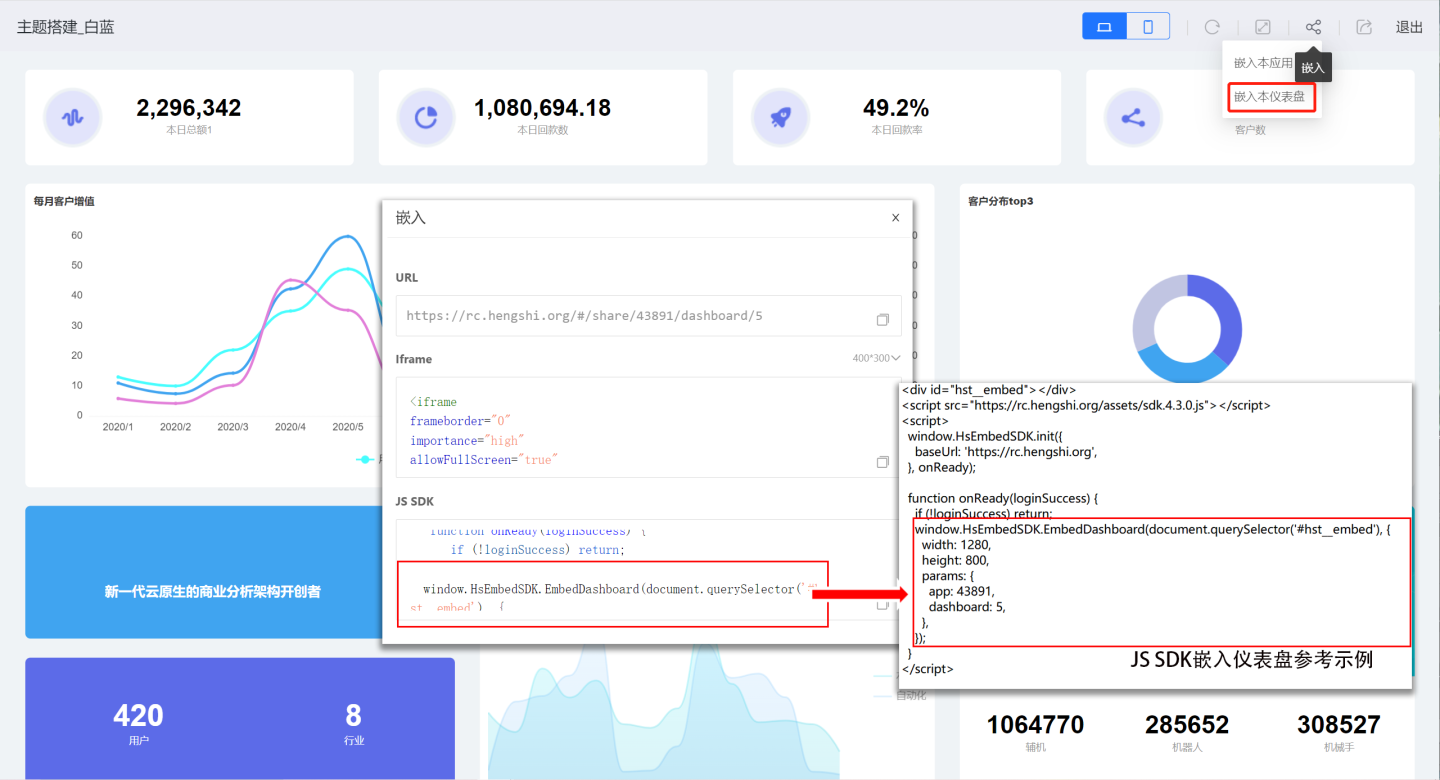
JS SDK Embedding
During the iframe embedding process, the browser performs two renderings, which increases the page load time. When multiple charts are embedded in a single page, each chart undergoes two renderings, resulting in slower overall page load speed and affecting the page display performance.
To better address the performance issues of embedding dashboards and charts, the system introduces the JS SDK embedding method, which directly renders dashboards and charts within the embedded page. When multiple dashboards or charts are embedded in the same page, each embedded page only loads static resources once, significantly improving rendering speed compared to iframe embedding. JS SDK embedding supports dynamic adjustments to the embedded page's styles and interactions, making the embedding method more flexible. However, the JS SDK has a higher usage threshold compared to iframe embedding, requiring the embedding personnel to be familiar with JavaScript.
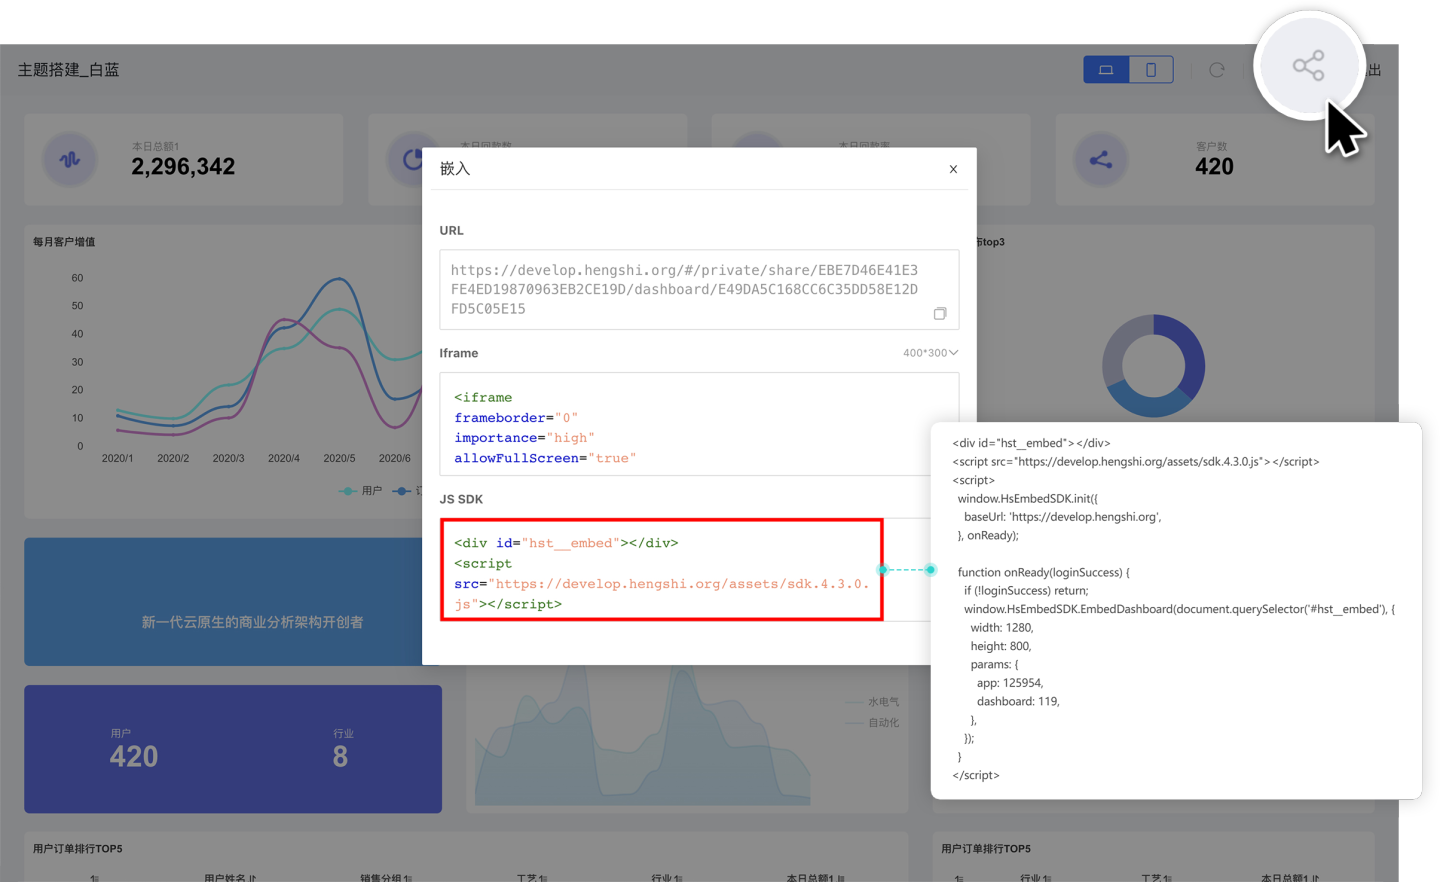
The JS SDK embedding example is as follows, divided into three parts: importing the sdk.js file, initializing the SDK, and embedding.
<div id="hst__embed"></div>
<script src="https://develop.hengshi.org/assets/sdk.4.3.0.js"></script>
<script>
  window.HsEmbedSDK.init({
    baseUrl: 'https://develop.hengshi.org',
  }, onReady);

  function onReady(loginSuccess) {
    if (!loginSuccess) return;
    window.HsEmbedSDK.EmbedChart(document.querySelector('#hst__embed'), {
      width: "1573",
      height: "948",
      params: {
        app: 126457,
        dashboard: 5,
        chart: 37,
      },
    });
  }
</script>Referencing the SDK's JS File
The following example demonstrates how to reference the SDK's JS file. The SDK's JS file varies for each environment. The purpose of referencing it is to include the global variable HsEmbedSDK on the windows domain of the embedded page, preparing for the subsequent rendering of embedded dashboards or charts.
<script src="https://develop.hengshi.org/assets/sdk.4.3.0.js"></script>Initialize SDK
Use the HsEmbedSDK.init function to initialize the SDK, as shown in the example below.
<script>
  window.HsEmbedSDK.init({
    baseUrl: 'https://develop.hengshi.org',
  }, onReady);

  function onReady(loginSuccess) {
    if (!loginSuccess) return;
    window.HsEmbedSDK.EmbedChart(document.querySelector('#hst__embed'), {
      width: "1573",
      height: "948",
      params: {
        app: 126457,
        dashboard: 5,
        chart: 37,
      },
    });
  }
</script>When initializing, you need to pass two parameters:
- Parameter 1 is an object, structured as follows. The
baseUrlis the system deployment address. In the example,https://develop.hengshi.orgis a primary address, and secondary addresses are also supported.noAuthindicates whether authentication is enabled. By default, it is set totrue, meaning authentication is enabled. Setting it tofalseskips authentication.
interface SDKConfig {
    baseUrl: string;
    noAuth?: boolean;
}- Parameter 2 is a callback function. In the example,
onReadyis the callback function.
Tip
If using JWT authentication, noAuth needs to be set to true, and the JWT parameter must be passed in the embedded dashboard or chart. Example:
  window.HsEmbedSDK.init({
    noAuth: true,
    baseUrl: 'https://develop.hengshi.org',
  }, onReady);
  function onReady(loginSuccess) {
    if (!loginSuccess) return;
    window.HsEmbedSDK.EmbedDashboard(document.querySelector('#hst__embed'), {
      width: window.innerWidth,
      height: window.innerHeight,
      params: {
        app: 125396,
        dashboard: 1,
      },
      location: {
        query: {
          activeAuth: 'jwt-param',
          jwtParam: 'c3MiOiLlj5HooYzogIU6emhlbmdjaHVueGkiLCJzdWIiOiJtYXJzaGFsbCJ9.cCX2yMcMpJYnE4mU7xDewD22uCyj-o'
        },
      },
    });
}Embedding Dashboards/Charts
After referencing the SDK's JavaScript file and initializing the SDK, you can start embedding dashboards and charts into your application.
Tip
When embedding multiple dashboards and charts, you only need to reference the SDK's JavaScript file and initialize the SDK during the first embedding. When embedding applications or dashboards, only buttons for refresh, fullscreen, and export are displayed; functionality buttons for PC mode are not shown. When embedding charts, you need to open the chart first, then click the embed button to obtain the link content. Filters are not included during embedding. The JS SDK initially supports embedding dashboards and charts from analysis applications, and future versions will continue to expand the range of supported embeddings.
Embed Dashboard
Use the HsEmbedSDK.EmbedDashboard(Element, DashboardOptions) function to embed a dashboard. This function requires two parameters: Element and DashboardOptions. Click the embed icon in the dashboard, select "Embed this Dashboard," and view the embedding example.
Element: The DOM element for embedding, which can be obtained from the embedding example. In the example, the
Elementpassed isdocument.querySelector('#hst__embed').DashboardOptions: Parameters related to the dashboard, with the following structure:
- useshadowDom: Uses shadow DOM for style isolation. Boolean type, default is
true. This parameter is optional. - width: The width of the embedded dashboard. Numeric type, unit is
px. This parameter is required. - height: The height of the embedded dashboard. Numeric type, unit is
px. This parameter is required. - params: The application ID and dashboard ID where the dashboard resides. These can be obtained from the embedding example. This parameter is required.
- location: If you need to add filter parameters to the URL, you can pass parameters through
location.query. This parameter is optional.
- useshadowDom: Uses shadow DOM for style isolation. Boolean type, default is
interface Dashboardoptions {
  useshadowDom?: boolean;
  width: number;
  height:number;
  params:{
    app: number | string;
    dashboard: number | string;
  };
  location?:{
    query?: string | Record<string, any>;
  },
}
Embed Chart
Use the HsEmbedSDK.EmbedChart(Element, ChartOptions) function to embed a chart. This function requires two parameters: Element and ChartOptions. Click the embed icon on the chart to view the reference example for chart embedding.
Elementis the DOM element where the chart will be embedded. You can obtain it from the embedding example. In the example, theElementpassed isdocument.querySelector('#hst__embed').ChartOptionscontains parameters related to the chart. The structure is as follows:useShadowDom: Uses shadow DOM for style isolation. This is a boolean type and defaults totrue. This parameter is optional.width: The width of the embedded chart, specified as a numeric value inpx. This parameter is required.height: The height of the embedded chart, specified as a numeric value inpx. This parameter is required.params: Includes the application ID, dashboard ID, and chart ID where the chart resides. These can be obtained from the system-provided embedding reference example. This parameter is required.location: If you need to add filter parameters to the URL, you can pass parameters vialocation.query. This parameter is optional.
tsinterface ChartOptions { useShadowDom?: boolean; width: number; height: number; params: { app: number | string; dashboard: number | string; chart: number | string; }; location?: { query?: string | Record<string, any>; }; }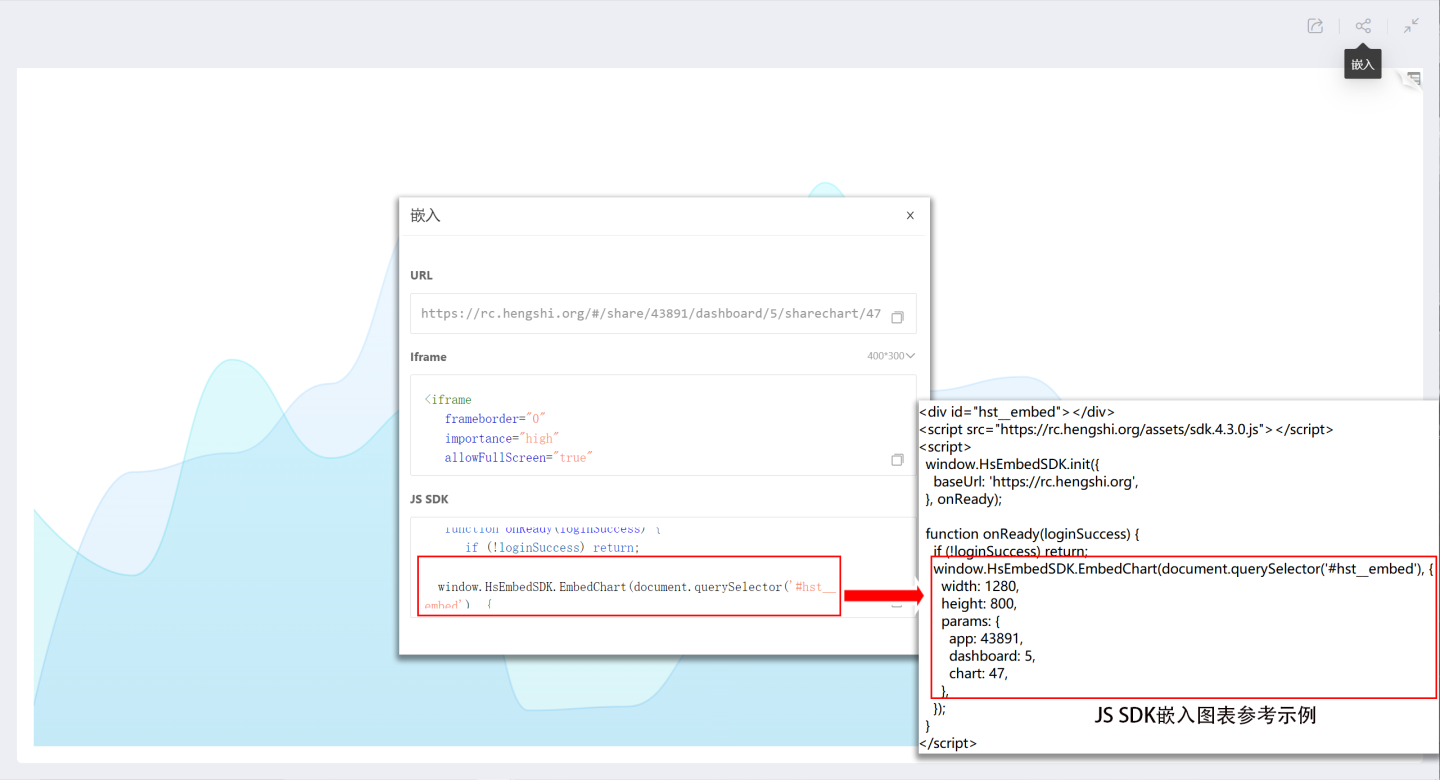
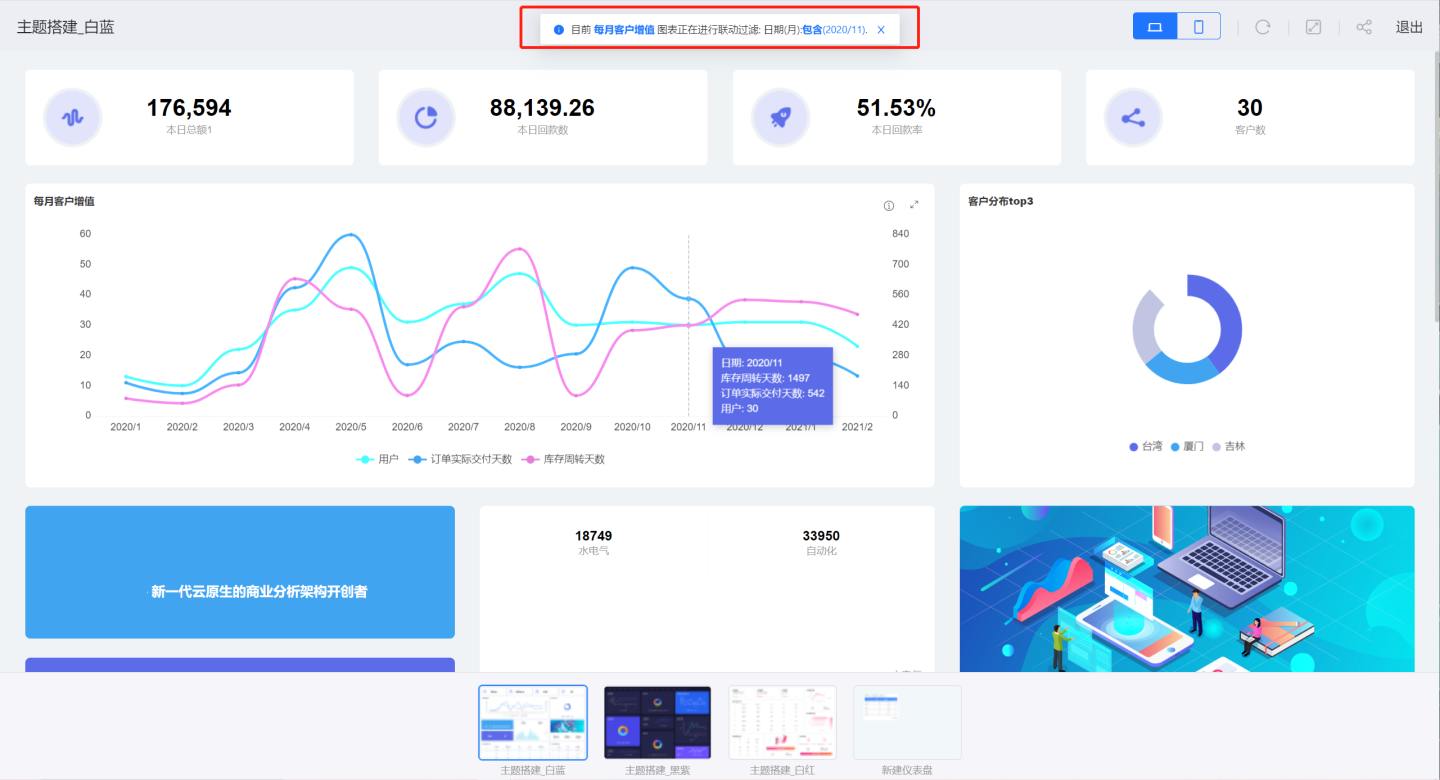
Clear Linked Filters
The JS SDK supports using the function HsEmbedSDK.clearFilters() to clear linked filters between charts. After calling this function, the linked filters shown in the diagram will be cleared, and no linkage will occur between charts.