KPI Chart
KPI stands for Key Performance Indicator. A KPI chart visually presents indicator status, enabling users to quickly grasp the current value and state of a metric.
The following section explains how to configure a KPI chart.
KPI Chart
Single-Metric KPI Chart
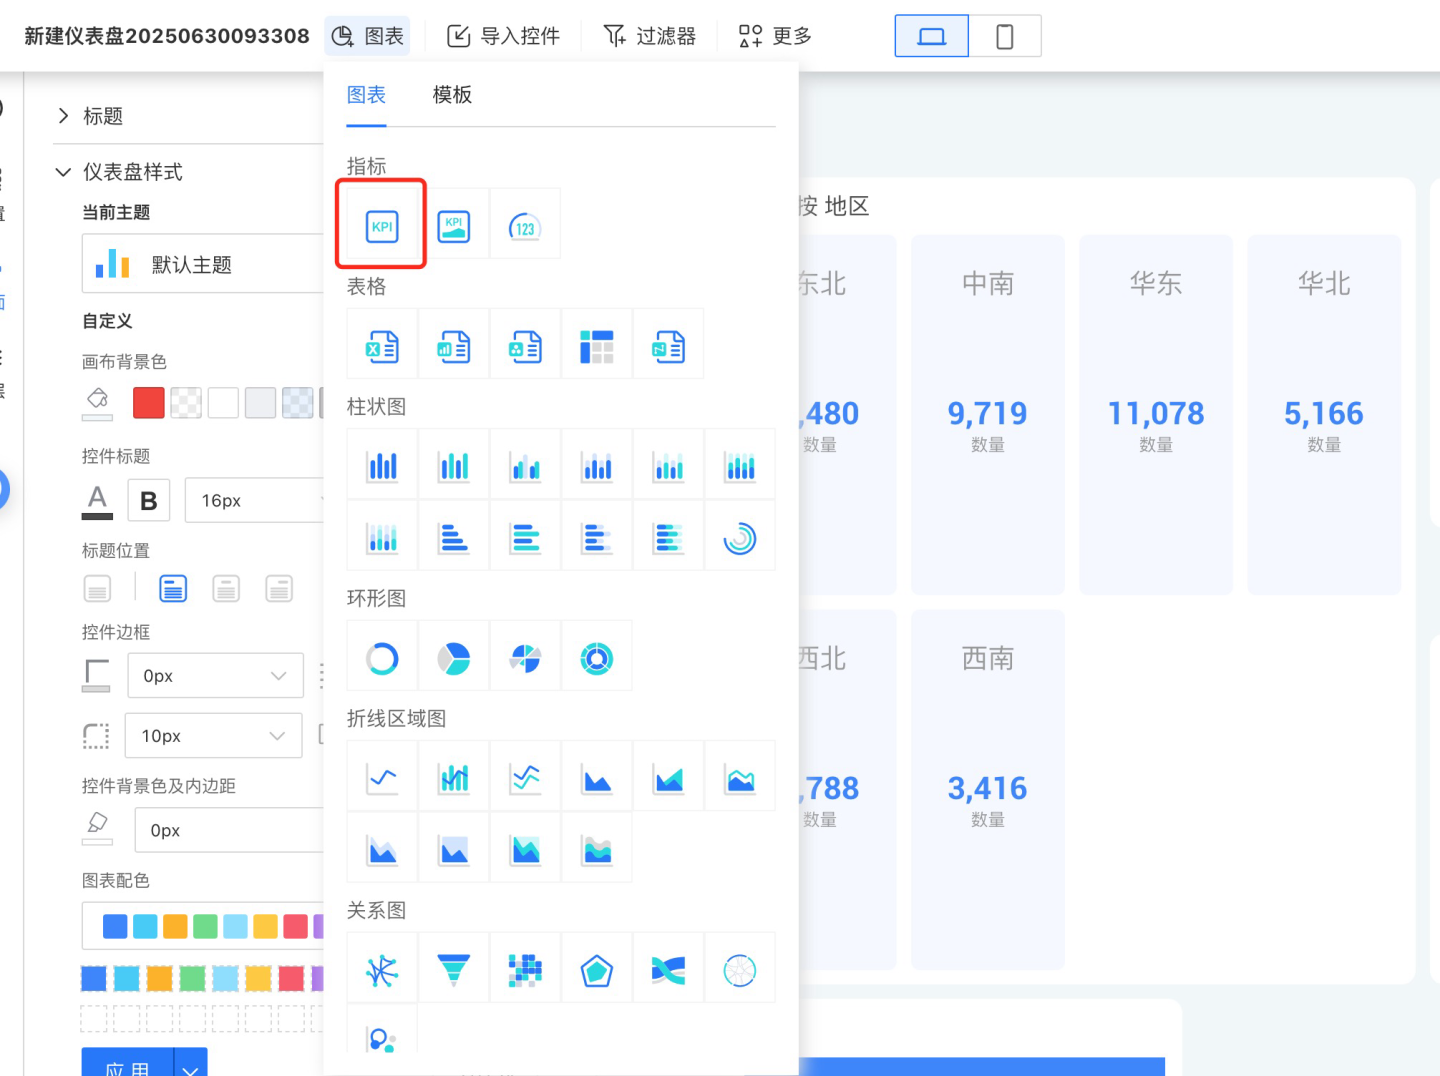
Click New Chart, pick the data source and Dataset, and choose KPI as the chart type.
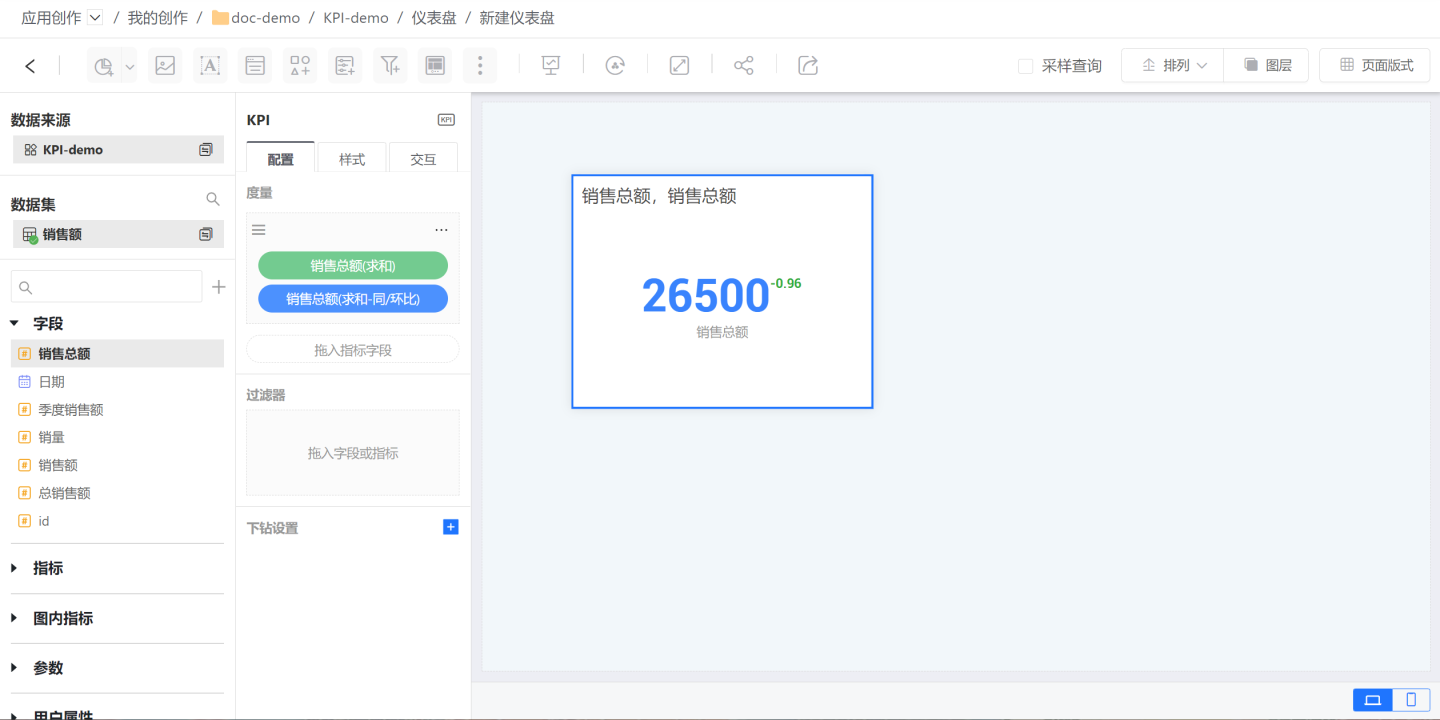
Drag the metric field “Total Sales” into the Metric slot and drag the same field into the Comparison Metric slot to calculate the YoY/MoM change of Total Sales.
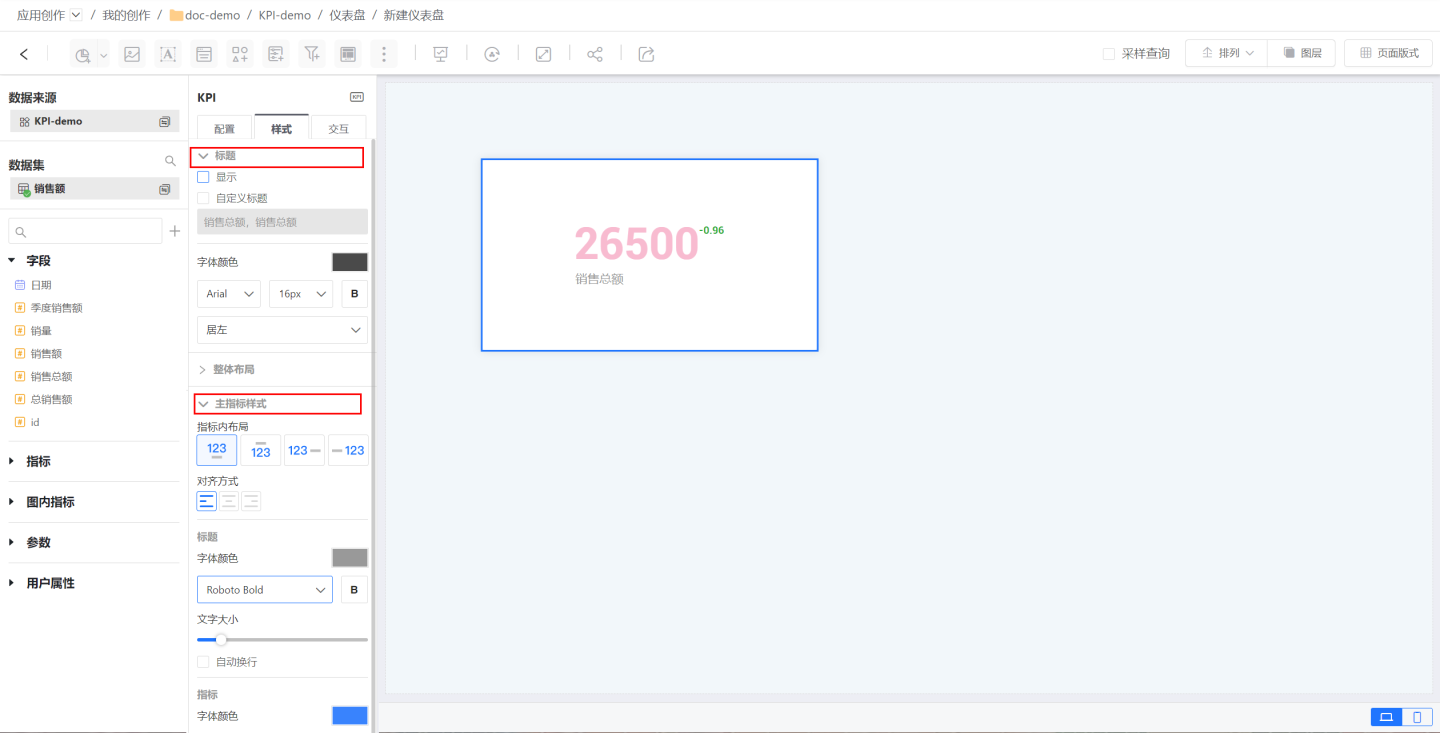
Adjust the KPI style: set the title, the main metric appearance, and the comparison measure style.
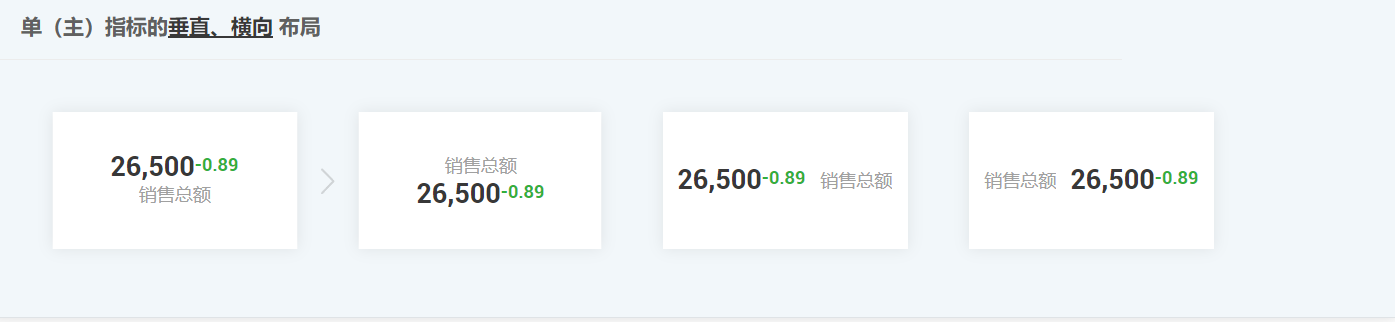
A simple KPI chart is now ready; single-metric KPIs support both vertical and horizontal layouts.
Multi-Metric KPI Chart
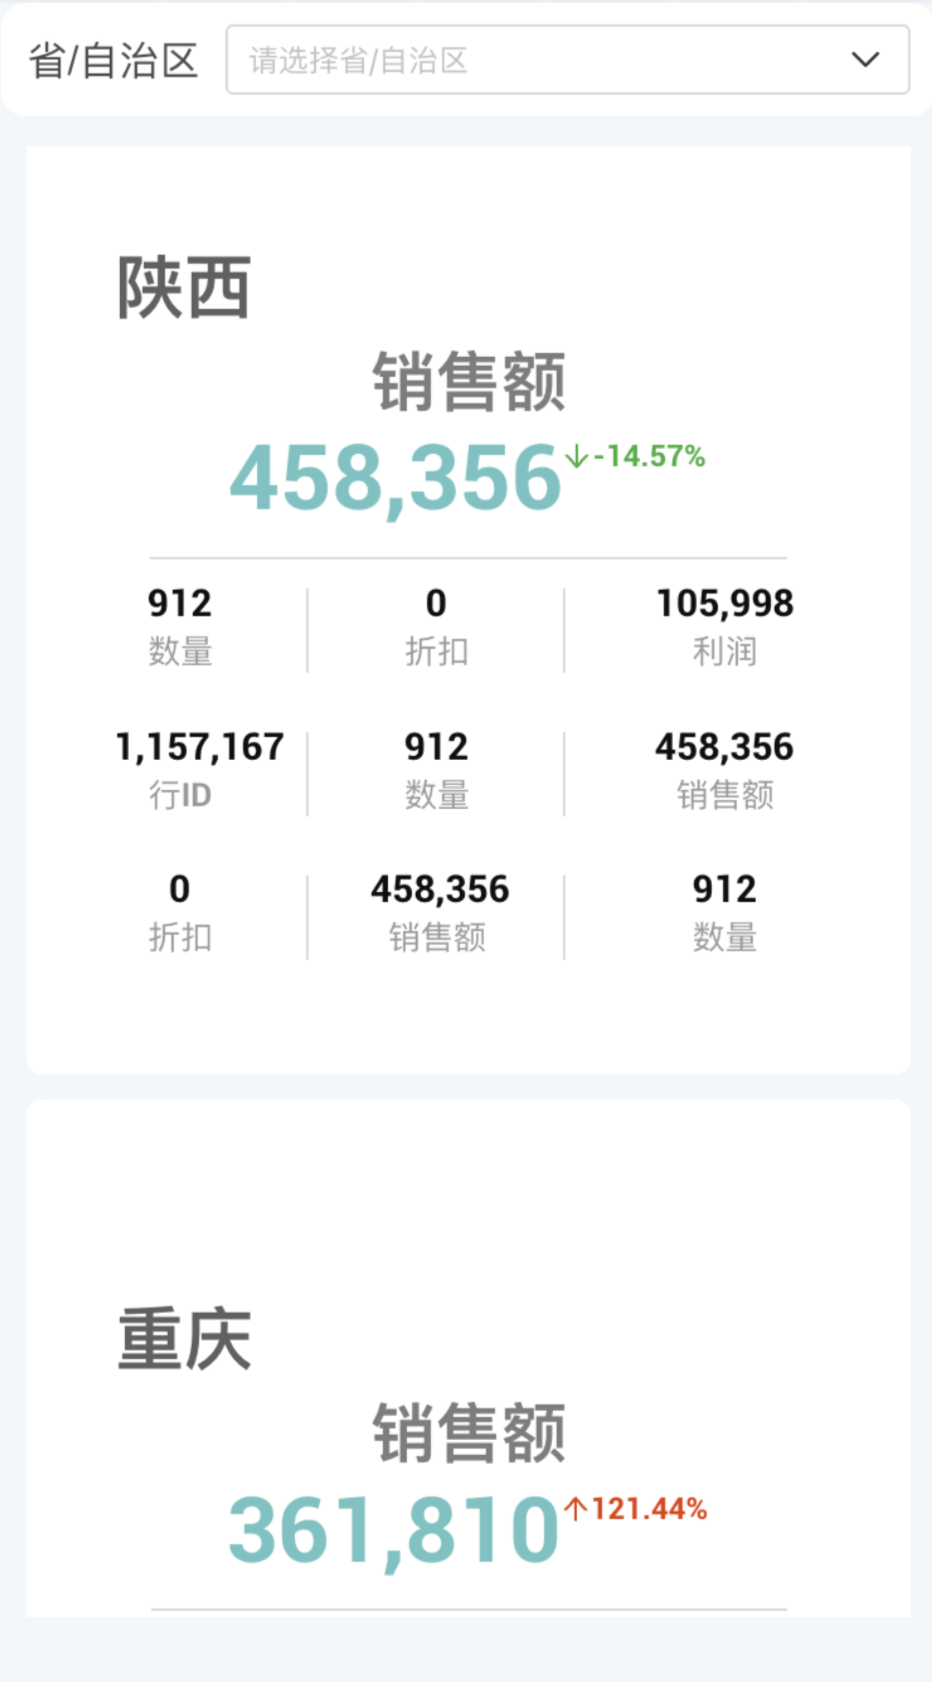
A Multi-Metric KPI Chart contains multiple metrics within a single chart. The first metric is the primary metric, while the others are secondary metrics. You can change the primary/secondary assignment by reordering the metrics.
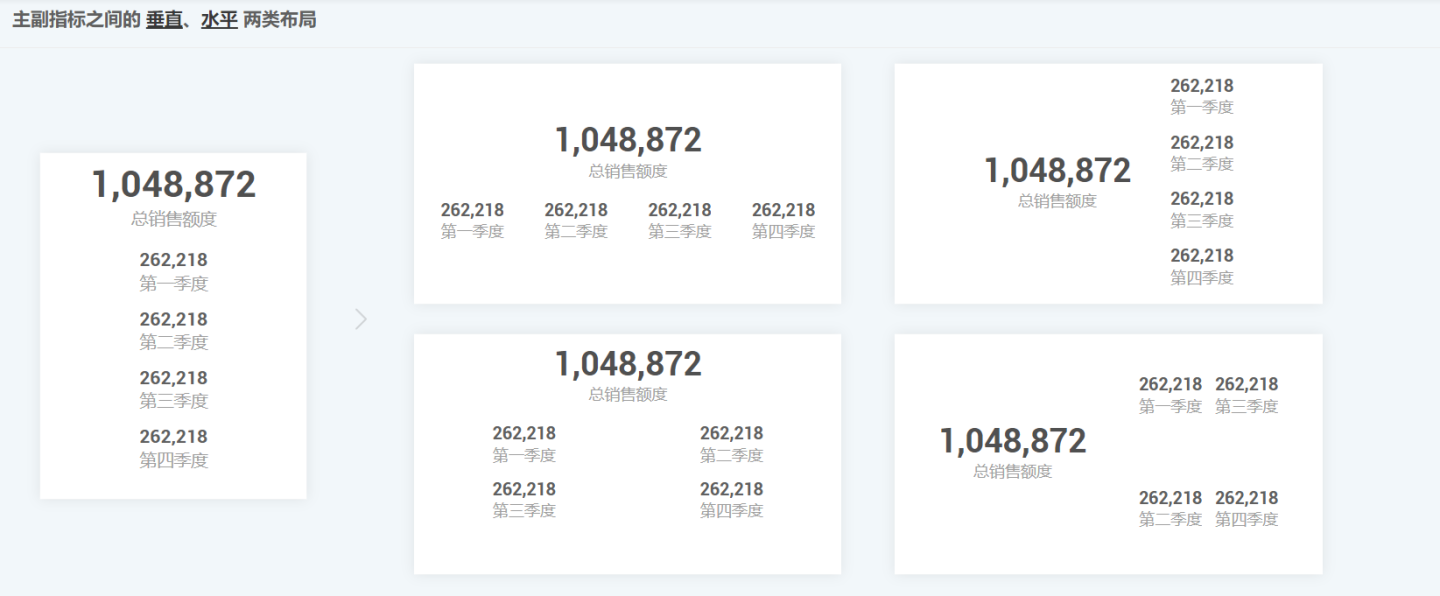
The creation process is identical to that of a single-metric KPI chart; the difference is that a Multi-Metric KPI Chart requires configuring the overall layout, the primary metric style, and the secondary metric styles. Common layout styles for multi-metric KPIs are shown below.
KPI Chart Supports Dimension Grouping
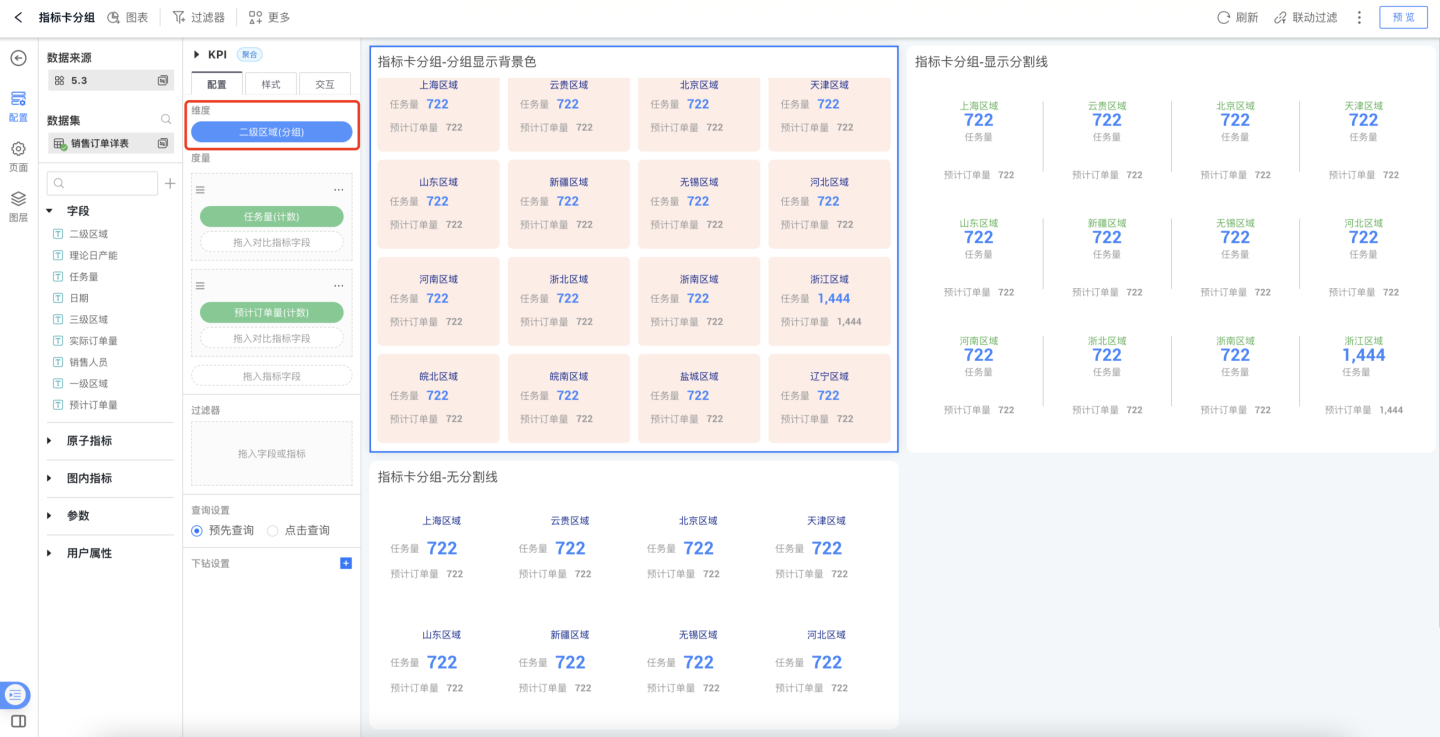
In analytical scenarios, it is common to compare KPI metrics horizontally under a specific dimension—for example, viewing the metric by city. To meet this need, we have enabled dimension-based grouping for the KPI chart. Simply add a dimension field, and the grouped comparison will be displayed in one step.
After grouping, you can configure the style of each grouped metric block under KPI Chart > Style > Metric Block Layout.
Metric Trend Card
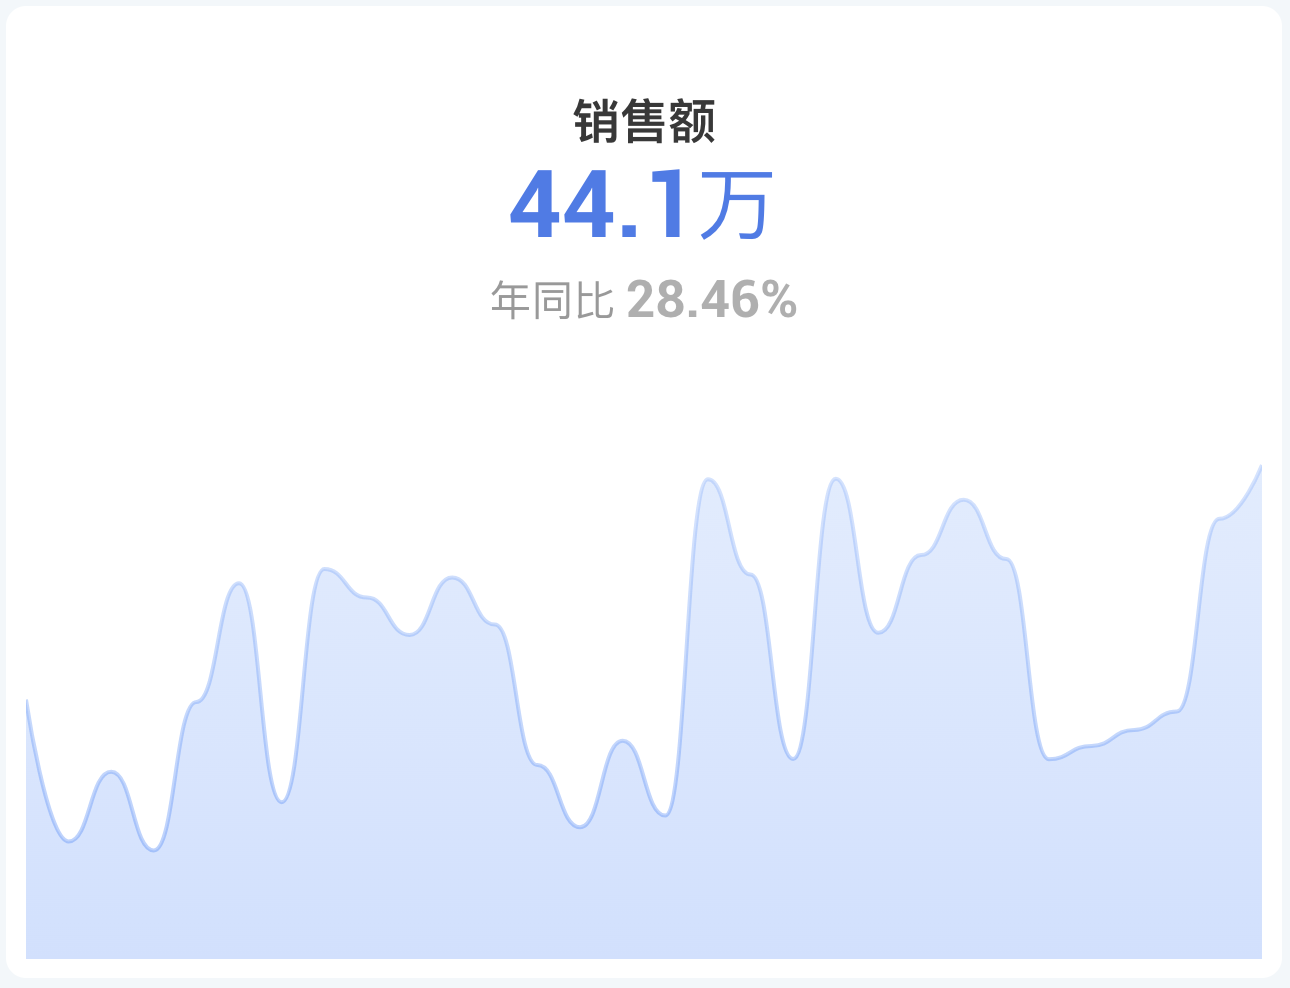
The Metric Trend Card lets you view the latest-period value of a metric while simultaneously displaying its trend over time.
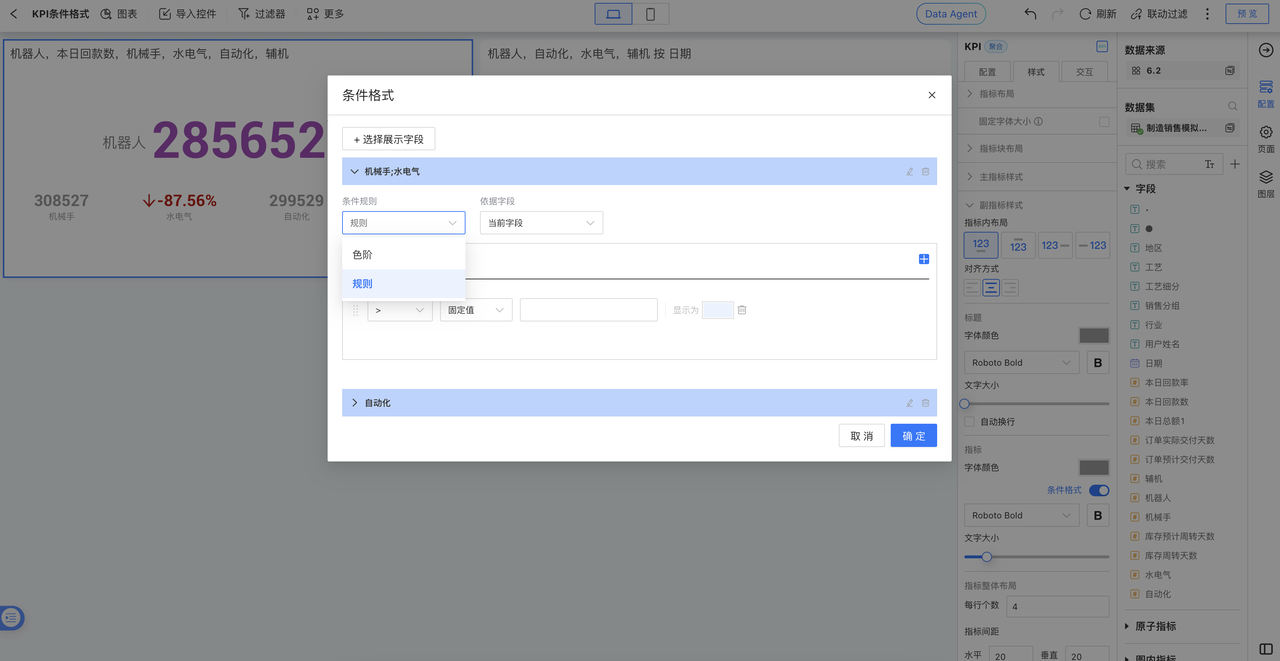
Conditional Formatting
KPI charts (Metric Card and Metric Trend Card) support conditional formatting, enabling visual alerts and highlighting through custom rules.
Version 6.2 Update
KPI conditional formatting now offers a new rule configuration method, introducing more flexible custom rules that allow independent settings for secondary metrics and comparison measures.
Optimized charts: Metric Card, Metric Trend Card
Legacy data handling: Previously configured rules remain intact after upgrade
KPI Control Interactions
KPI charts support interactive operations such as linked filtering, drill-down, and jump with other controls. Please click the link for detailed interaction settings.
Tip
After KPI supports dimension grouping, it supports linked filtering with other charts by dimension.