Cross-Tabulation
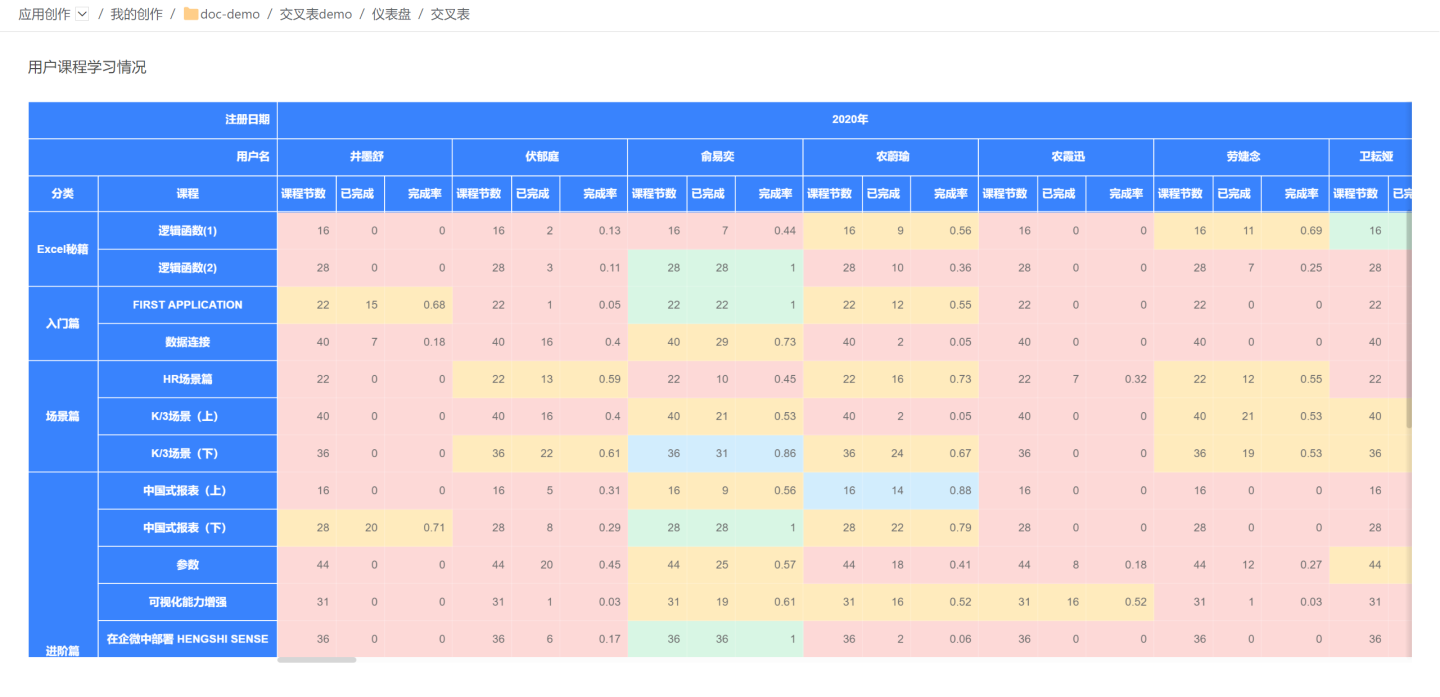
A cross-tabulation is a fundamental tabular display format composed of row fields, column fields, and measures. It is primarily used to group and present information within fields. It supports various summary calculations on data (sum, average, maximum, minimum, count, distinct count, etc.) and enables interactive operations such as linking and drilling.
Cross-Tabulation Quick-Start Example
Below we use an employee shift schedule to build a simple cross-tabulation.
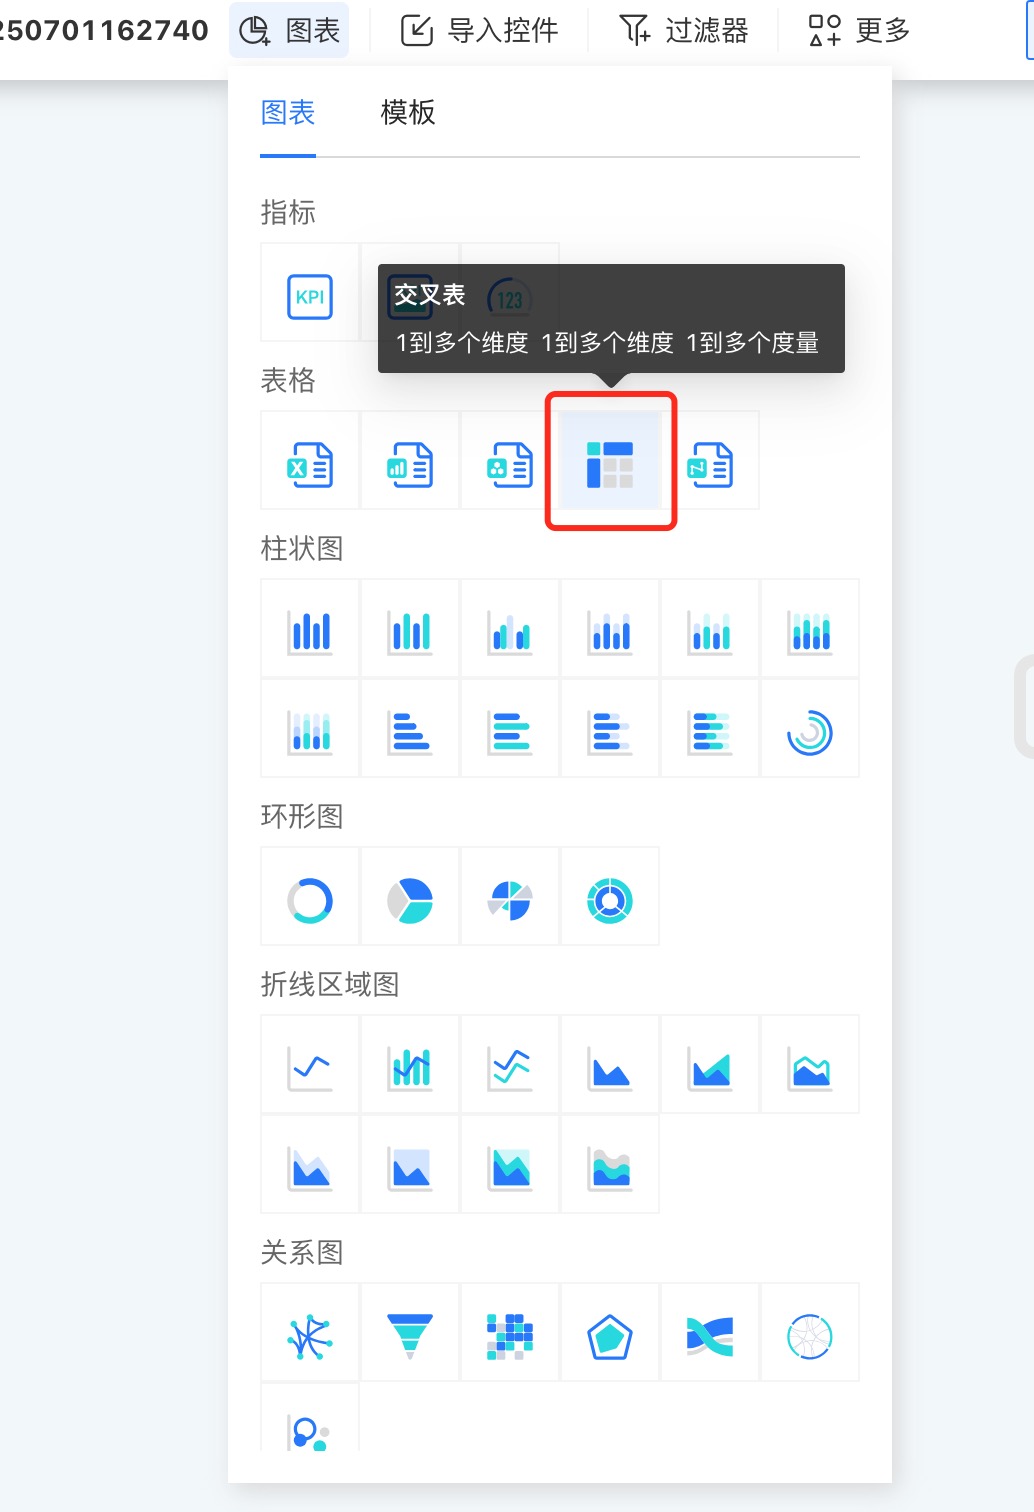
In the Dashboard, click New Chart → Cross-Tabulation, choose the data source and Dataset, then click OK.
Drag in a column field, a row field, and a measure to generate the cross-tabulation. The table will render only after all three fields are configured.
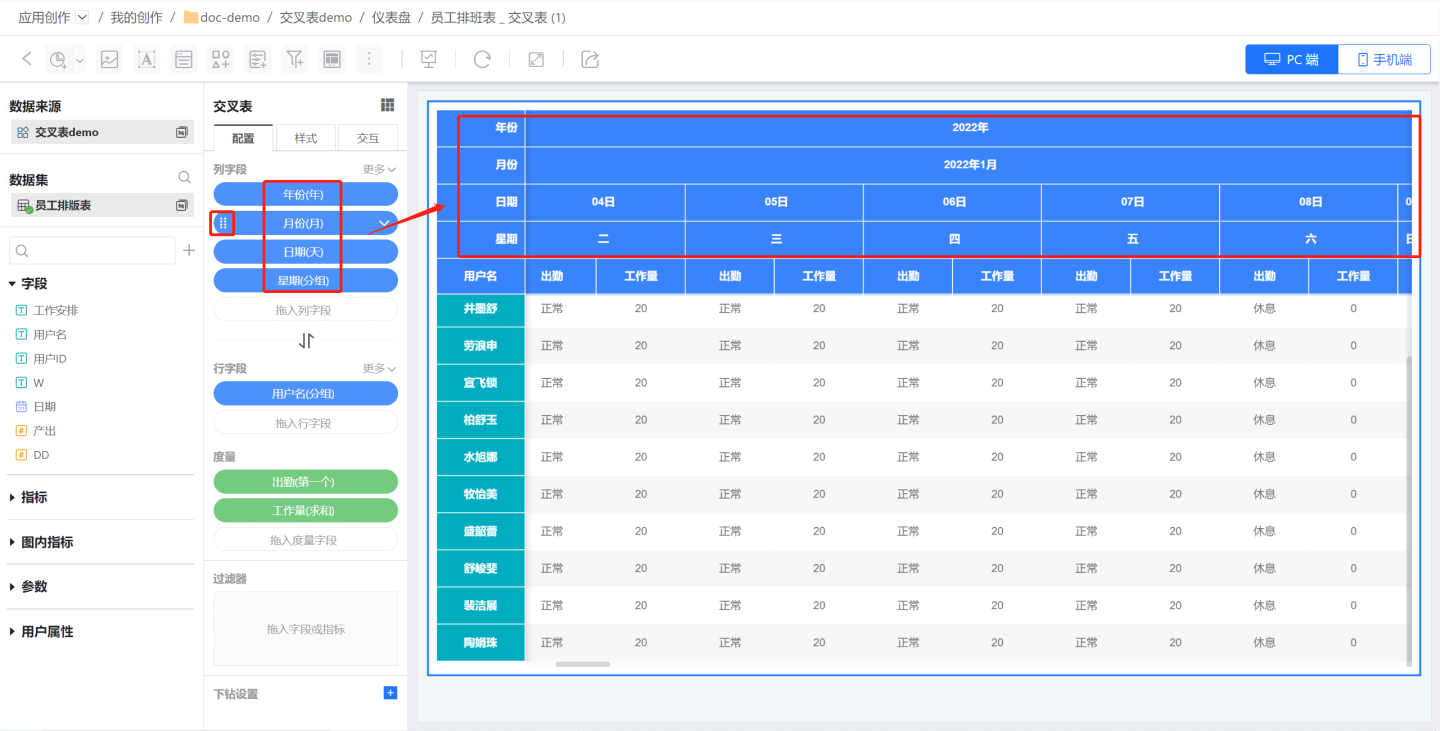
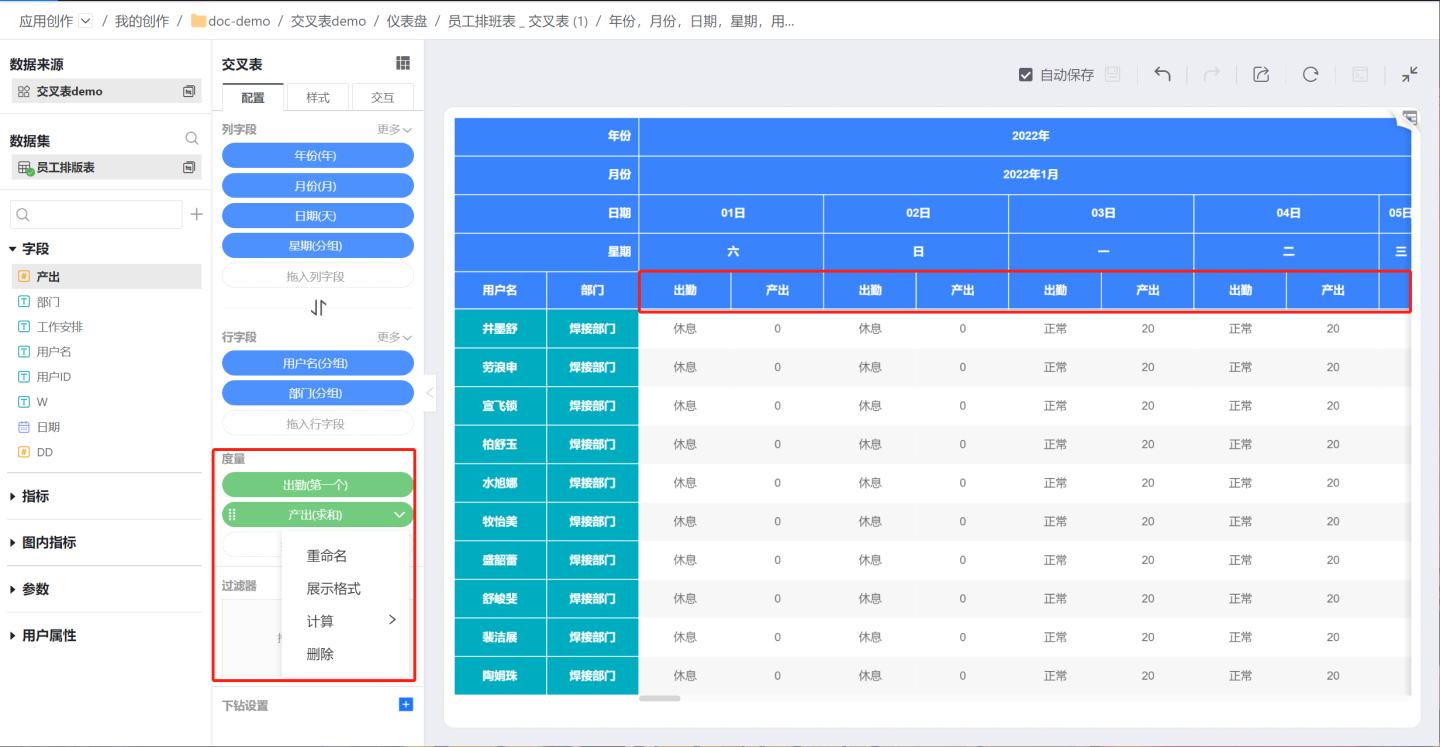
- First, drag the column fields Year, Month, Date, and Weekday to display the shift dates (red box area).
- Next, drag the row field Employee Name to show employee names (yellow area).
- Finally, drag the measure field Work Arrangement to show each employee’s attendance on a given day. Select the first aggregation to display the measure content as text.
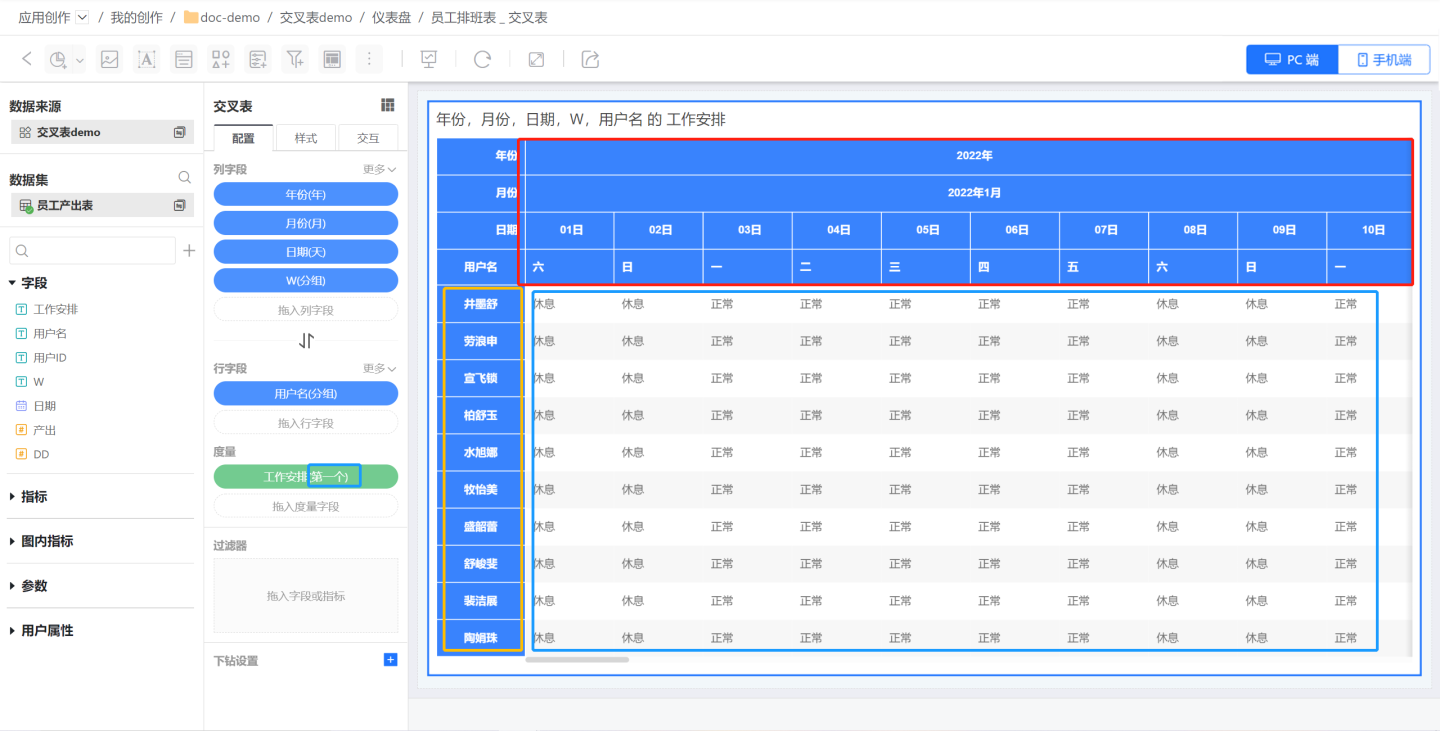
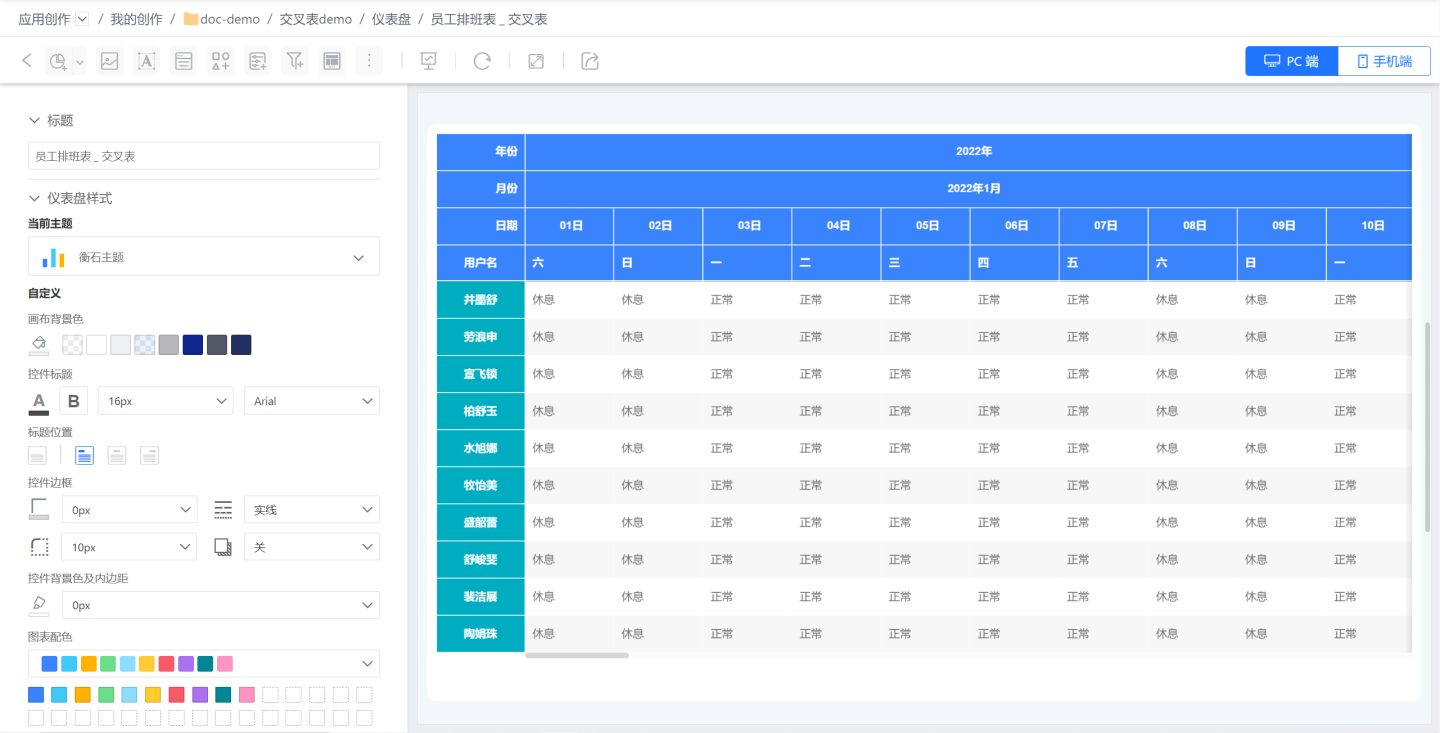
- Configure the cross-tabulation’s style and interactions to finish the chart.
Cross-table Configuration
The column and row fields of a cross-table are configured independently and do not affect each other; you can swap them with a single toggle button.
The rendering logic of a cross-table differs from that of other tables: the table is drawn only after column fields, row fields, and measure fields have all been assigned. Dropping only column or row fields will not trigger rendering.
Column Fields
Column fields are used to render the top header.
- Add Column Fields
- Add multiple column fields in sequence; they are ordered from top to bottom in the cross-tabulation and can be reordered manually.
- Users can edit the field names.
Row Fields
Row fields are used to render the left-side table headers and can be swapped with column fields in one click. 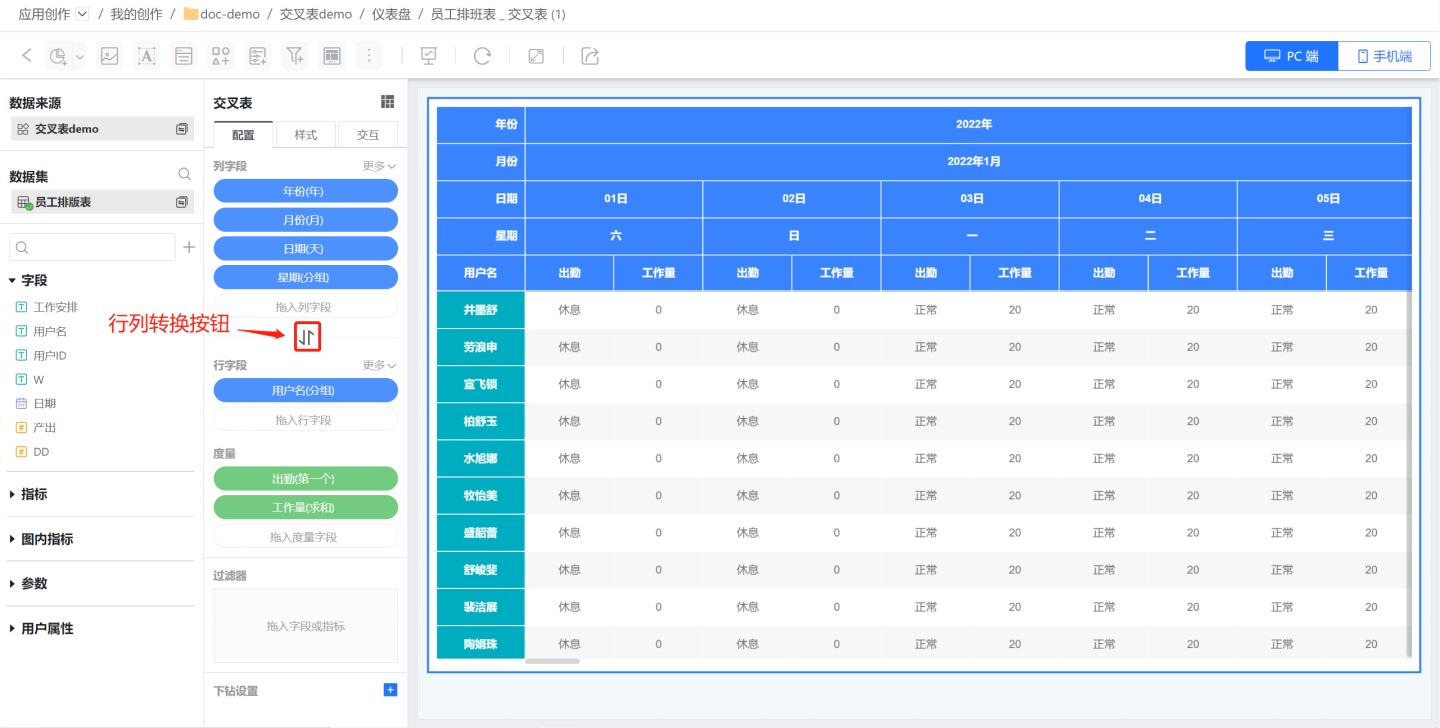
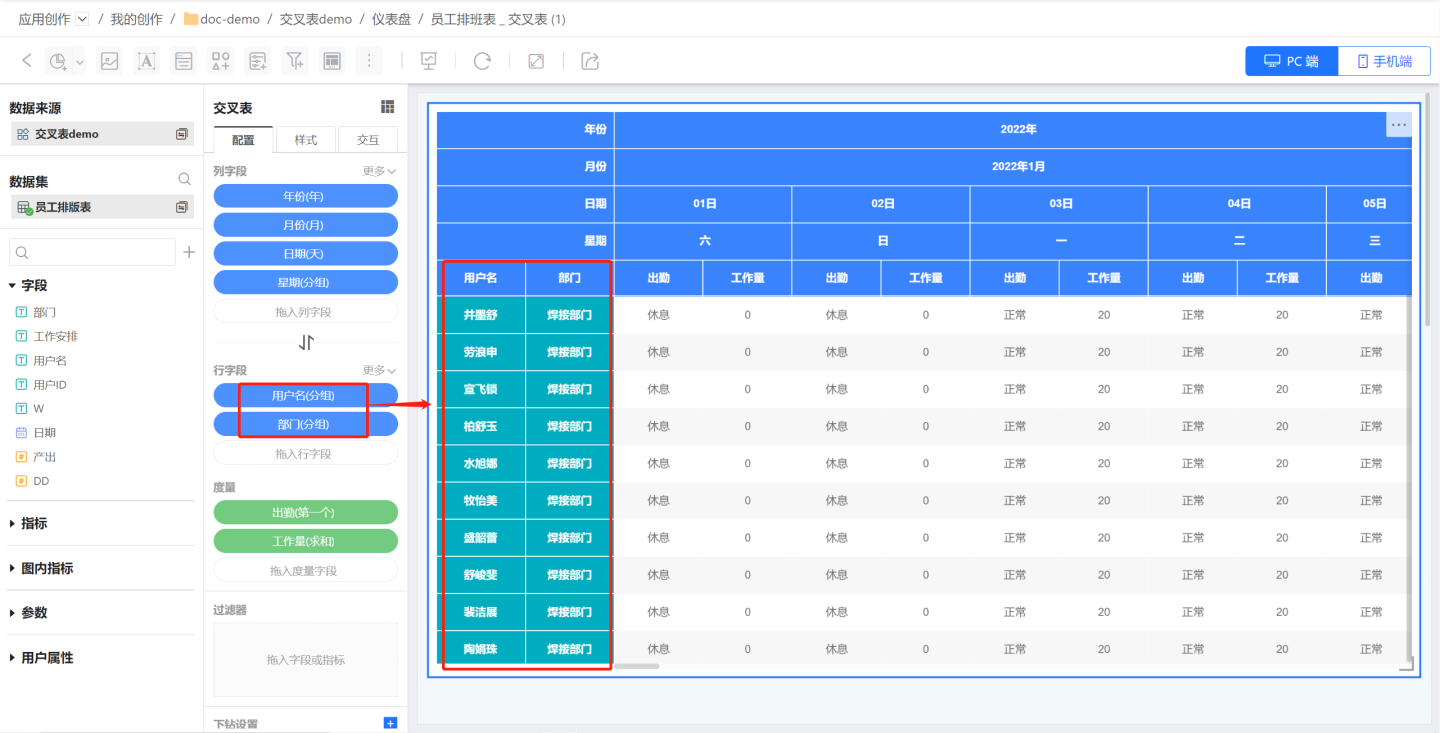
- Add Row Fields
- Add multiple row fields in sequence; they are ordered left-to-right in the cross-tabulation and can be reordered manually.
- Users can rename the field labels.
Field Sorting
The sorting rules for crosstab fields are identical to those for table fields; please refer to the Table Field Sorting Instructions to perform the sort.
Subtotals
Cross-tables support adding subtotals, including column-field subtotals and row-field subtotals.
Column Subtotals
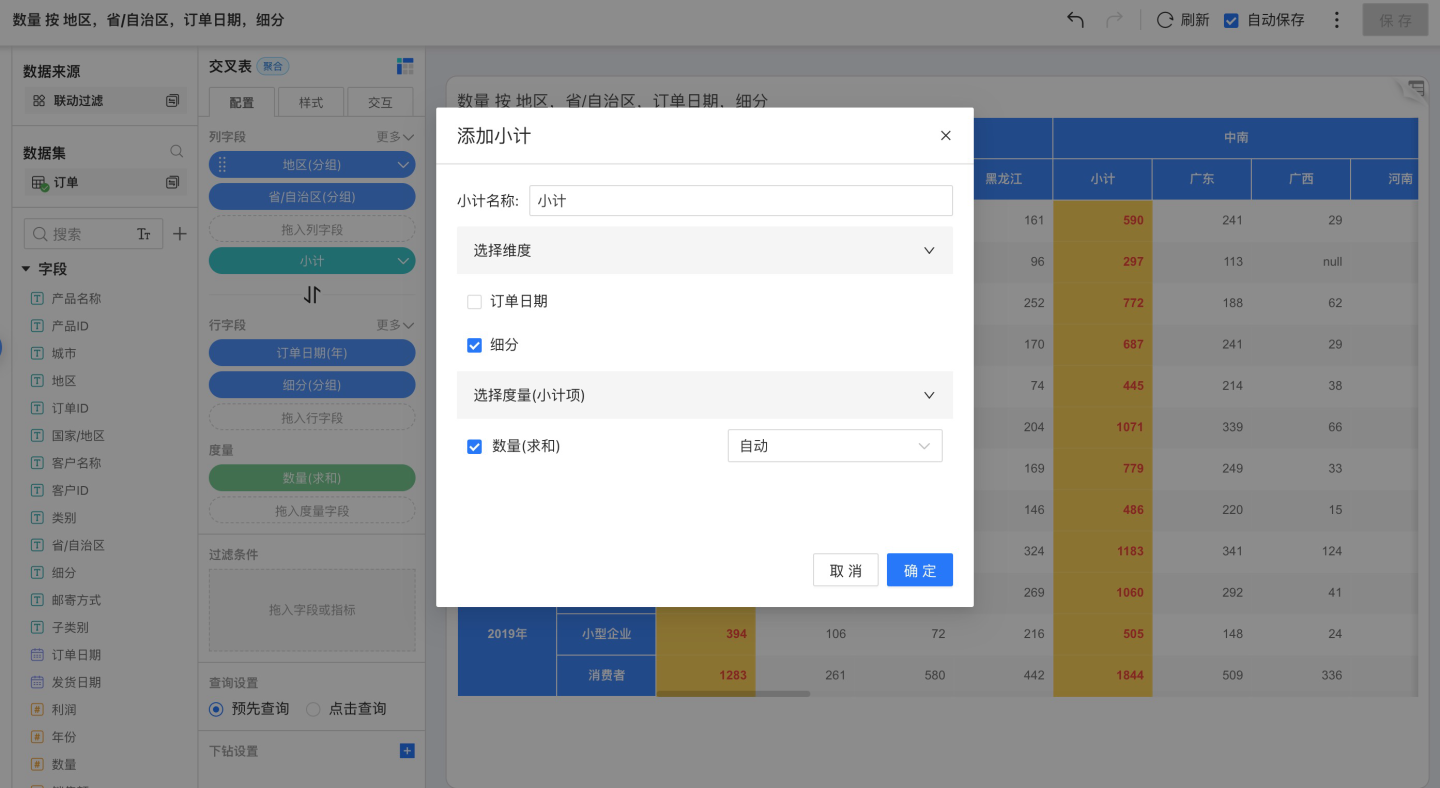
Click the More button on the right of a column field → Show Subtotal to open the subtotal settings panel, where you can edit the subtotal name and select the field to subtotal. 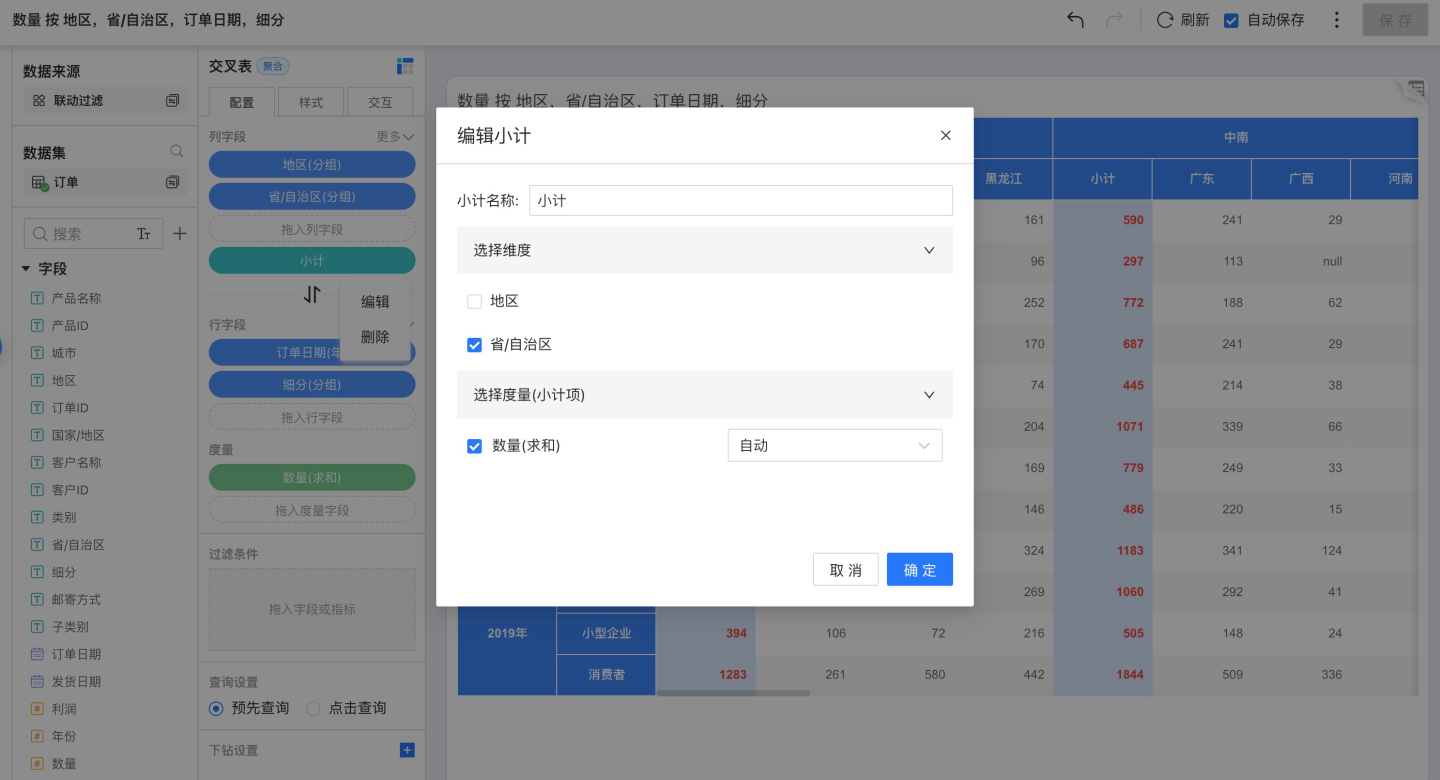
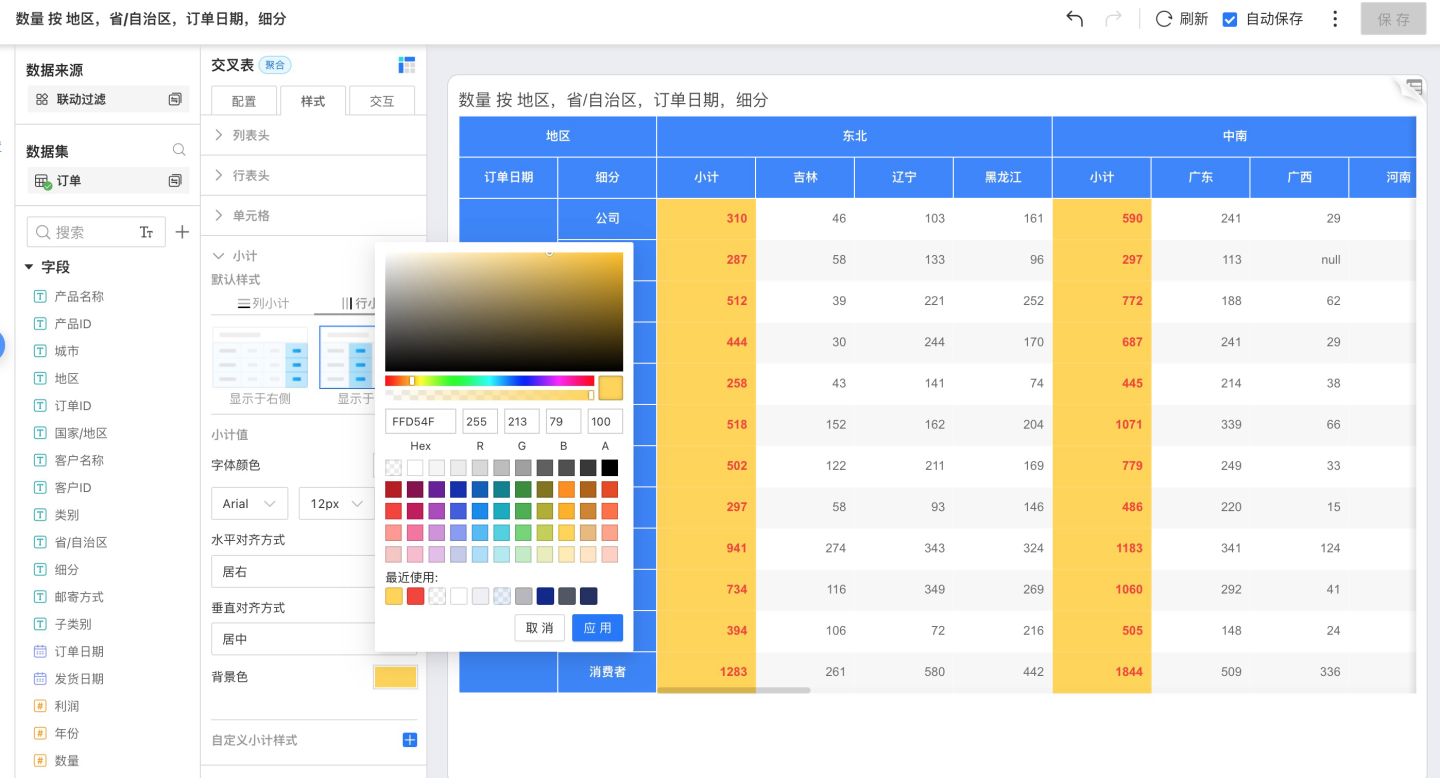
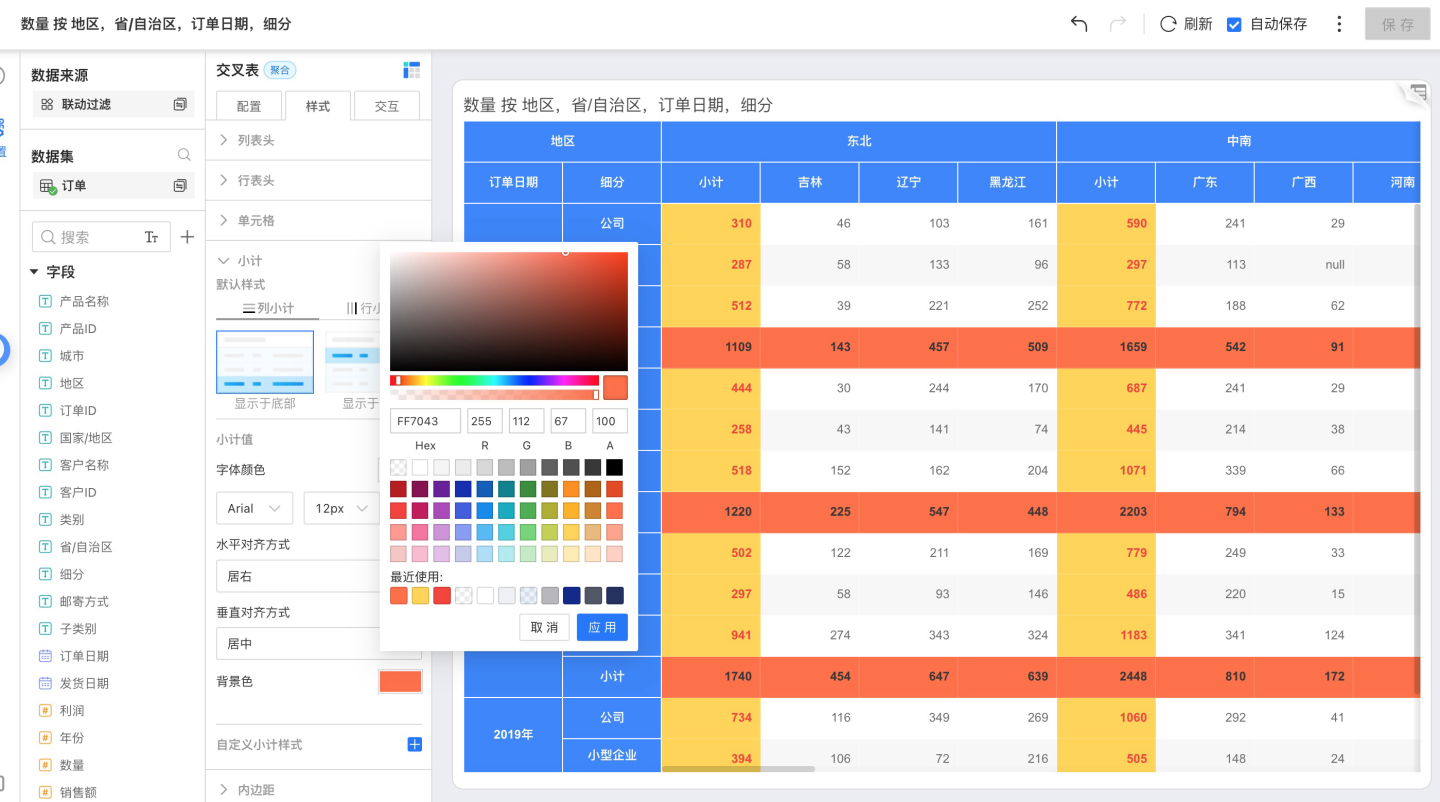
Column subtotals can be displayed on the left or right; adjust their appearance via Style → Subtotal.
Row & Column Subtotals
Click the More button to the right of a row field → Show Subtotal to open the subtotal settings panel, where you can edit the subtotal name and select the field to subtotal.
Row subtotals can be displayed at the bottom or top; adjust their appearance via Style → Subtotal.
Measures
In a cross-tabulation, measures display data within the measure area; you can show one or more measures. When multiple measures are present, the measure names are displayed; with a single measure, the name is hidden. Measure fields in a cross-tabulation support renaming, format customization, and various aggregation calculations.
Cross-Table Related Settings
Filter
Cross-tables support adding filters within the chart; please refer to the Filter section in the chart documentation for setup instructions.
Drill-down Settings
Cross-tables support configuring drill-down layers; please refer to the Chart Drill-down instructions for setup.
Crosstab Styling
Crosstabs support rich styling options—you can configure the title, column headers, row headers, cells, subtotals, padding, and more. Refer to Styling for detailed instructions.
Cross-table Interactions
Cross-tables can be configured with various interactions, such as scrolling, pagination, and click-to-pop-up. They also support interactions with other charts—for example, linking to or jumping to other charts—please refer to the documentation for guidance on setting up these interactions.
Cross-Table Operations
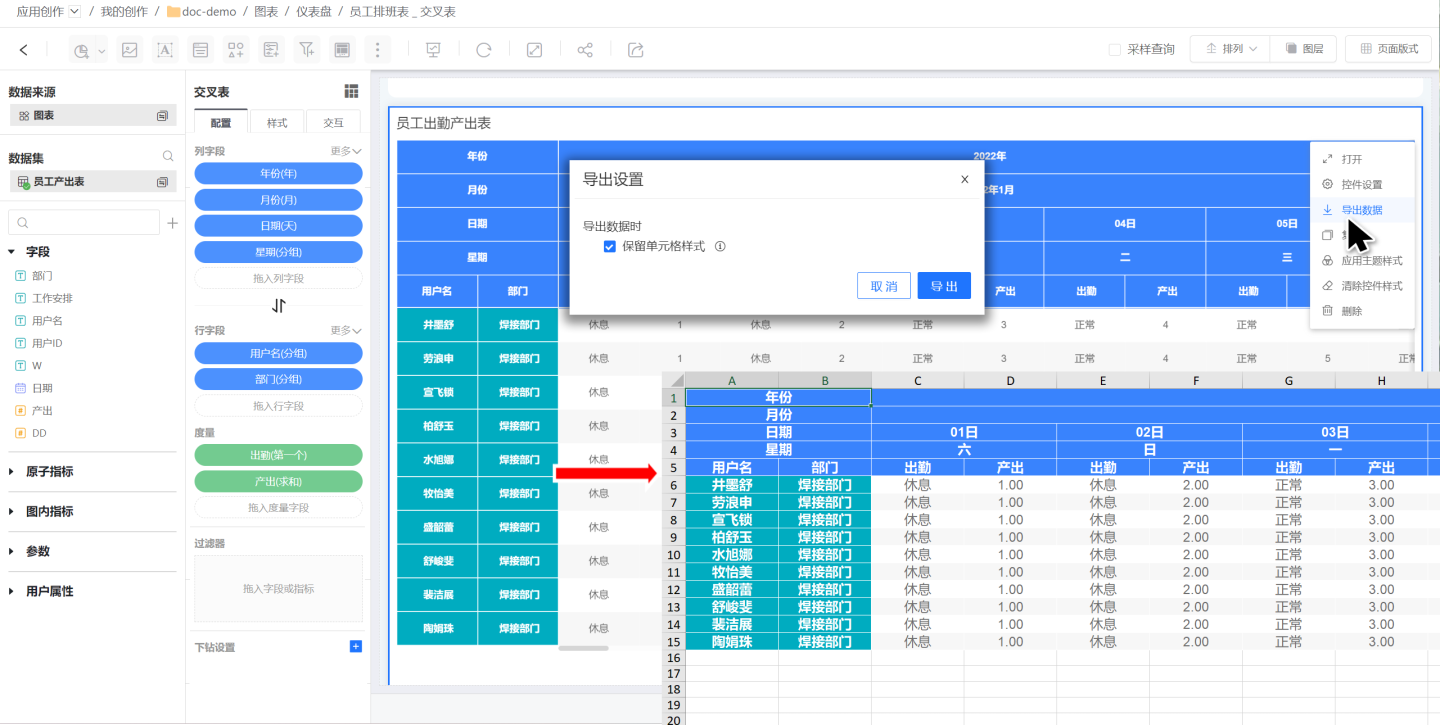
When exporting cross-table data, the data types are preserved, making it easy to perform secondary calculations on the exported data. Date-type data supports processing with date functions, and prefixes or suffixes on numeric-type data do not affect the calculation results.
During data export, you can choose whether to export cell styles, as shown in the image.
NOTE
The number of rows exported from a cross-table is not limited by the "Export Row Limit" in the security policy; it is determined by the Row Limit configured in the chart interaction.