Complex Reports
Complex Reports integrate Excel’s native editing capabilities and formula-driven configuration, support multi-source data connections, and—through visual drag-and-drop and settings—let users quickly build layout-heavy, calculation-intensive “Chinese-style” complex reports inside the Excel interface. They are also deeply fused with the platform’s existing analytics, enabling synchronized data refresh, synchronized filtering, row- and column-level permission control, and embedded scenario analysis.
Compared with ordinary tables, Complex Reports offer the following advantages:
- Multi-source data: analyze and display data from multiple sources—whether from one database or several.
- Rich styling: headers support dynamic expansion, diagonal headers, etc.; fields can be grouped and expanded by row or column to create grouped reports, detail reports, and other formats.
- Advanced calculations: row and column fields can use HENGSHI SENSE’s built-in advanced calculations or Excel formula functions.
Create a Complex Report
In a Dashboard, click New Chart → Complex Report, choose the data source and Dataset, then click OK to create a new blank complex report. 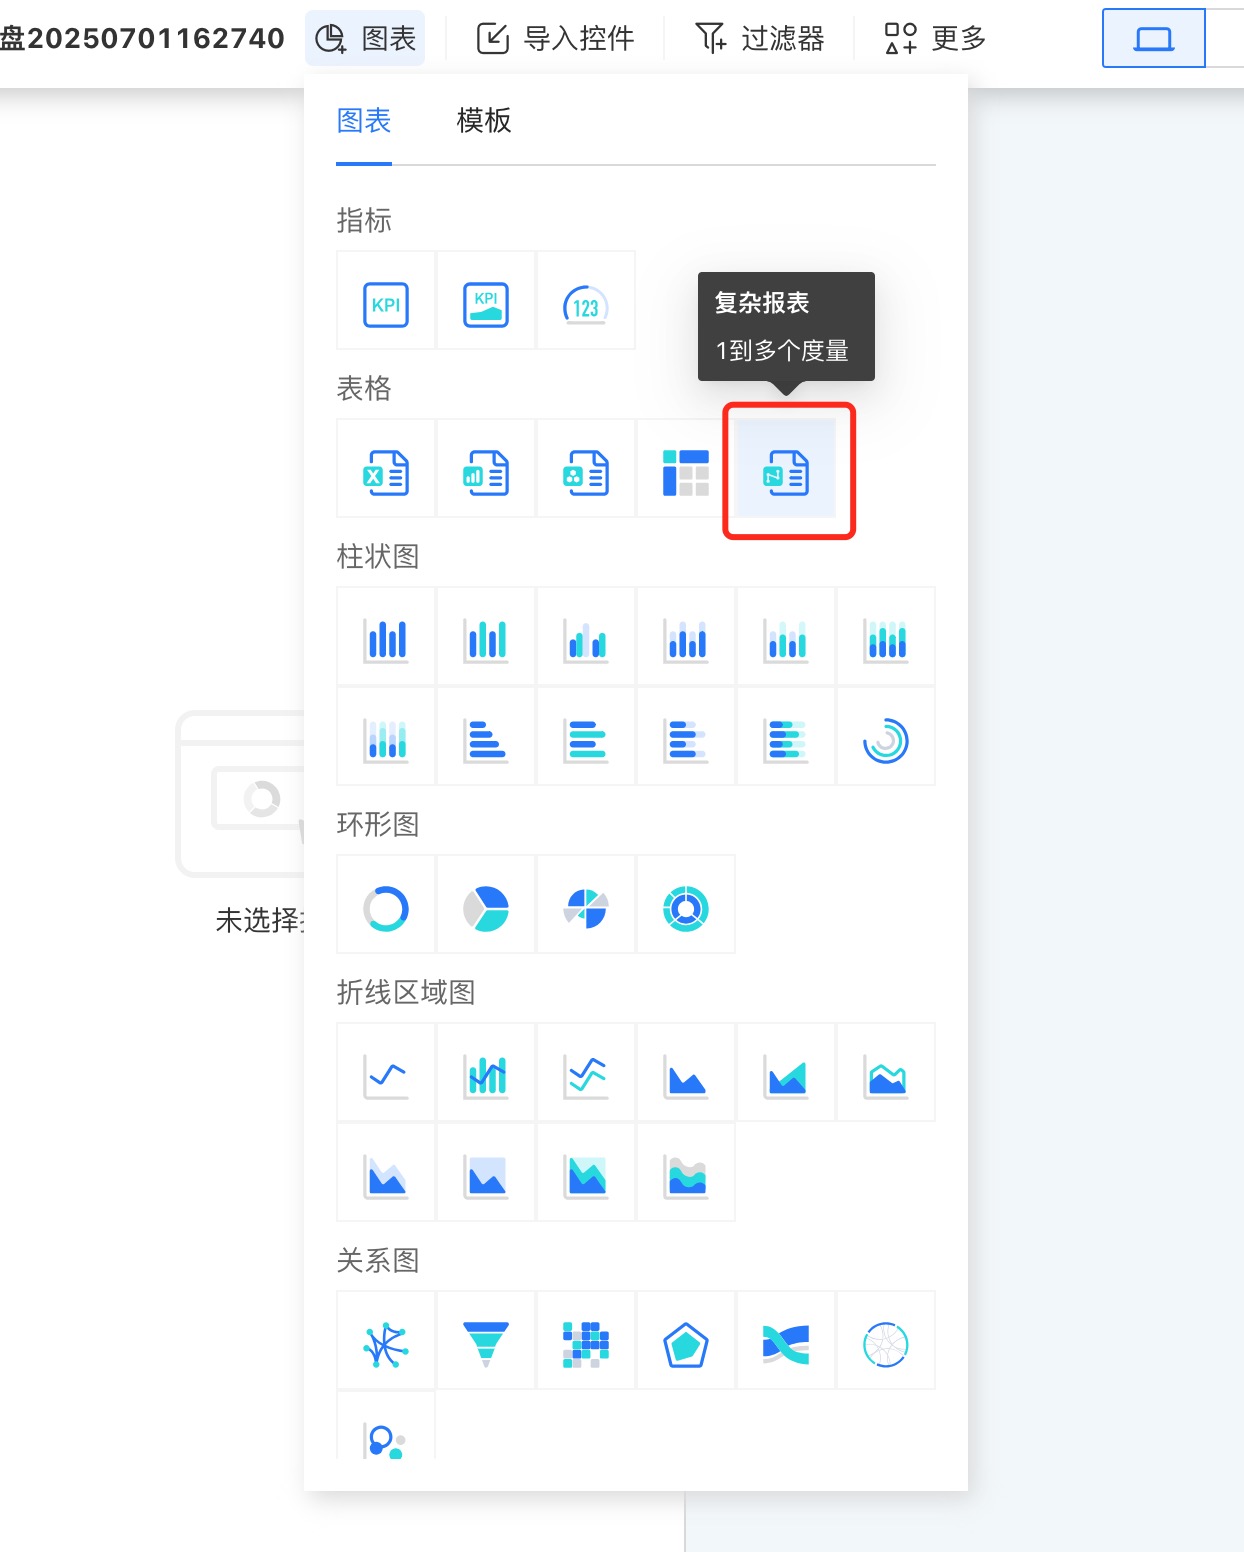
The newly created complex report contains no data. Unlike other charts, a complex report must be opened before it can be edited. Click the three-dot menu in the upper-right corner, open the complex report, and enter the editing page. 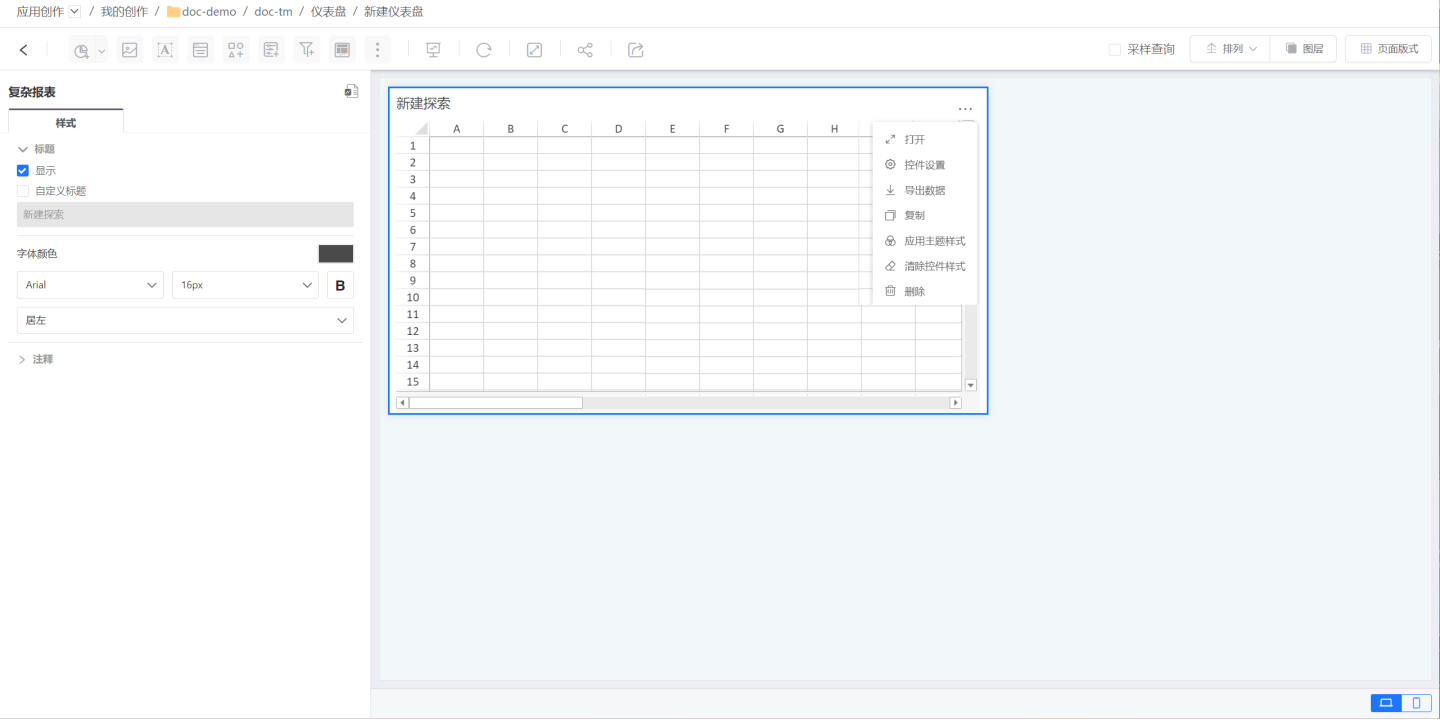
Editing Complex Reports
The complex report editing page is divided into three parts: the leftmost area (red frame) is the data zone, displaying the data used by the complex report; the middle area (blue frame) is the configuration zone, mainly for configuring report-related data and how the data is displayed; the right side is the cell area, where you can set cell properties and cell styles, etc. After editing the complex report, click the preview button in the upper-right corner to view the report display style. 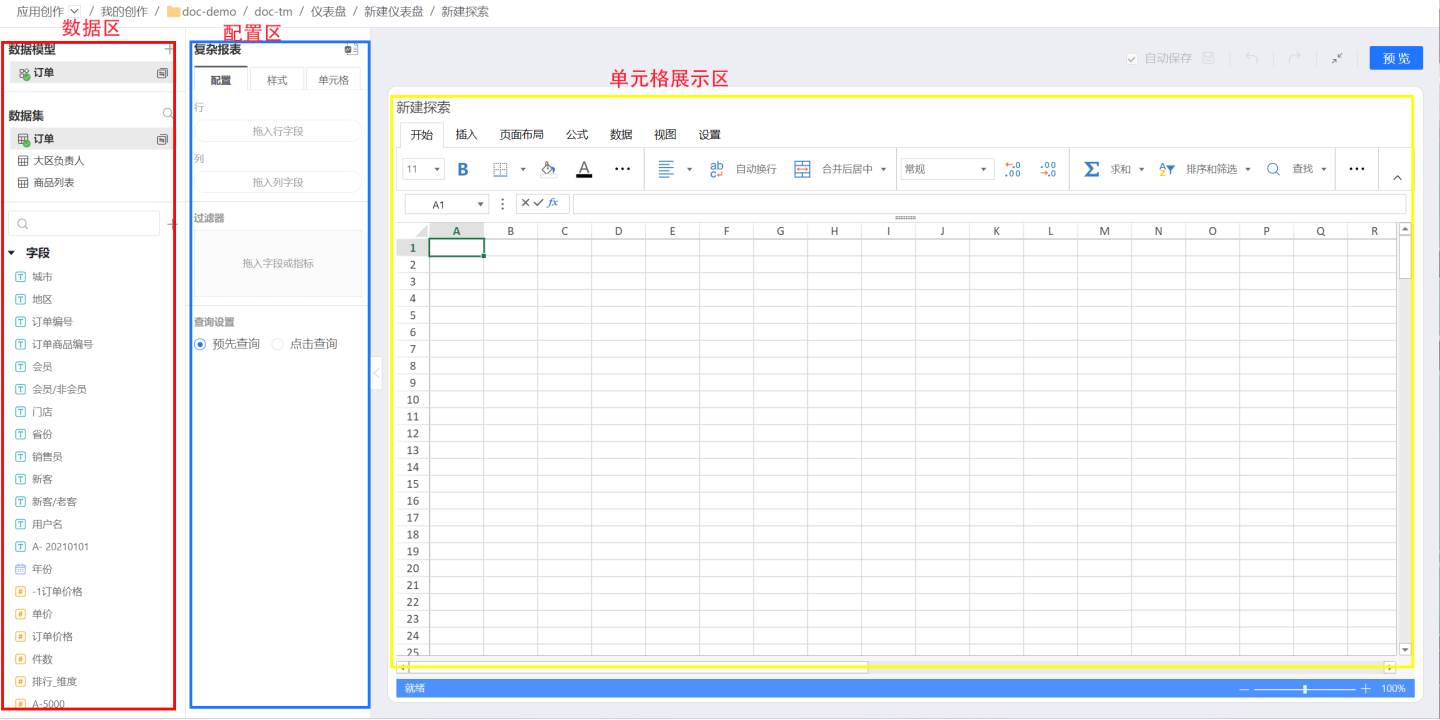
Row & Column Data Display
Displaying data in cells is done in two steps: first, select the cell in the table where the data will appear (e.g., click a specific cell), then drag the desired field into the row or column display area.
In the example, cell A3 is selected first; next, the City field is dragged to become a row field, so the values appear along rows.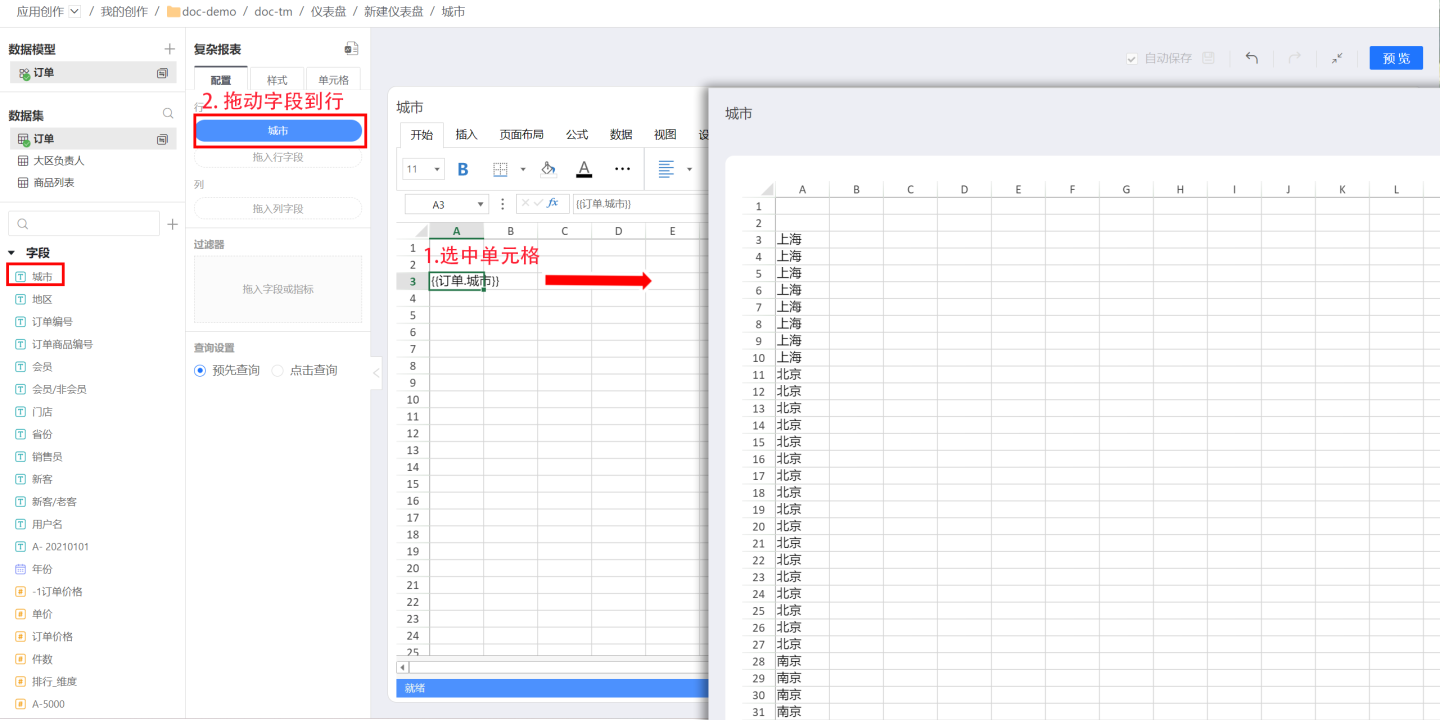
When City is dragged to become a column field, the values appear along columns.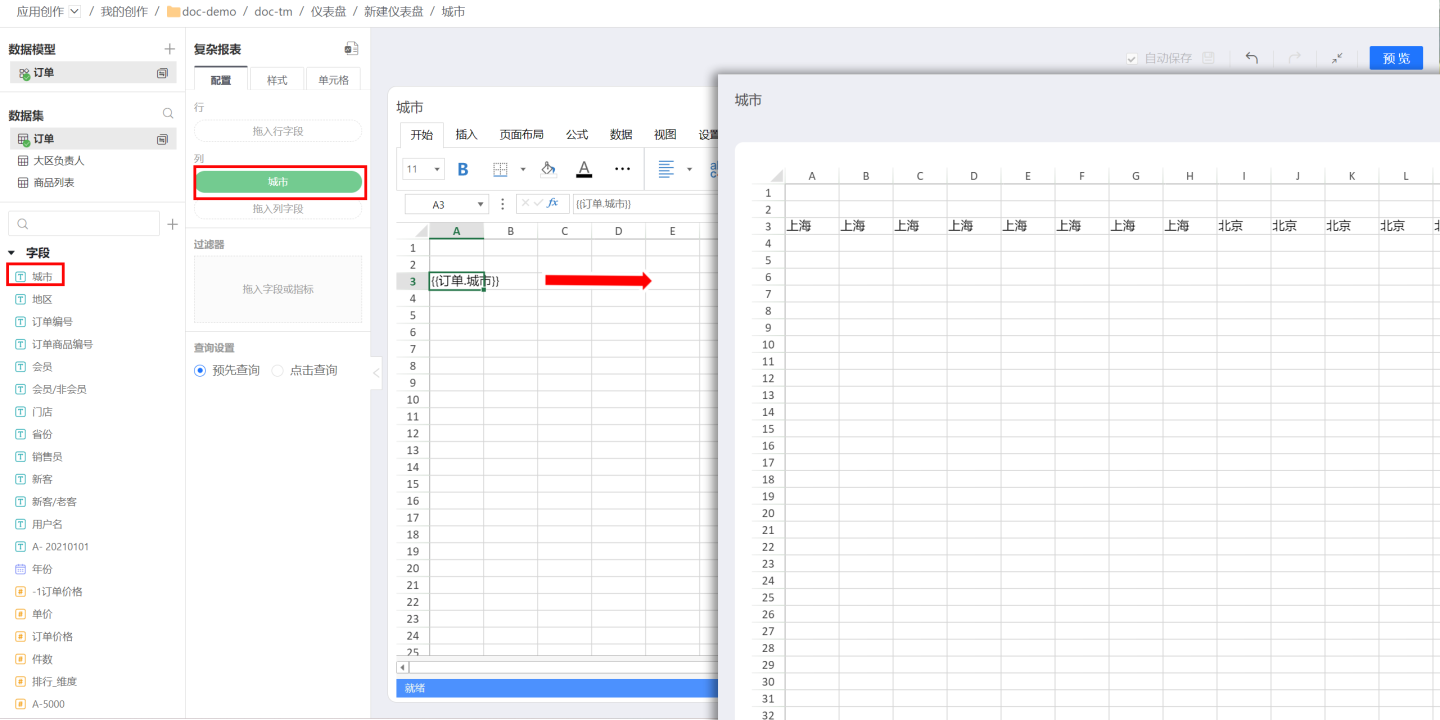
Detail Data
Dragging a field directly into a row or column shows the raw, detailed records from the Dataset. To show aggregated information instead, apply grouping to the field.Aggregated Data
After placing a field in a row or column, choose “Group” in the calculation menu to aggregate the data. For example, grouping byCityproduces the result below.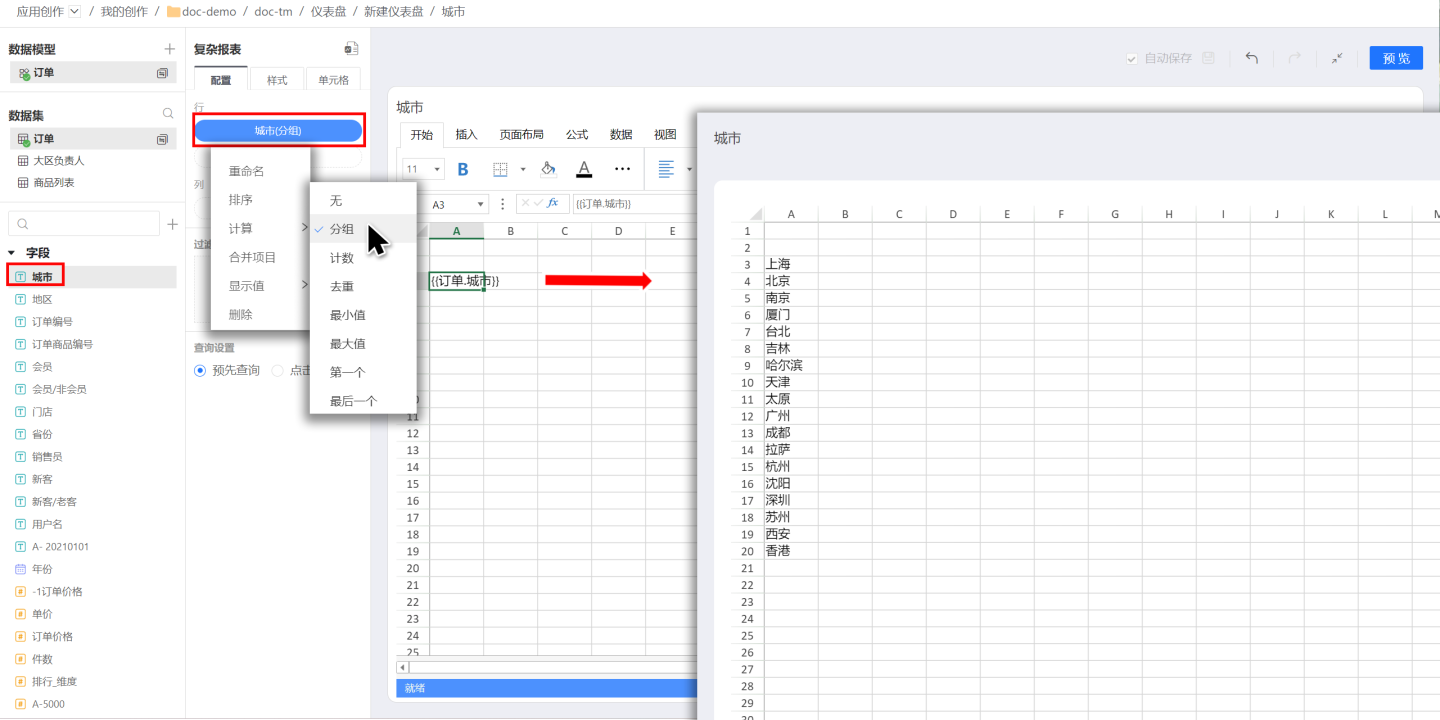
Tips
- Cutting and pasting a configured cell within the cell area carries over its data configuration and all dependencies. For instance, cutting cell A3 and pasting it into A8 moves the configuration so the data now appears in A8.
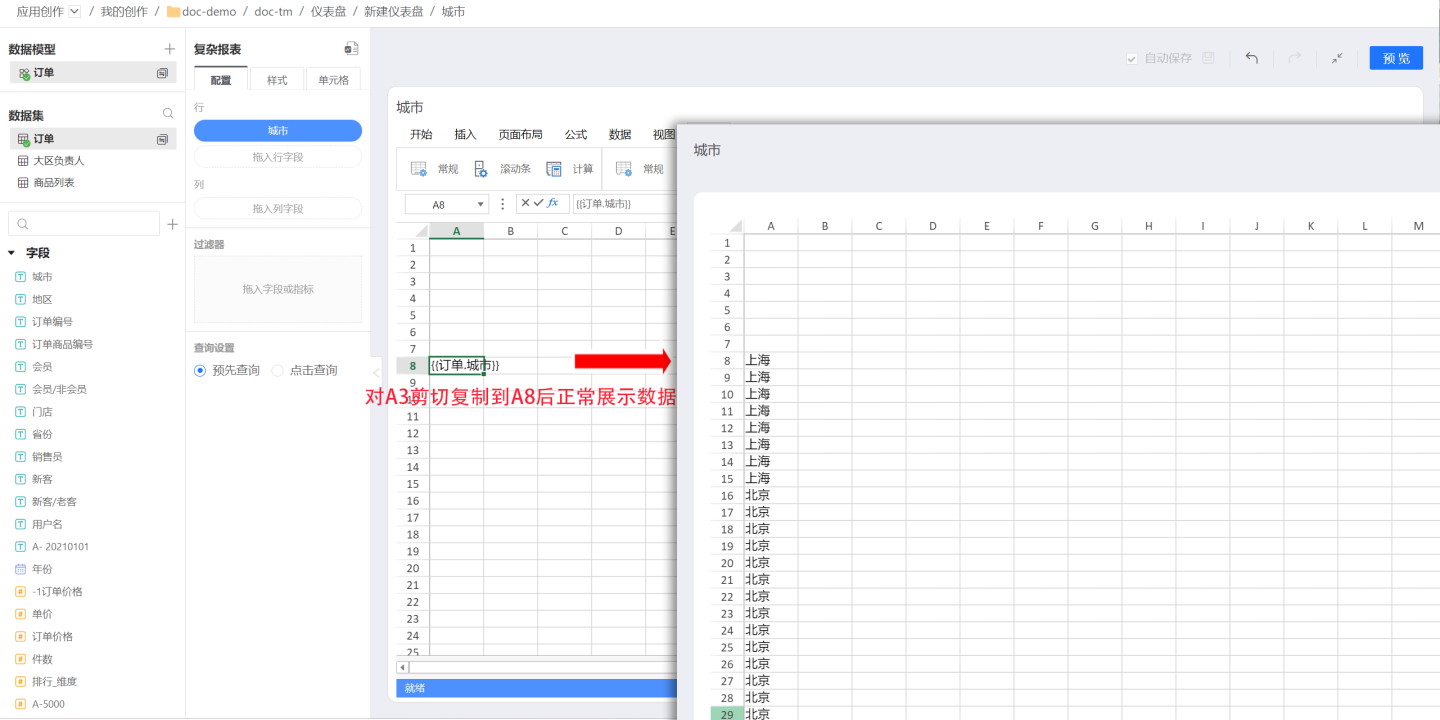
- Each field has a one-to-one mapping with its bound cell, letting you locate either instantly: clicking the field highlights its cell, and clicking the cell highlights its field.
Group By
Field Grouping Basis
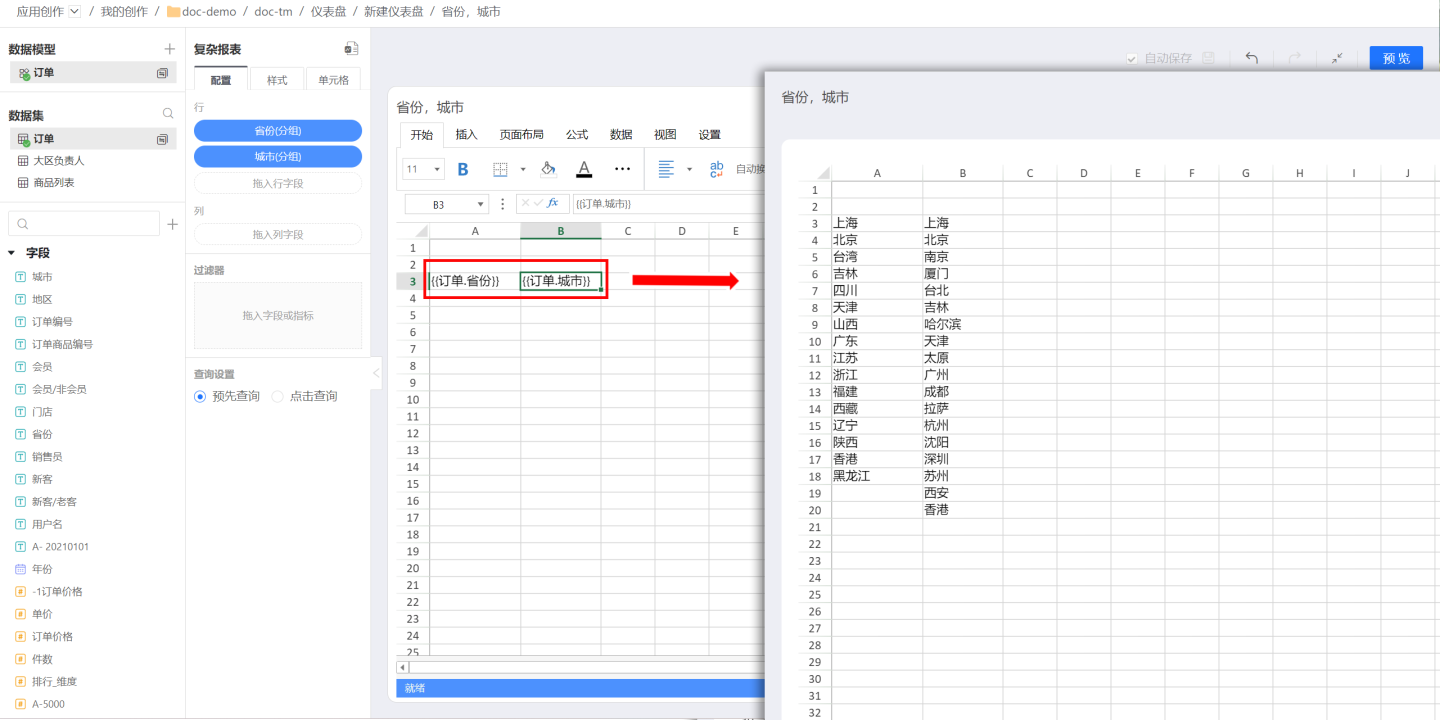
When a field is dragged into a Complex Report for row/column display, it is not automatically associated with other fields. Multiple fields from the same Dataset or data model are shown independently, without inheriting the relationships defined in the Dataset. As shown in the image, dragging in “Province” and “City” displays them without any linkage; cities appear randomly. In reality, cities belong to provinces—Hangzhou to Zhejiang, Guangzhou to Guangdong—so the display should reflect this correspondence.
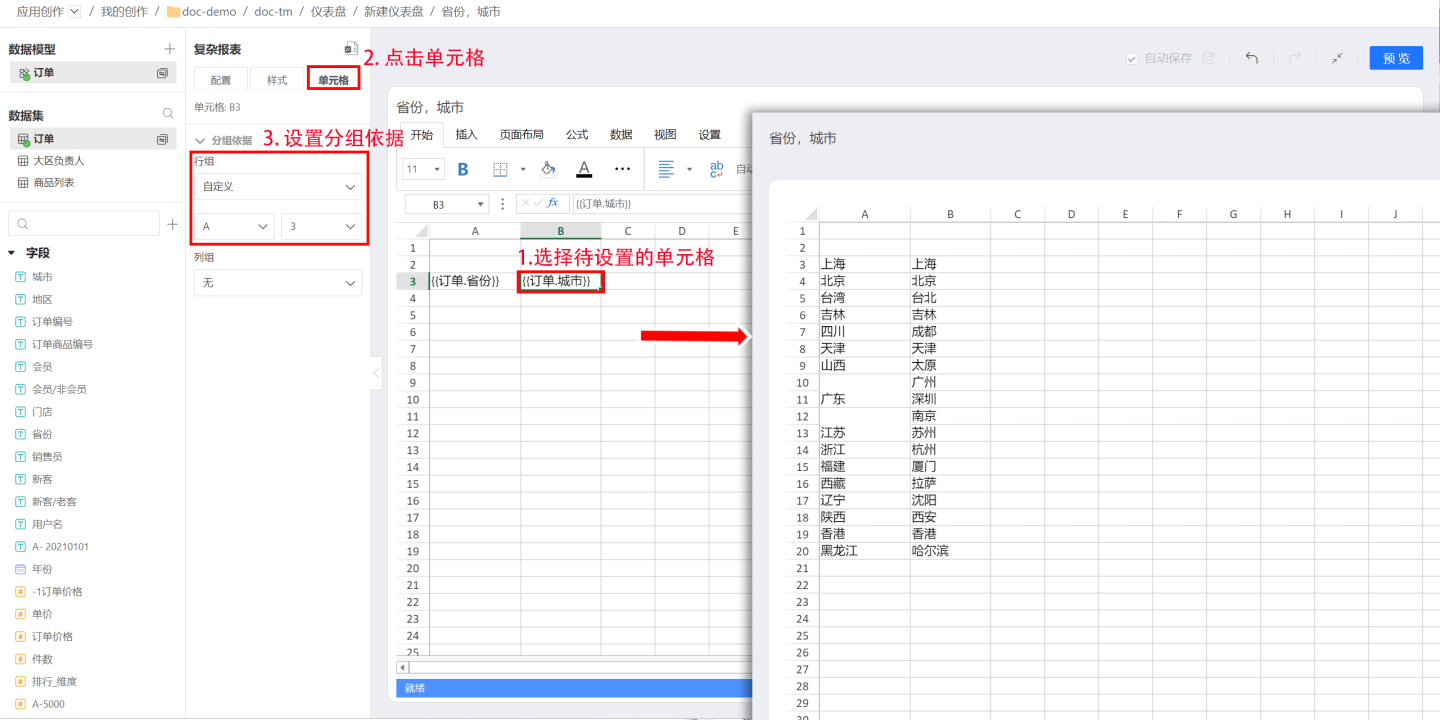
In a Complex Report, use “Group By” to establish a relationship between two fields. First select the target cell, then in the left-side Cell settings panel choose the field that this cell should be grouped by. After the setting is applied, the cell’s field will be displayed according to the grouping field. For example, to show cities under their respective provinces, click the cell containing the City field, open the Cell panel on the left, and in “Group By” select Row Group A3 (the cell that holds the Province field). The data will then list cities grouped under each province.
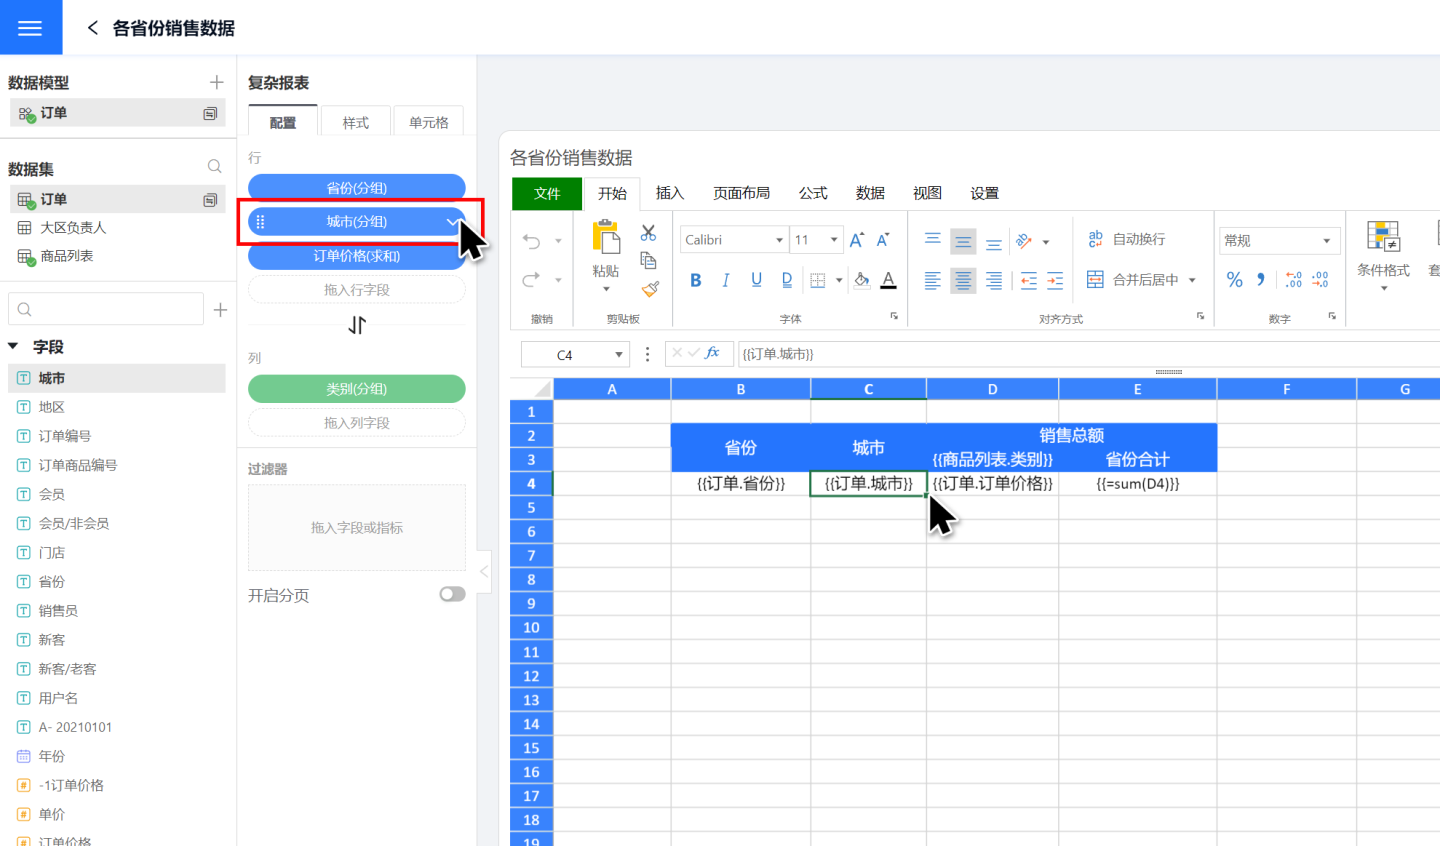
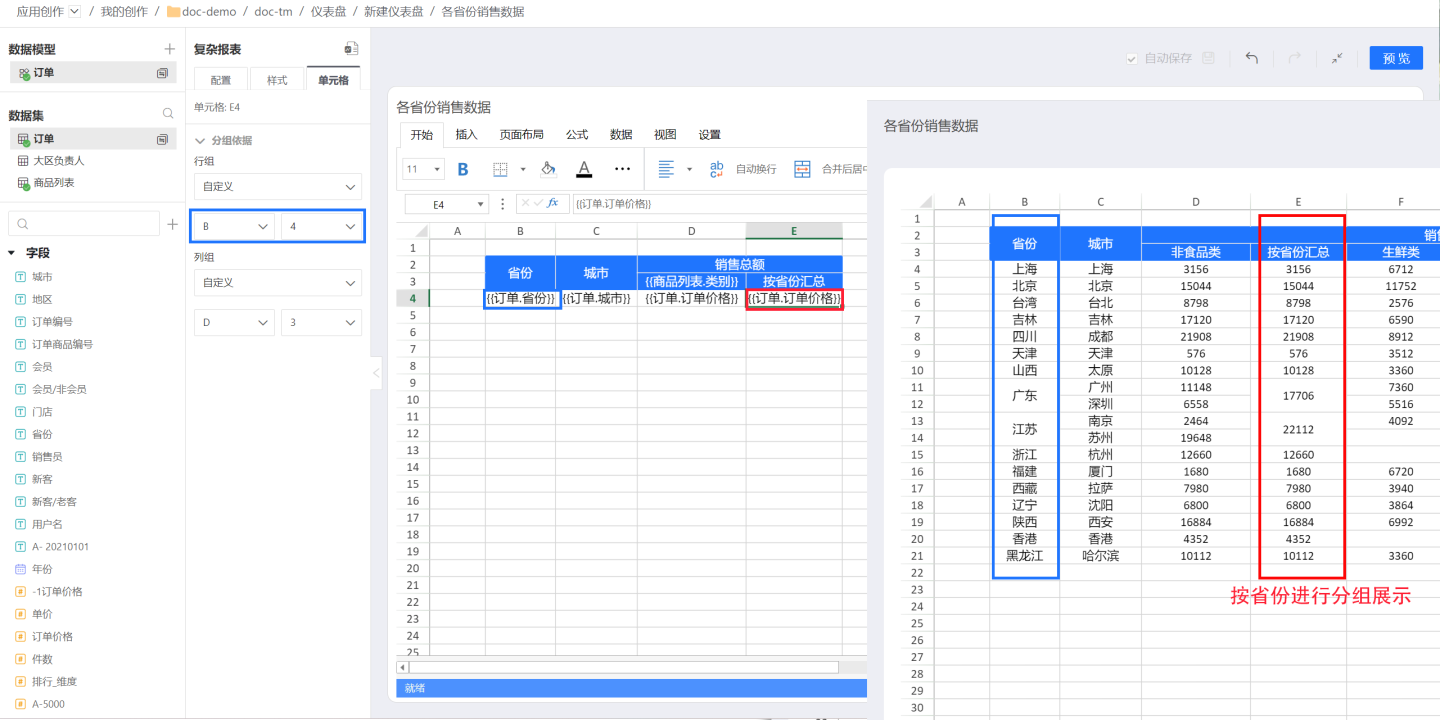
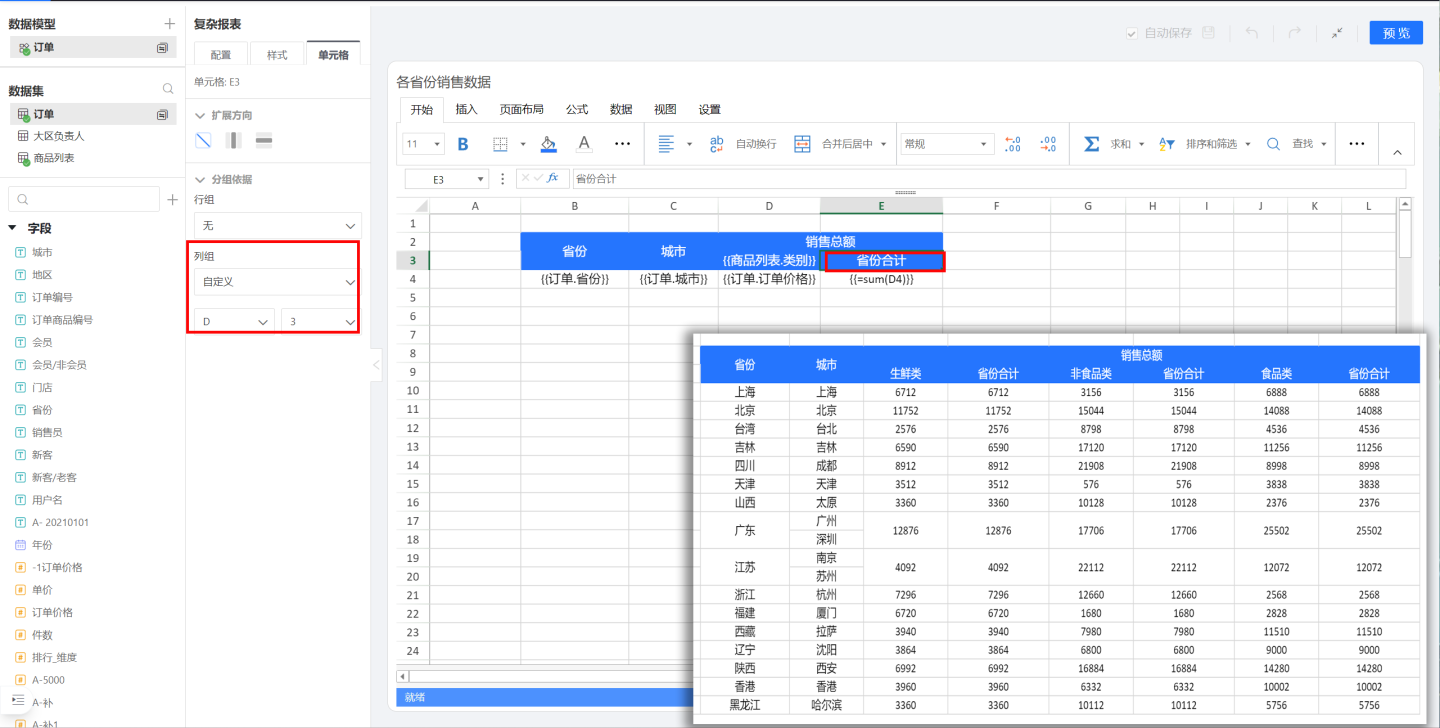
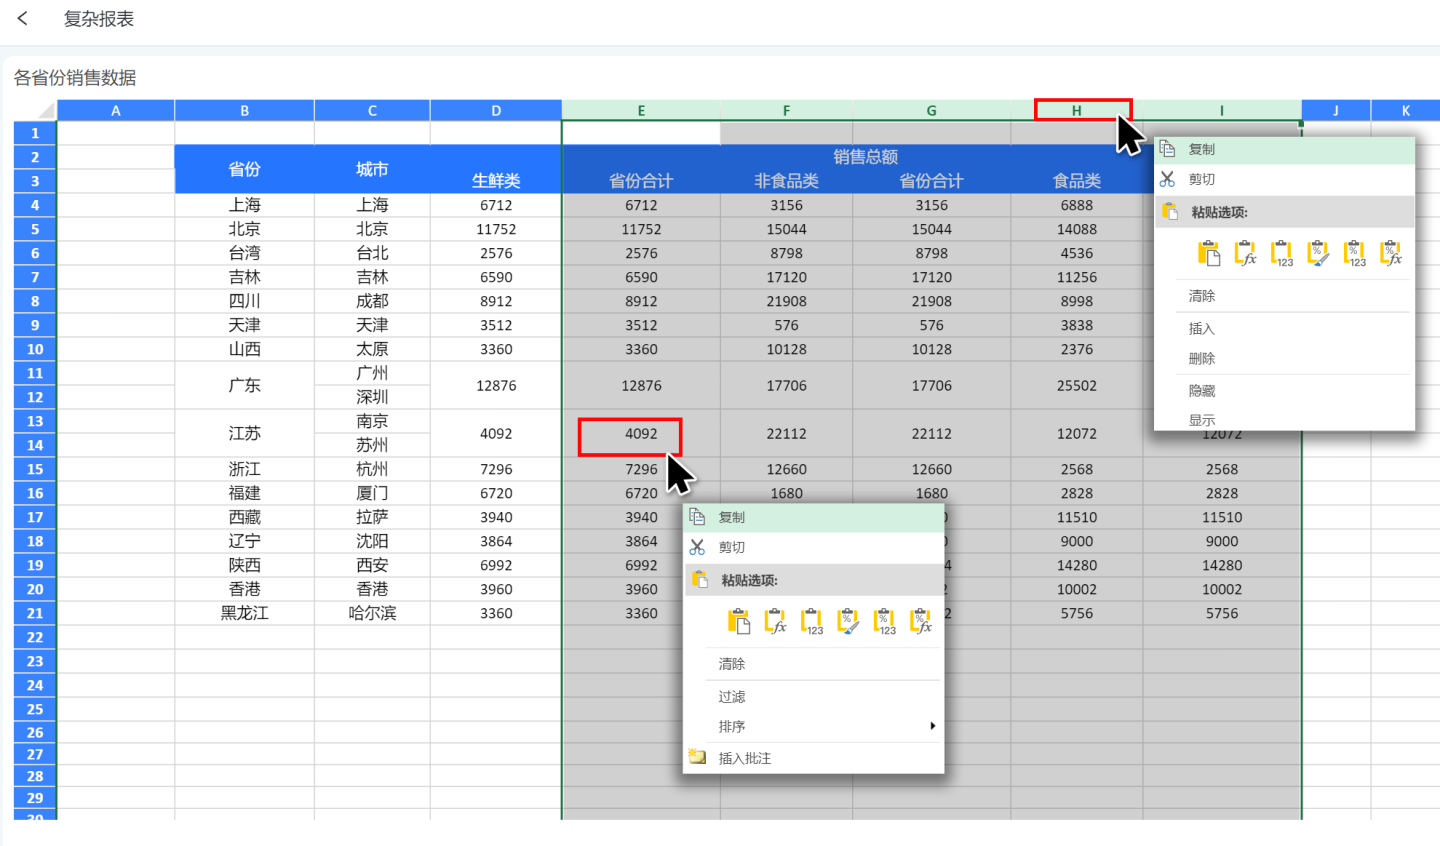
The example above groups by row, but Complex Reports also support grouping by column. Some advanced cases require both row and column grouping. Consider a sales report for a supermarket chain: sales amounts are broken down by product category. The order amount (sales, yellow box) is grouped in the row direction by C4 (blue box)—i.e., by city—and in the column direction by D3 (red box)—i.e., by product category. The final result is shown in the yellow box on the right. 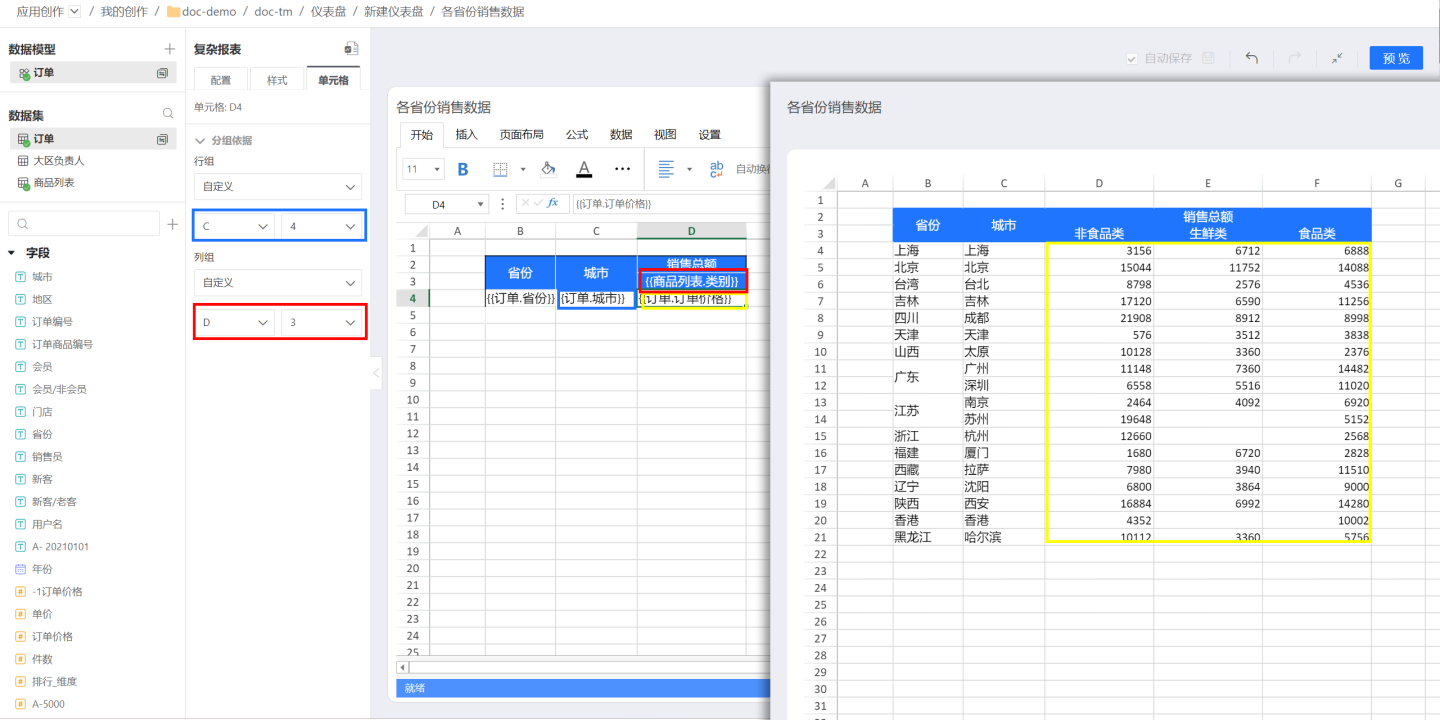
- When fields are dropped on the same axis, the cell grouping condition can be initialized. The default rule is: “Within the same axis (row fields or column fields), locate the nearest field above the current field that is set to ‘Group’ and use it as the default dependency.”
- Time-type fields receive special support. When a time field is calculated as
Group, Millisecond, Second, Minute, Hour, Day, Day (cross-week), Day (cross-month), Week, Month, Month (cross-year), Quarter, Quarter (cross-year), Year, it also follows the default rule. - Reordering fields within an axis does not trigger an automatic update of the grouping condition.
Tips
- The grouping basis does not have to be an adjacent cell; any cell within the current Complex Table can serve as the grouping basis.
- Complex Reports allow selecting cells to the left or above the current cell as the grouping basis. For example, cell E4 can only use A(1-4), B(1-4), C(1-4), D(1-4), or E(1-3) as its grouping basis; cells beyond column F, rows below 5, or the cell itself are not allowed.
Text Grouping Basis
In some cases, text content in complex tables also needs a grouping-basis setting so it can be associated with other fields and expand along with them.
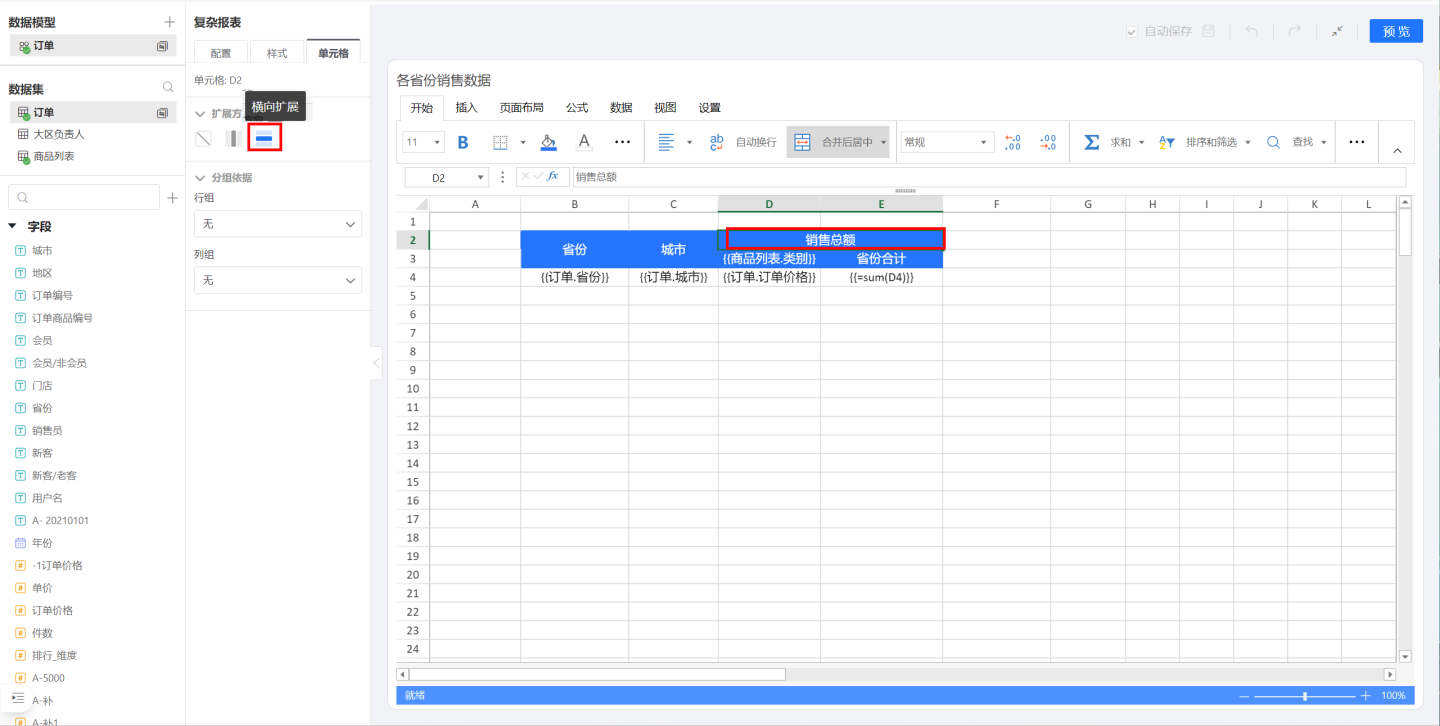
As shown in the figure, in the sales data by province the text items “Total Sales” and “Province Subtotal” are static text, whereas the header D3 {{ProductList.Category}} is a field that expands according to its values. Consequently, both “Total Sales” and “Province Subtotal” change as {{ProductList.Category}} expands.
First, look at “Total Sales”: because it stretches horizontally as {{ProductList.Category}} expands, set its expansion direction to Horizontal.
Next, consider “Province Subtotal”: this subtotal expands together with {{ProductList.Category}}—for example, there is a subtotal for “Fresh” and another for “Food.” Therefore, “Province Subtotal” must be grouped by {{ProductList.Category}}.
The dynamically expanding field {{ProductList.Category}} should display within the range of the “Total Sales” cell, so its grouping basis is set to D2, establishing the link with “Total Sales.”
Data Calculation
Fields in complex reports inherit HENGSHI SENSE’s native calculation capabilities and support all Advanced Calculations, while also allowing you to compute with Excel formula functions.
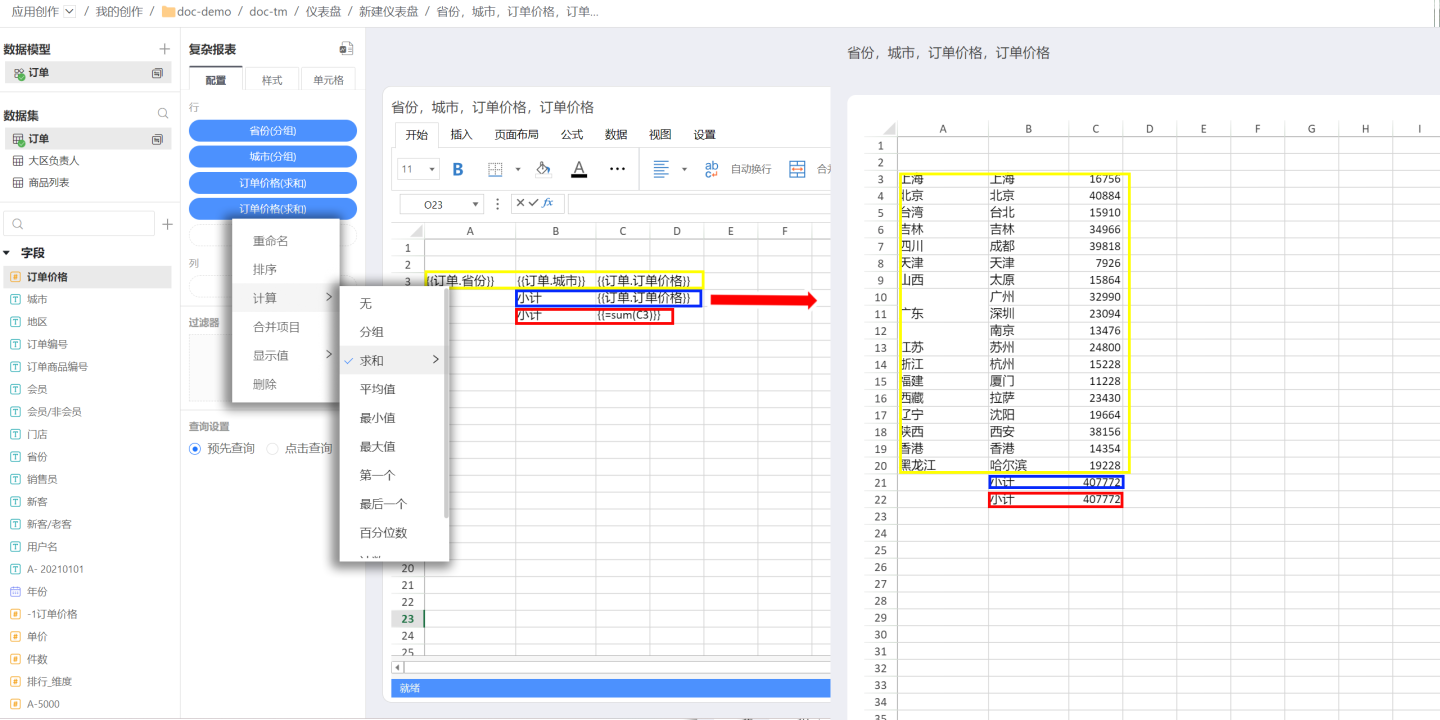
In the figure below, the complex report displays sales data for each city (yellow area). To calculate the total sales for each city, you can either use HENGSHI SENSE’s built-in calculation (blue area) or Excel’s SUM function (red area).
Tip
- When using Excel functions, if you are calculating against a field configured in a cell, the formula must be wrapped in
{{}}; the function will then apply to all data expanded from that cell field. If you are calculating only a single cell value,{{}}is not required. - Complex report fields support the following standard Excel functions: SUM, COUNT, AVERAGE, MAX, MIN, PRODUCT, STDEV, STDEVP, VAR and VARP. Other functions are not supported at this time.
Multi-Source Complex Reports
Unlike other charts, Complex Reports support simultaneous display and analysis of multiple data sources, which can come from the same database or from several different databases.
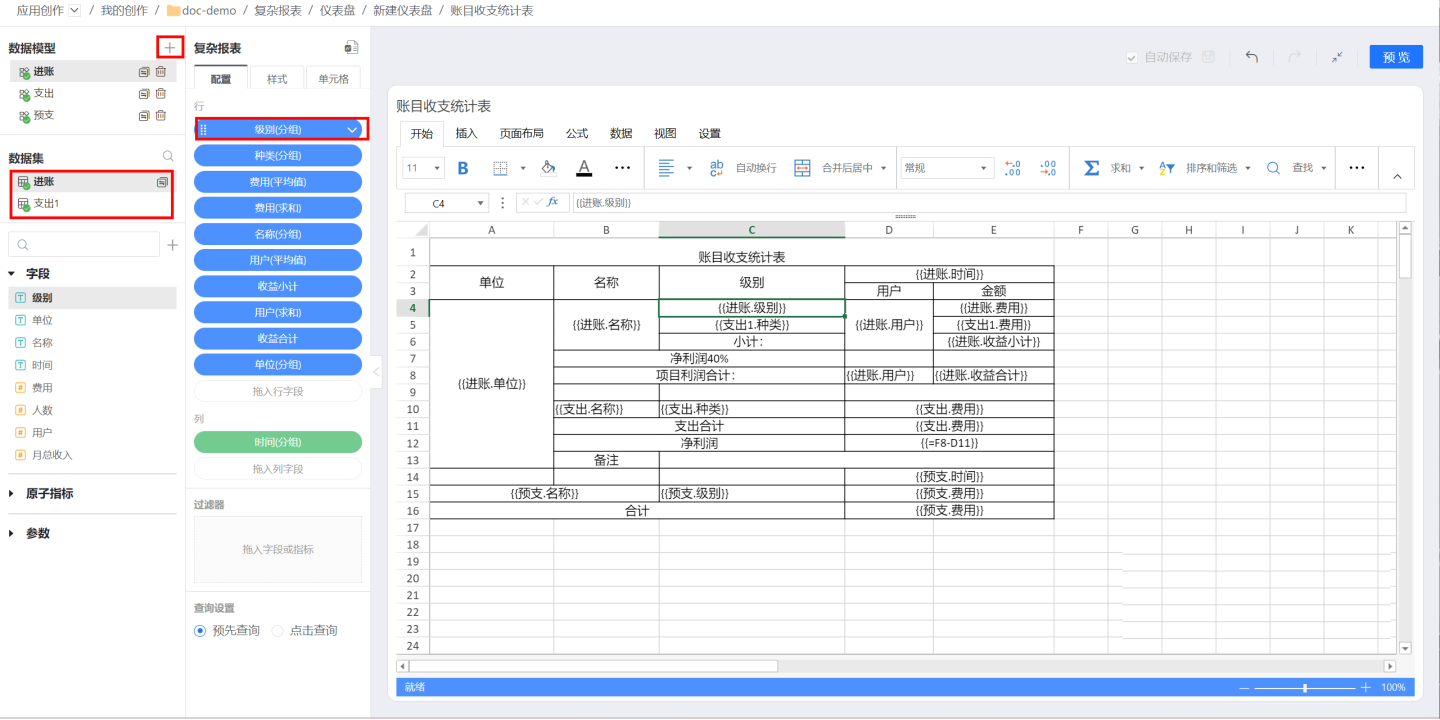
As shown in the image, click the + icon to the right of the data model to add new data. The configuration table on the left only displays field settings related to the currently selected data model. For example, if the Income model is selected, the fields used in the Income model are shown. To configure or view the fields used in the Expense model, click the Expense model to switch to it and then select the desired fields.
Header Display
From the perspective of change, headers in complex reports can be divided into static headers and dynamic headers. A static header does not contain field information from the configured data and remains unchanged once set. A dynamic header contains data field information and changes as the fields expand. Examples of both types of headers are provided below.
Static Header
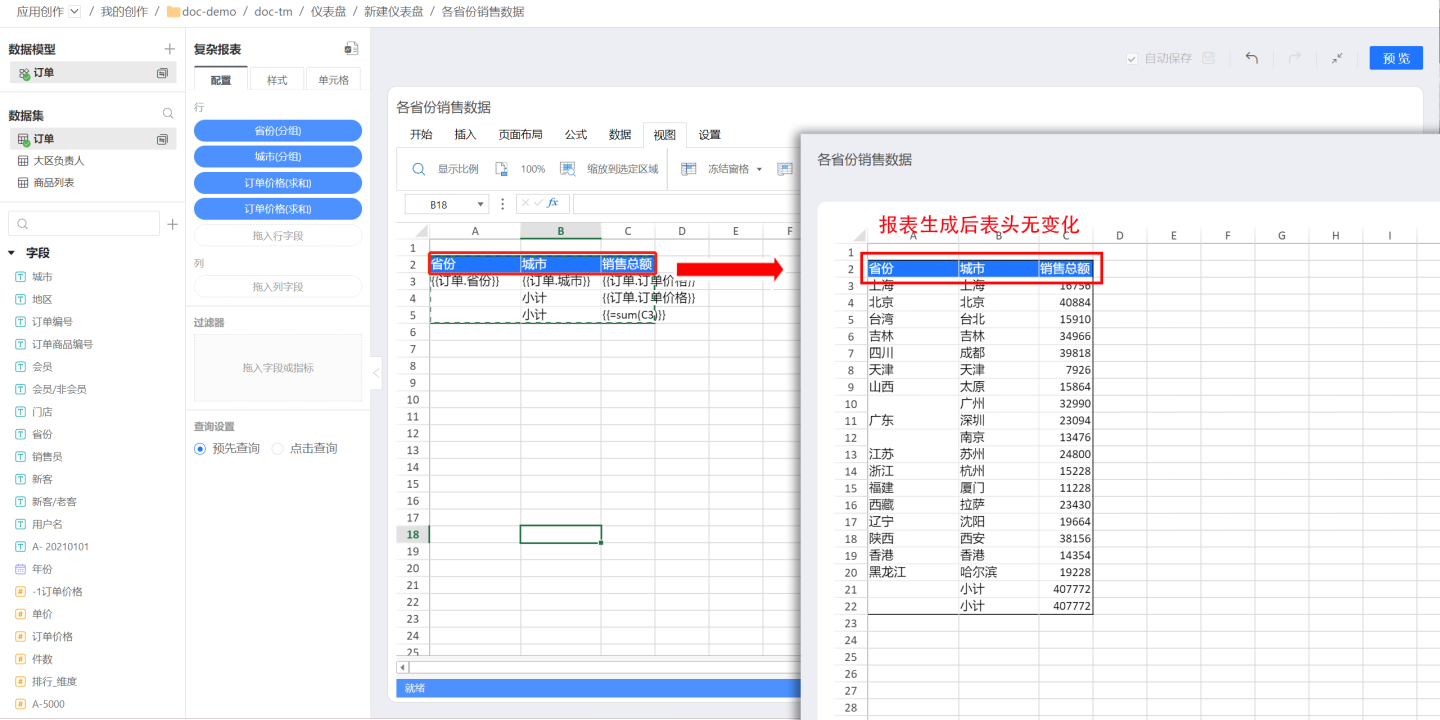
A static header is made up of plain text only; it contains no field information and does not expand dynamically. The number of header cells is fixed. For example, when editing the sales-by-city report shown below, the header is composed of three columns—Province/City, City, and Total Sales—and the final report also contains only these three columns.
Dynamic Headers
A dynamic header is one that contains field information and changes as the field expands. For example, when a city-level sales report needs to display sales data for every product category, you drag the “Product Category” field into the header cell. At runtime this field expands dynamically according to the actual categories, and the parent title “Total Sales” stretches in sync—this is a dynamic header. 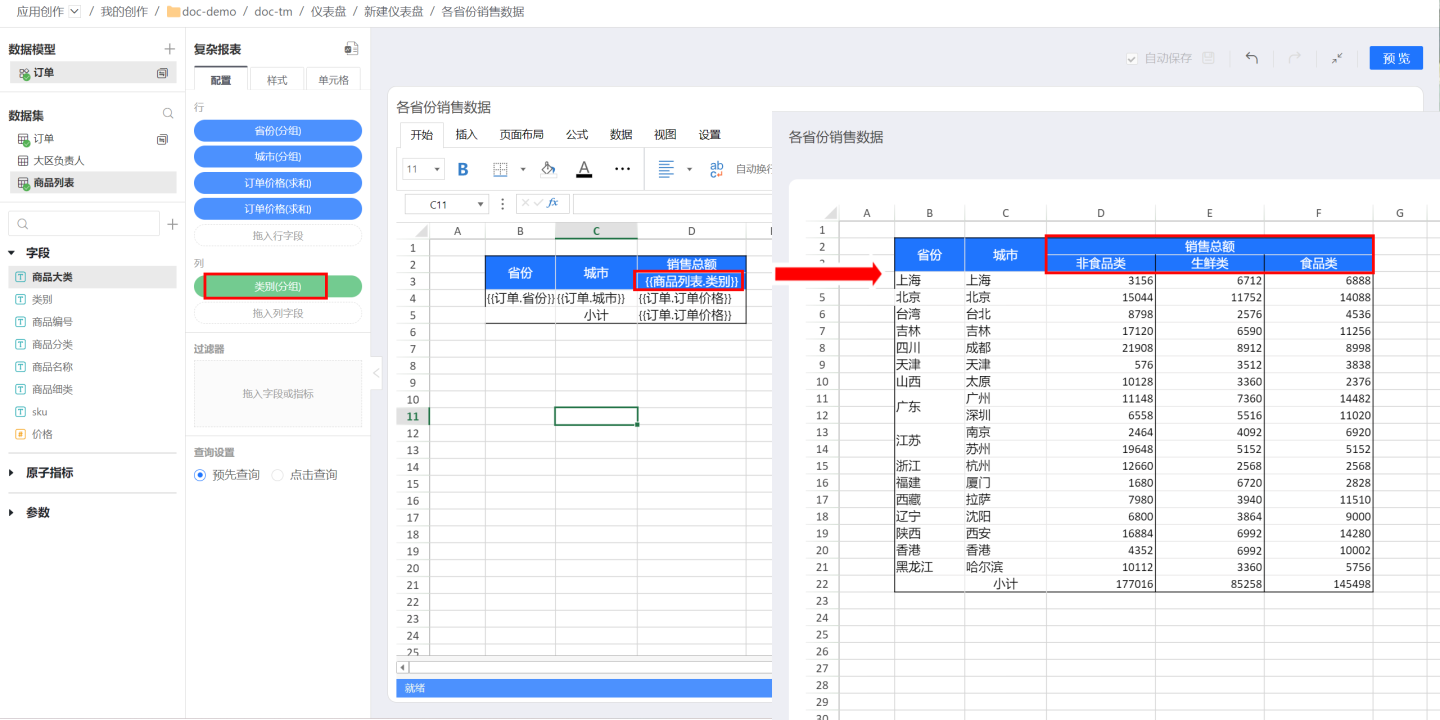
When using dynamic headers, pay attention to the field’s grouping anchor. If the field sits at the topmost level, it expands without restriction from other cells. If there is text above it—as in the example—the dynamically expanding field {{ProductList.Category}} must stay within the range of the “Total Sales” cell. Therefore, set the grouping anchor of {{ProductList.Category}} to D2 to link it to “Total Sales”.
Complex Report Interactions
Image Settings
Complex reports support image recognition and display for data. Follow the steps below to configure images.
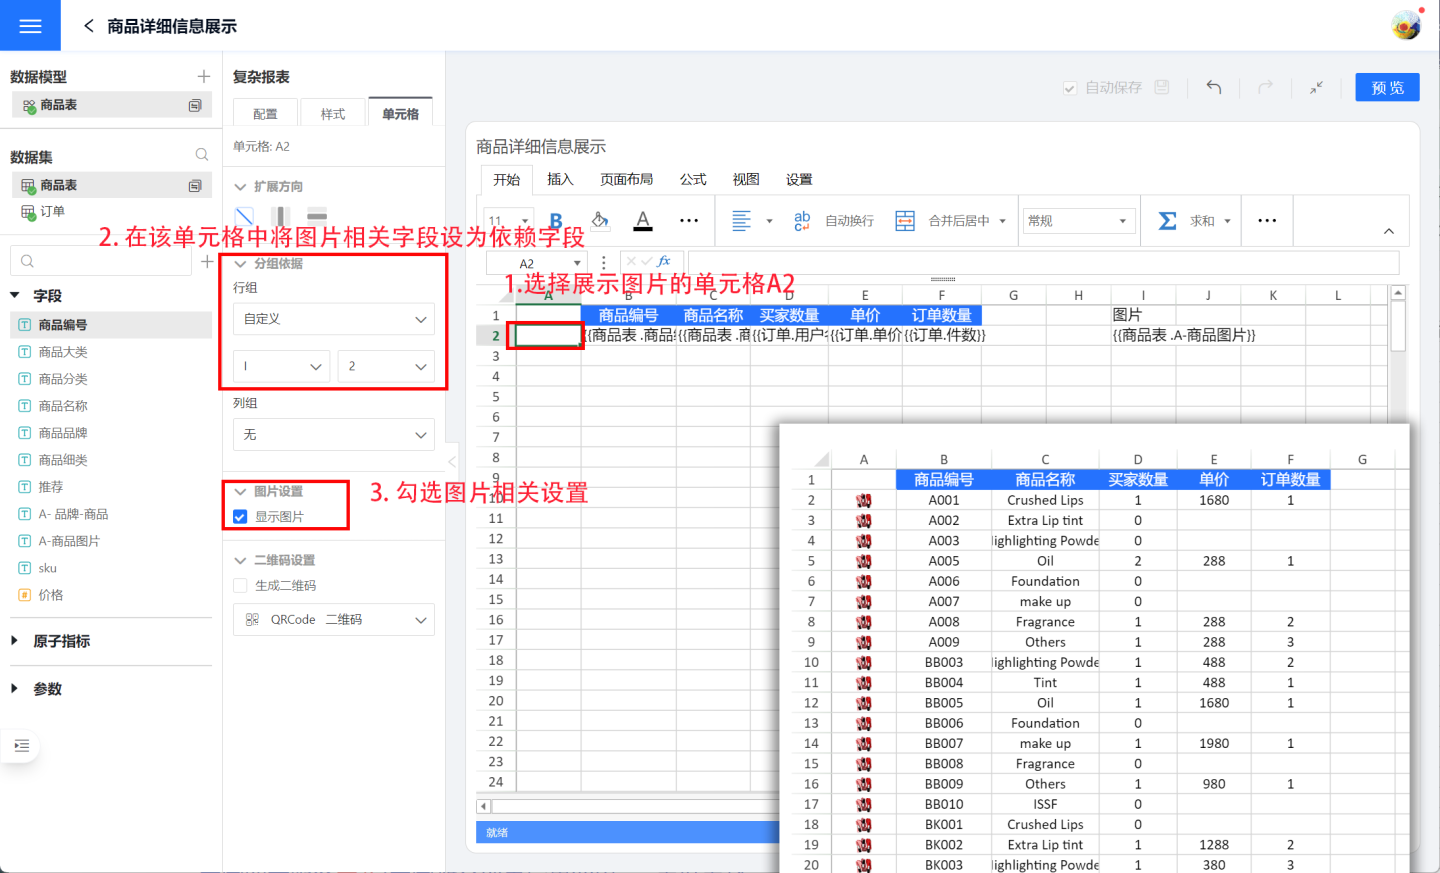
- Designate the cell for image display. In the example, cell A2 is selected to show the image.
- Drag the image-information field from the Dataset into the sheet and set it as the basis field in the image-display cell. In the example, the image-related field is dragged into cell I2 (this column will ultimately be hidden and not shown in the Chart), and in cell A2 the Group By is set to I2.
- In Image Settings, check “Display Image”.
- Image configuration is complete; click Preview to view the result.
QR Code Settings
Complex reports can render their contents as QR codes or barcodes. Currently supported types are QRCode, PDF417, GS1_128, EAN8, EAN13, Code93, and Codabar. The following steps use QRCode as an example to illustrate how to configure the feature.
Setting up a QR code takes three steps:
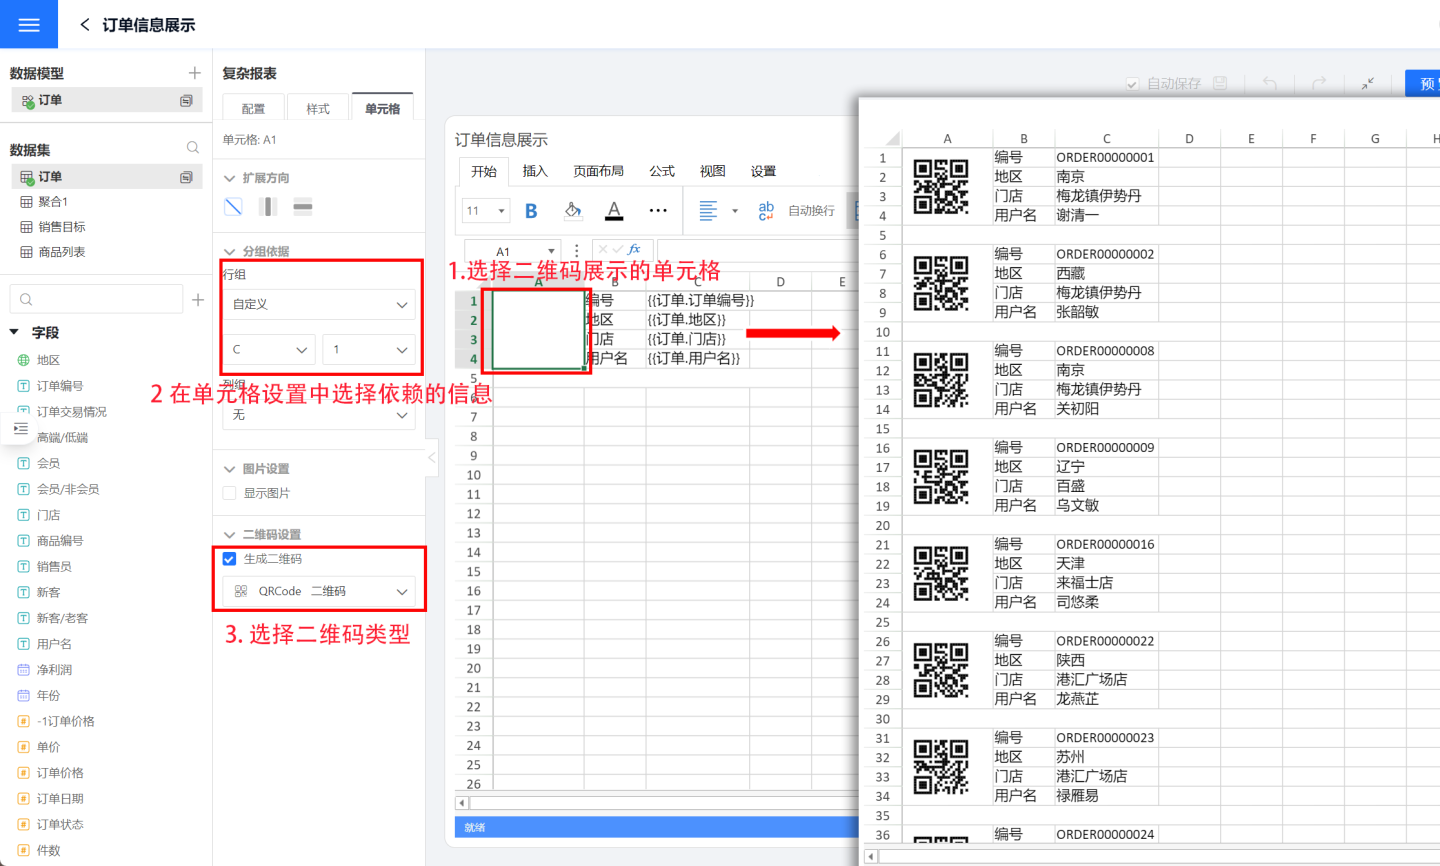
- Select the cell where the QR code will be displayed. In the example, cell A1 is chosen.
- Drag in the field to be rendered as a QR code and set the display cell’s grouping criterion to that field. In the example, order number in cell C1 is to be shown as a QR code, so the grouping criterion of cell A1 is set to C1.
- Choose the QR code type. In the example, QRCode is selected.
- After the QR code is configured, click Preview to check the result.
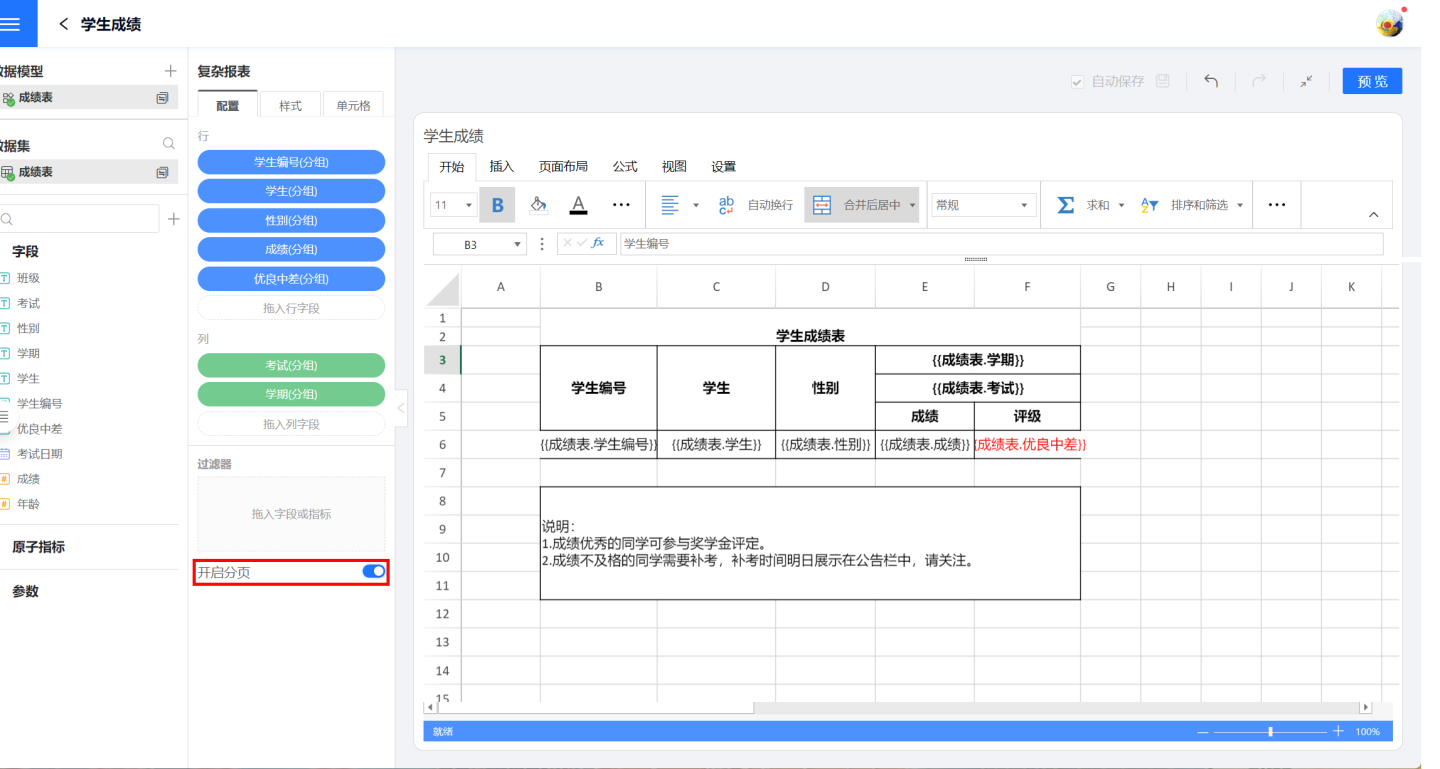
Pagination
When a complex report contains a large amount of data, you can enable pagination to display the content in fixed page sizes. Any content exceeding the page size will appear on the next page, and users can navigate through pages using the pager. To use pagination, turn on the pagination toggle.
To ensure the data is presented attractively, smoothly, and completely while paginating, the following settings are supported:
- Display merged cells across pages
- Repeat specified cells on every page
- Display specified cells together
- Prevent page breaks within groups
Merged Cells Spanning Pages
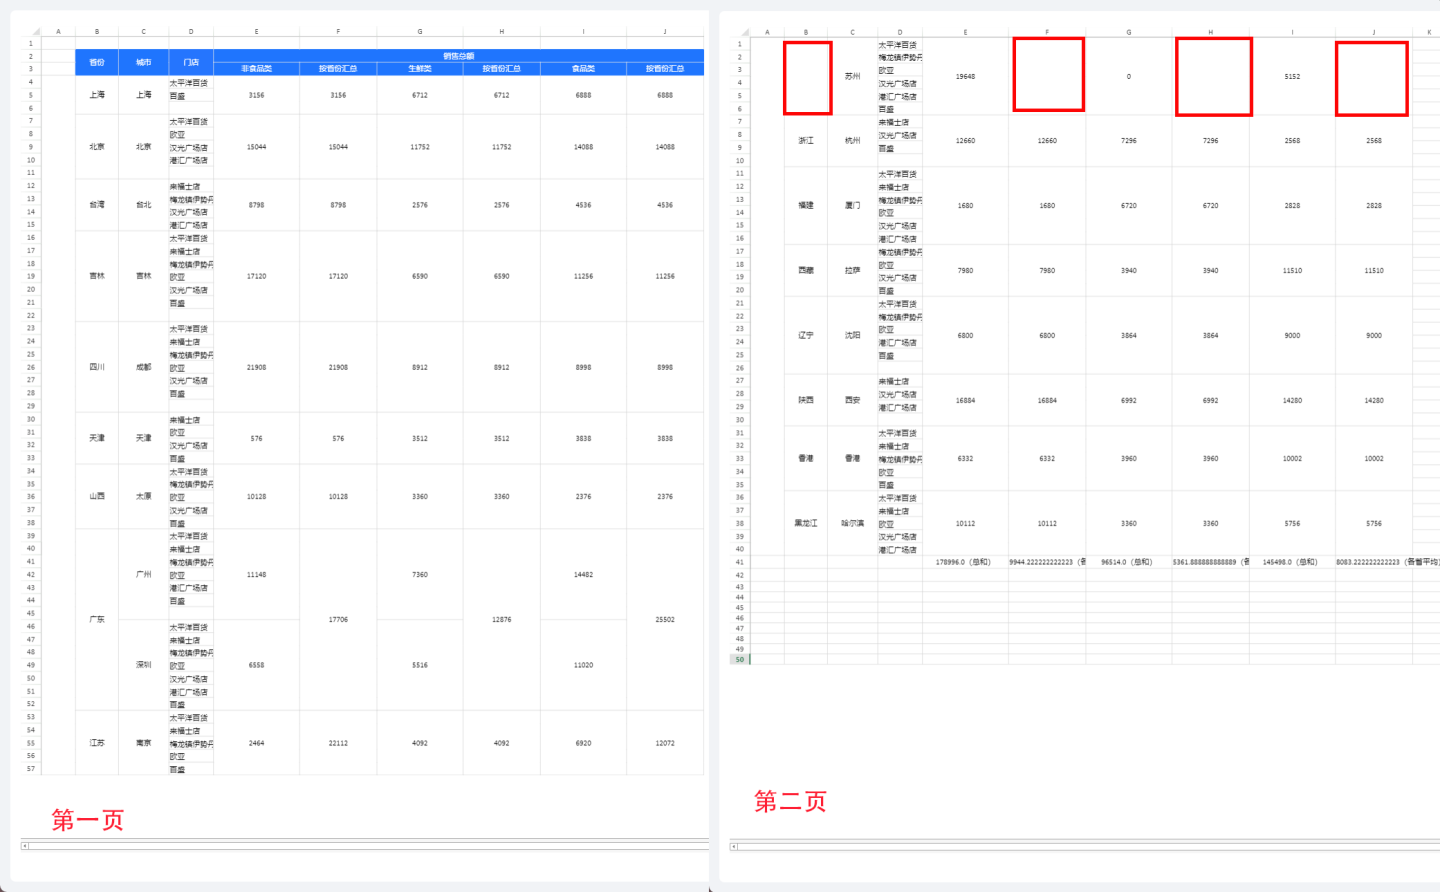
When a merged cell is split across two pages, its content is normally shown only in the cell on the first page; the cell on the second page is left blank. As shown in the image, the red box on page 2 contains no data, which can make the report hard to understand without flipping back to the previous page to see the merged cell’s content.
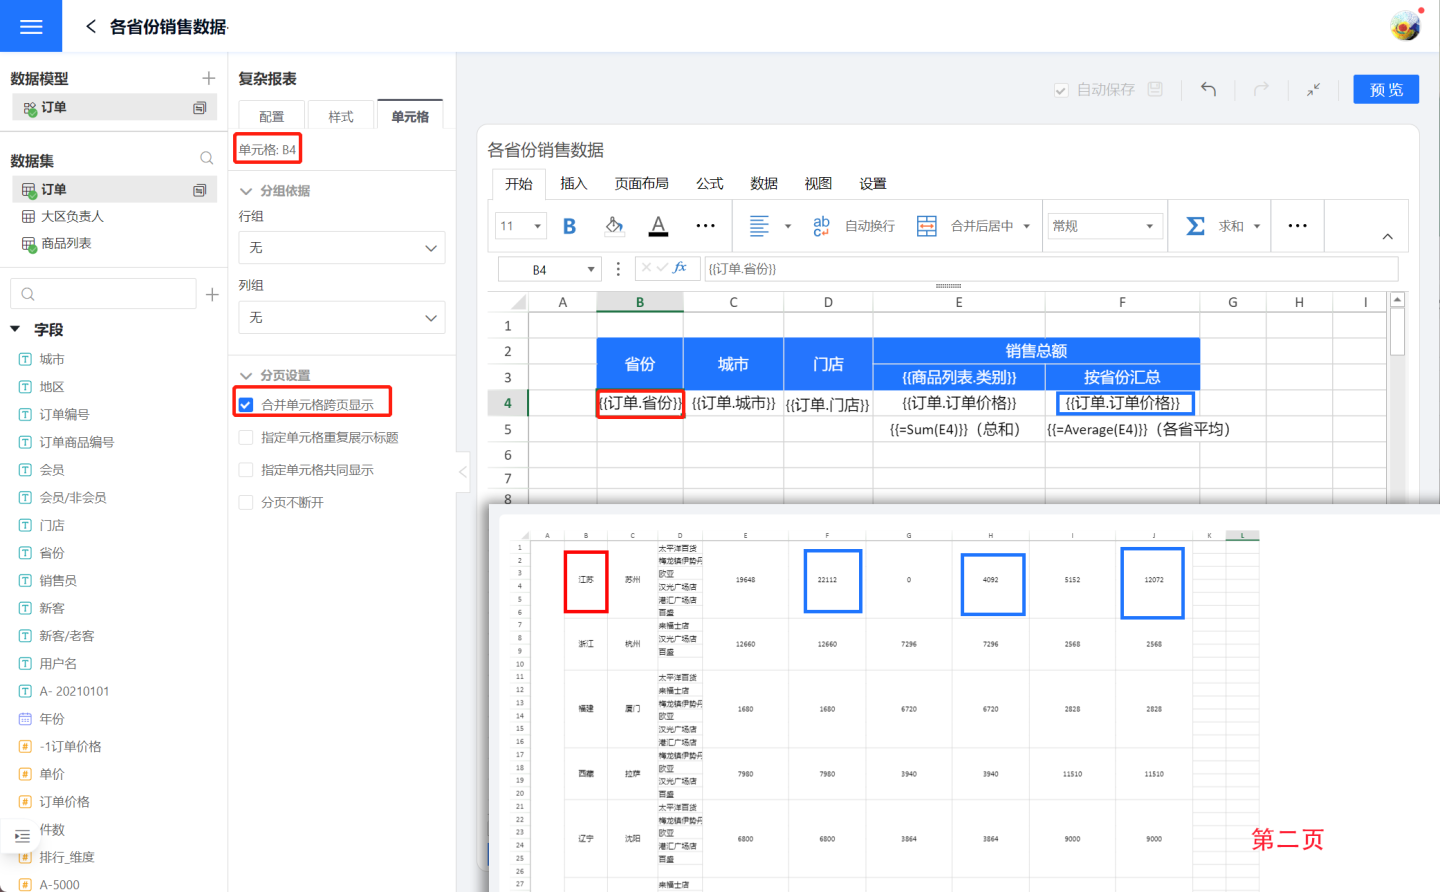
Complex reports support displaying merged-cell content on every page. When a merged cell spans pages, its value appears on each of those pages. In the example above, after enabling this option for “Jiangsu Province” and its corresponding “Province Total,” the data is shown on every page. First select cell B4 {{订单.省份}} (red box), then check “Display merged cell across pages” in the pagination settings. Apply the same setting to the order amount subtotal by province (blue box). The preview is shown below: both “Jiangsu Province” and its “Province Total” now appear on every page.
Repeat Specific Cells on Every Page
“Repeat specific cells on every page” means that certain cells are duplicated across pages, typically used for header or footer explanatory text.
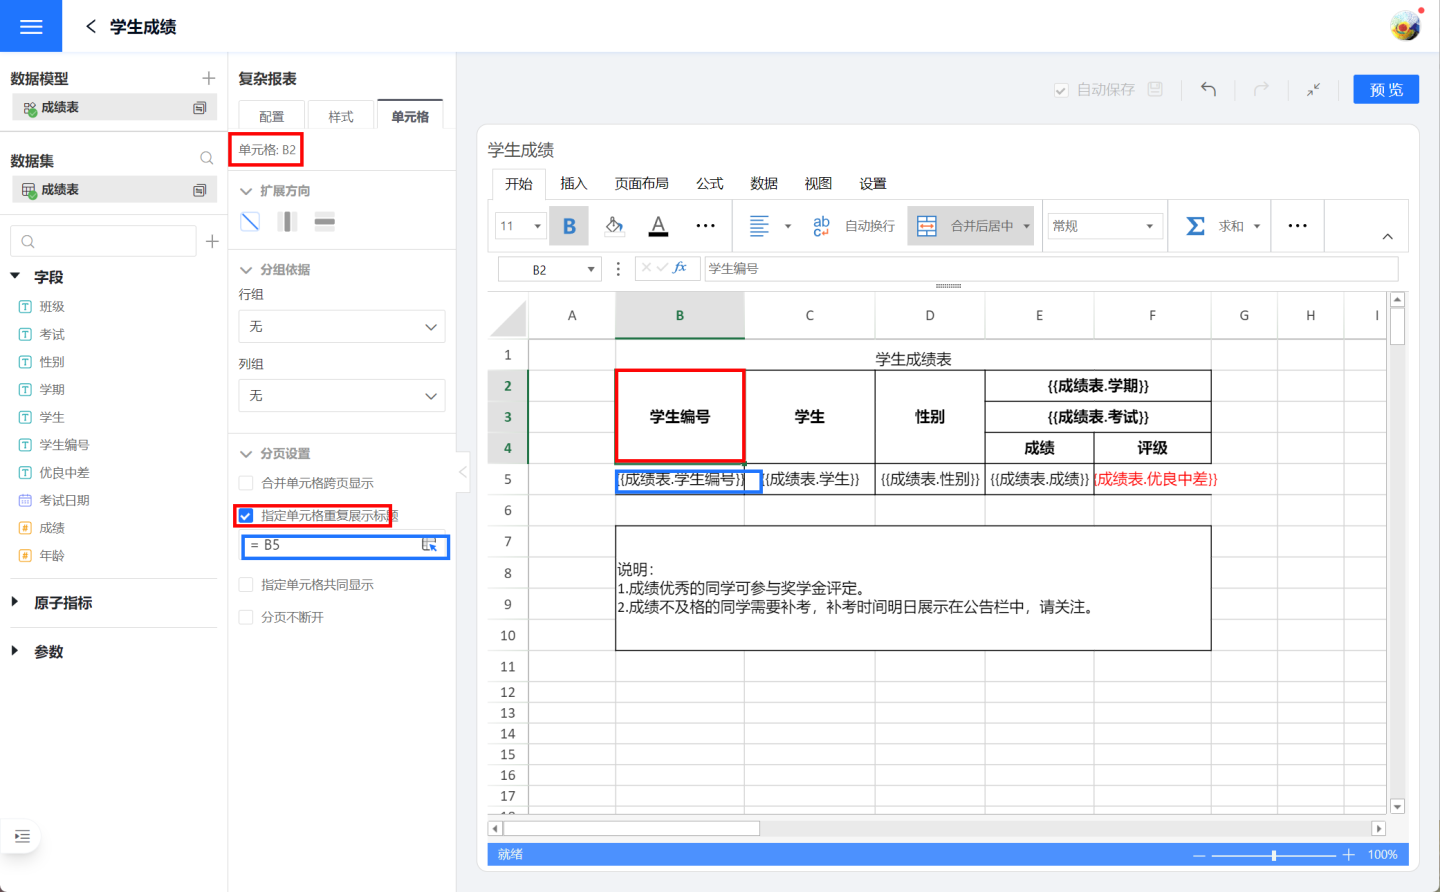
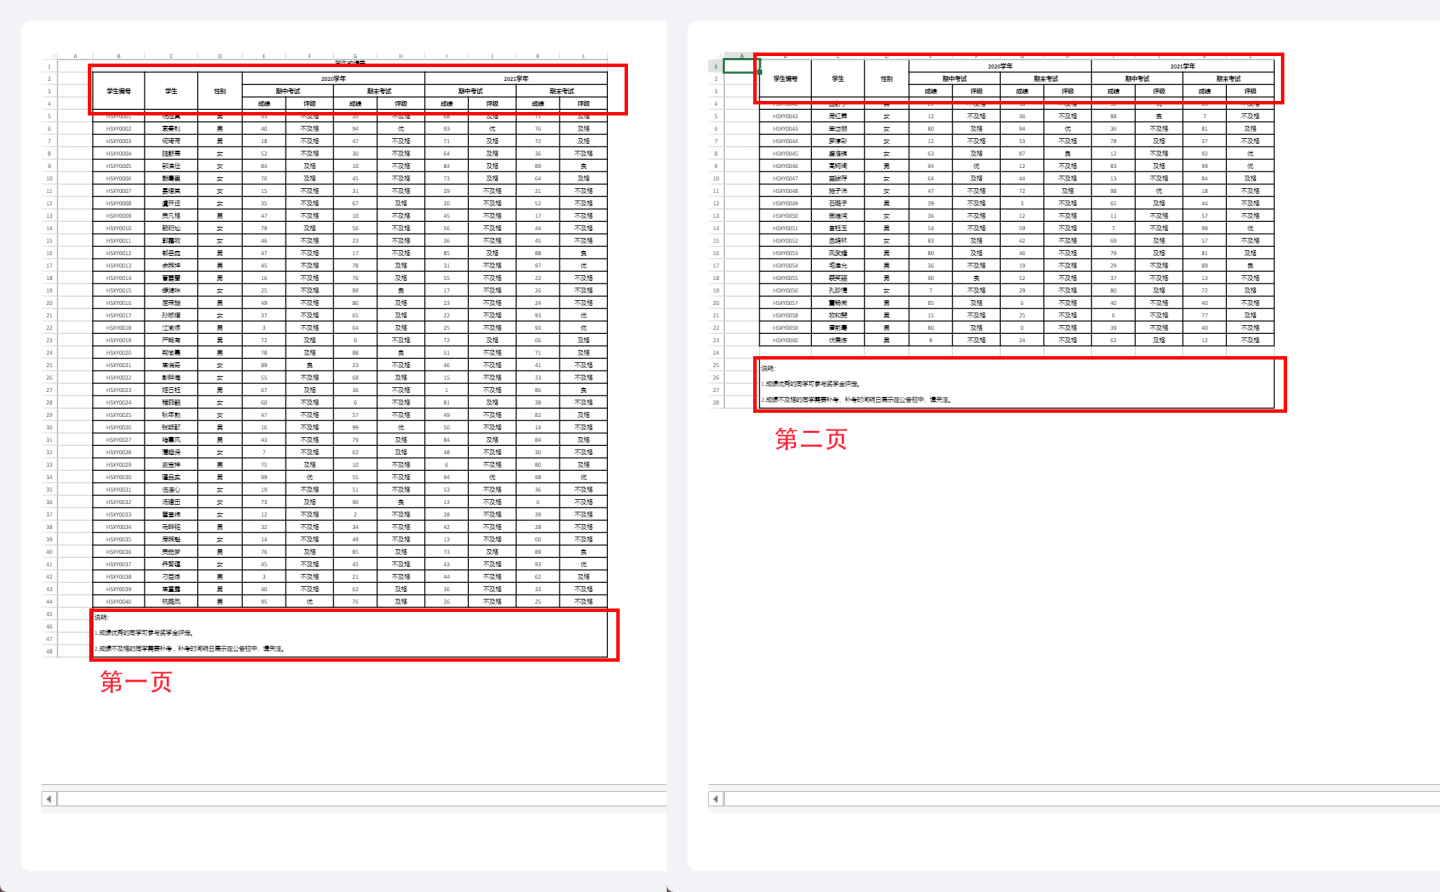
As shown in the image, when the student score table is paginated, the header and explanatory text should appear on every page. Therefore, cell B2 (red frame) in the header is configured for pagination: it is set to repeat together with cell B5 (blue frame). Whenever a page displays student scores, the header is shown.
Likewise, the explanatory cell B7 is configured to repeat with cell B5, so the explanatory text appears on every score page.
The resulting pagination effect is illustrated below: both the header and the explanatory text appear on every page.
Keep Related Rows Together
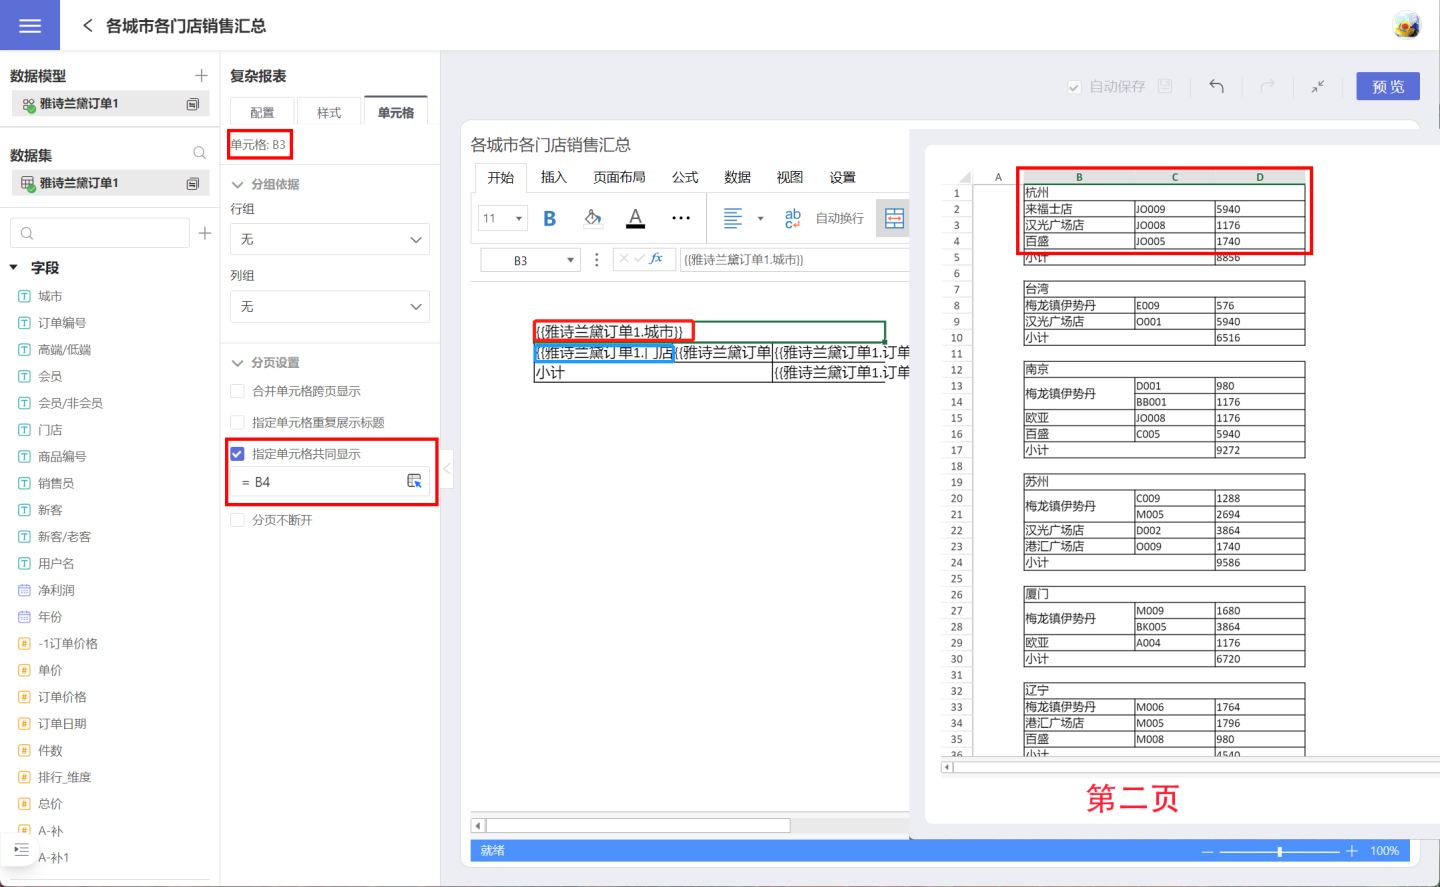
When a report is paginated, data that exceeds the system-defined page size is split across pages. Consequently, related records may be separated, and an orphaned row can appear, breaking the continuity of information. In the image below, the report lists store-level product sales by city; during rendering, the city “Hangzhou” and its stores are split across two pages.
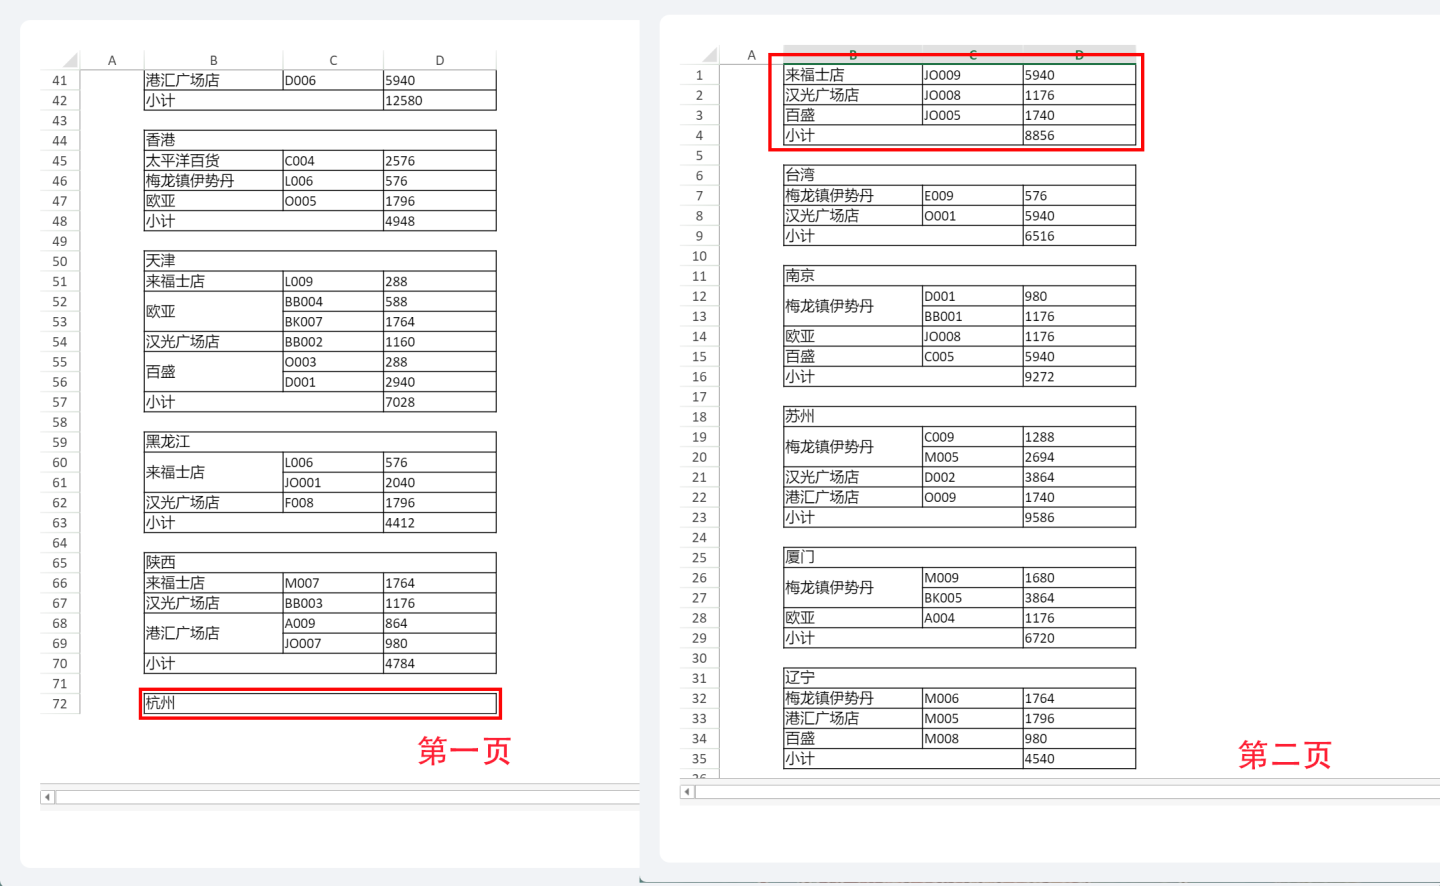
To ensure the city and its stores are displayed together, apply a pagination setting to cell B3 (the city) so it is kept with cell B4 (the store). After the setting is applied, “Hangzhou” is no longer shown in isolation; it appears alongside all of its stores.
Keep Together
During report pagination, some complete pieces of information may be split across two pages. In such cases, you can use the “Keep Together” setting to display the entire block of information on one page.
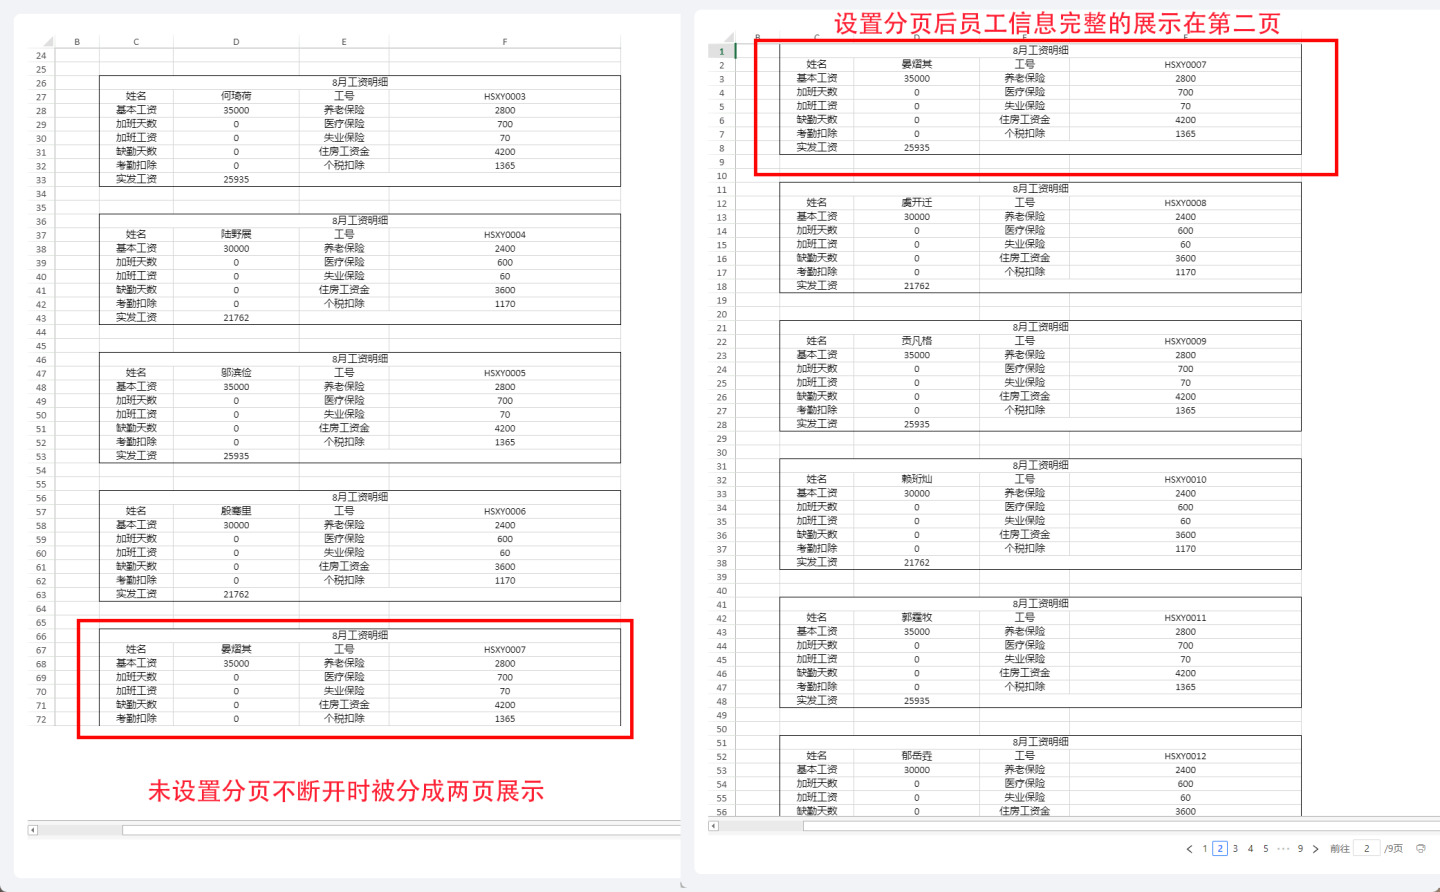
As shown in the figure below, a company’s payslip report is displayed. The goal is for each employee’s information to appear in full on a single page and not be broken by a page break. The setting is applied in the header cell C6 (red frame), specifying that the range from header C6 to the last row of the payslip details F13 (blue frame) must stay together.
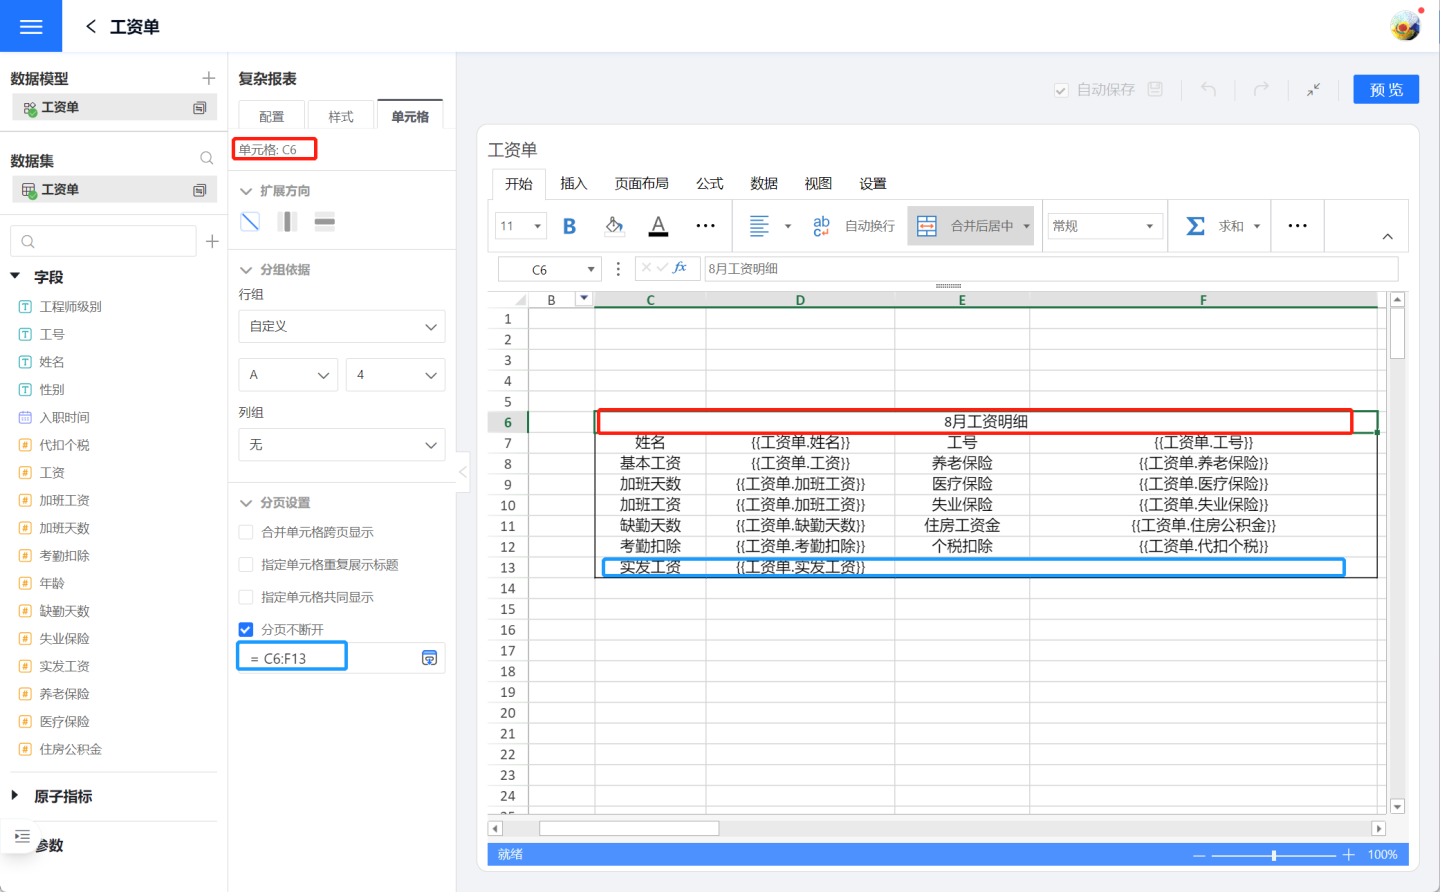
Without “Keep Together,” employee “Yan Yiqi”’s information is split across two pages; after the setting is applied, the entire record for “Yan Yiqi” is displayed intact on the second page.
Tip
“Keep Together” requires selecting all cells that must stay contiguous; you are defining the display range of cells. In the example above, the keep-together range is C6:F13. If only one row of data exists, set the entire row.
Printing
Complex reports support printing.
Version 6.2 Update
Complex reports now include a print function in the edit mode (design page). Report creators can verify layout effects at any time during configuration without switching to preview or published mode.
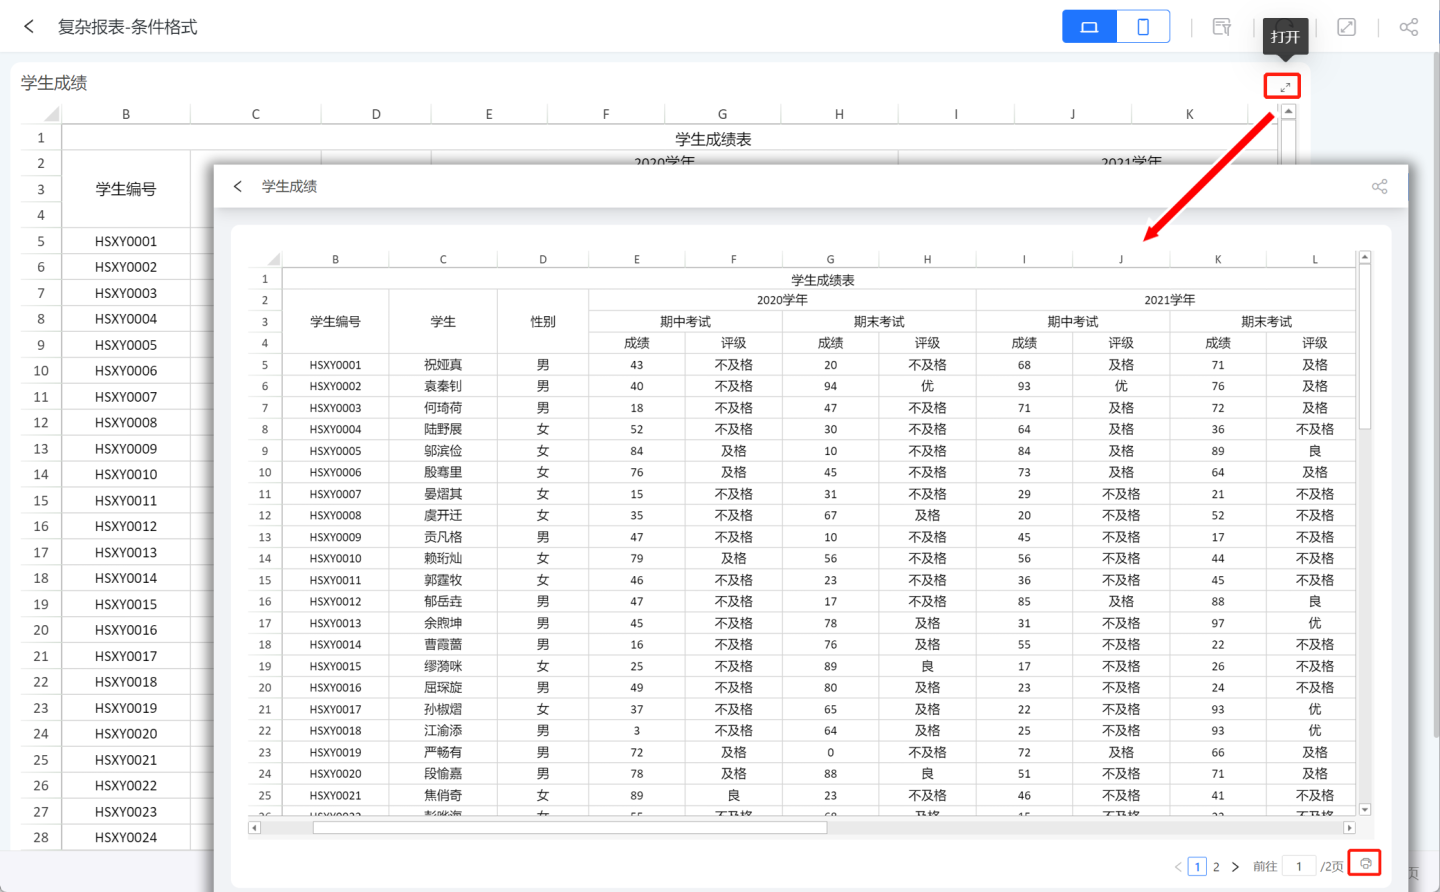
When a report is opened from the App Gallery, a print button appears in the lower-right corner; click it to print.
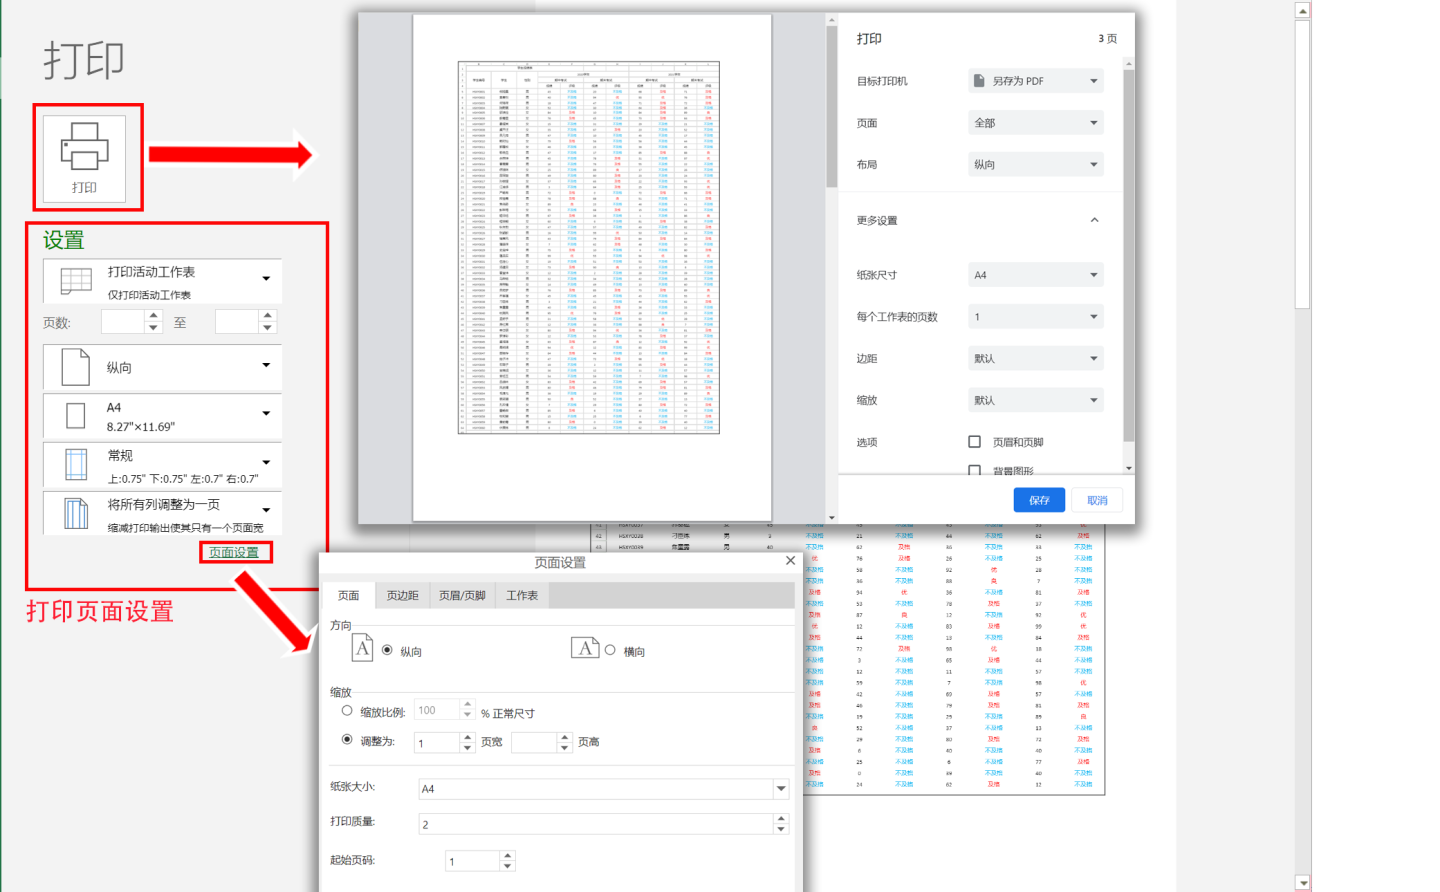
On the print page you can set the page range, pages, margins, header/footer, and worksheet. Clicking “Print” opens the print dialog where you select a printer and proceed.
Version 6.2 Update
Custom header & footer: Users can flexibly define what appears at the top and bottom of each page, automatically inserting titles, page numbers, print time, etc., on every report page.
Publishing Complex Reports
In the published state, complex reports support data filtering, sorting, column hiding, editing, inserting, copying, and other operations.
Interacting with Other Controls
Complex reports currently do not support interaction with other controls.
Calculation Process of Complex Tables
Complex tables operate in two layers: the first layer is HENGSHI HQL computation, and the second layer is the table-template rendering. The rendering in the second layer depends on the results of the first layer, so sorting behavior is primarily determined by the first layer.
First Layer: HQL Computation
Complex tables support multiple primary datasets, and the template configuration supports sophisticated cell grouping-basis settings. The overall flow of the first layer is as follows:
Split by primary dataset: computation starts by separating each primary dataset; every dataset is processed independently.
Divide into computation groups by grouping basis: all axes of each dataset are divided into one or more independent computation groups according to their grouping-basis configuration.
Processing rules per computation group:
- Detail computation group: no aggregation is performed; the raw query results for the relevant fields are passed directly to the template for rendering.
- Aggregate computation group: further sub-grouped by metric:
- Each metric locates its own dimension list via the grouping-basis configuration. One or more metrics whose dimensions are completely identical are combined into a single HQL query.
- All remaining dimensions that have no associated metrics are computed together in a separate HQL query.
- All HQL results are joined on their shared dimensions via an inner join, and only the final merged result is passed to the template for rendering.
Sorting Rules
For aggregate computation groups, sorting is determined by the following rules:
- The dimensions of a metric query are arranged in the order they were added in the template configuration; sort order follows the same sequence—dimensions added earlier have higher sort priority, and those added later serve as secondary sort keys, and so on.
- The first metric's sort order takes precedence; all other metrics are joined according to the first metric's data order and do not independently affect the final sort.
- Within the first metric, dimensions are sorted in the order they were added: earlier-added dimensions sort first.
Configuration Recommendations
Understanding the computation process above helps you configure well-formed table templates:
To control the sort order of a report, pay attention to the order in which dimensions are configured in the template—dimensions configured earlier have higher sort priority.
Confirm which metric is designated as the first metric, because the overall sort order follows that metric's dimension sequence.
Chain grouping-basis settings from coarsest to finest granularity: a grouping basis carries both HQL semantics (affecting computation groups and the number of queries generated) and template semantics (affecting how the template expands and its rendering speed). A poorly configured grouping basis can fragment computation groups, increase the number of HQL queries, and slow down rendering. Aim to link dimensions and metrics that share the same hierarchy into a single dependency chain, running from the coarsest-grained dimension down to the finest, and then to the metrics.
Recommended configuration (using "personnel and their individual metrics" as an example, where each person has a name, city, province, and country):
Country ← Province ← City ← Name ← individual metricsNot recommended (breaking Name out into separate parallel dependency chains):
Name ← individual metrics Name ← Country Name ← City Name ← ProvinceWhy not: the second approach splits what could be a single computation group into multiple independent queries, increasing the number of HQL queries and requiring the template renderer to correlate more independent result sets, which degrades performance.
Usage Limitations and Notes for Complex Tables (Advanced Reports):
- Row limit not enforced: The system-wide setting that caps the number of rows exported from a table does not apply to complex tables. Because a complex table can merge multiple Datasets through template rendering, the usual per-table export limit is meaningless here and is therefore unsupported.
- Dataset row limit: Rendering a template with data is memory-intensive, so we cap the rows used for template rendering at 500,000 by default. This can be adjusted via the configuration key
COMPLEX_TABLE_DB_QUERY_LIMIT; keep the value moderate to avoid excessive memory consumption. - Display format setting: Display formats are configured inside individual cells, unlike other Charts where they are set on the axis.
- Chinese-character garbling on export: If Chinese characters appear garbled in exported PDF or Excel files, install the required Chinese fonts on the server and set the configuration key
GRAPECITY_GCEXCEL_FONTS_PATHto the parent directory that contains those fonts. - Cross-source calculations in templates not supported: You cannot use template formulas to compute across multiple data sources. Combine the sources into a single Dataset first, then use that Dataset in the complex table.
- Overall border when printing: A complex table is printed with an overall border. If you do not want it, download the data and print it externally.
- Null-value display issues: A
nullinjected into the template may turn into an unexpected number and can even freeze the browser. Replace nulls in the Dataset before rendering (e.g., via null-value replacement). - Conditional formatting fails under paging: When paging is enabled, conditional formatting stops working; disable paging in this scenario.
- QR-code recognition fails under paging: When paging is enabled, QR-code recognition stops working; disable paging in this scenario.
- Image recognition fails under paging: When paging is enabled, image recognition stops working; disable paging in this scenario.
- Double-equals formula templates fail under paging: When paging is enabled, double-equals formula templates (e.g.,
{{==round(B8-C8,2)}}) stop working; disable paging in this scenario. - Text and date fields cannot be non-group aggregated: In the axes of a complex table, text and date fields can only be used for grouping, not for aggregations such as
max. Doing so causes display anomalies; aggregate in the Dataset first, then render the complex table in detail mode. - Only one Sheet supported: The template must contain a single Sheet; multiple Sheets are not supported.
- Detail and aggregate data are computed separately: If one axis is detail and the other is an aggregate calculation, they should not be set as each other’s grouping field; such a setting will be ignored.
- Exporting to Excel disables QR-codes and images: QR-code generation and image-URL recognition are features of the complex table itself, not of Excel, so they will be lost after Excel export.