Line Chart
Line Chart
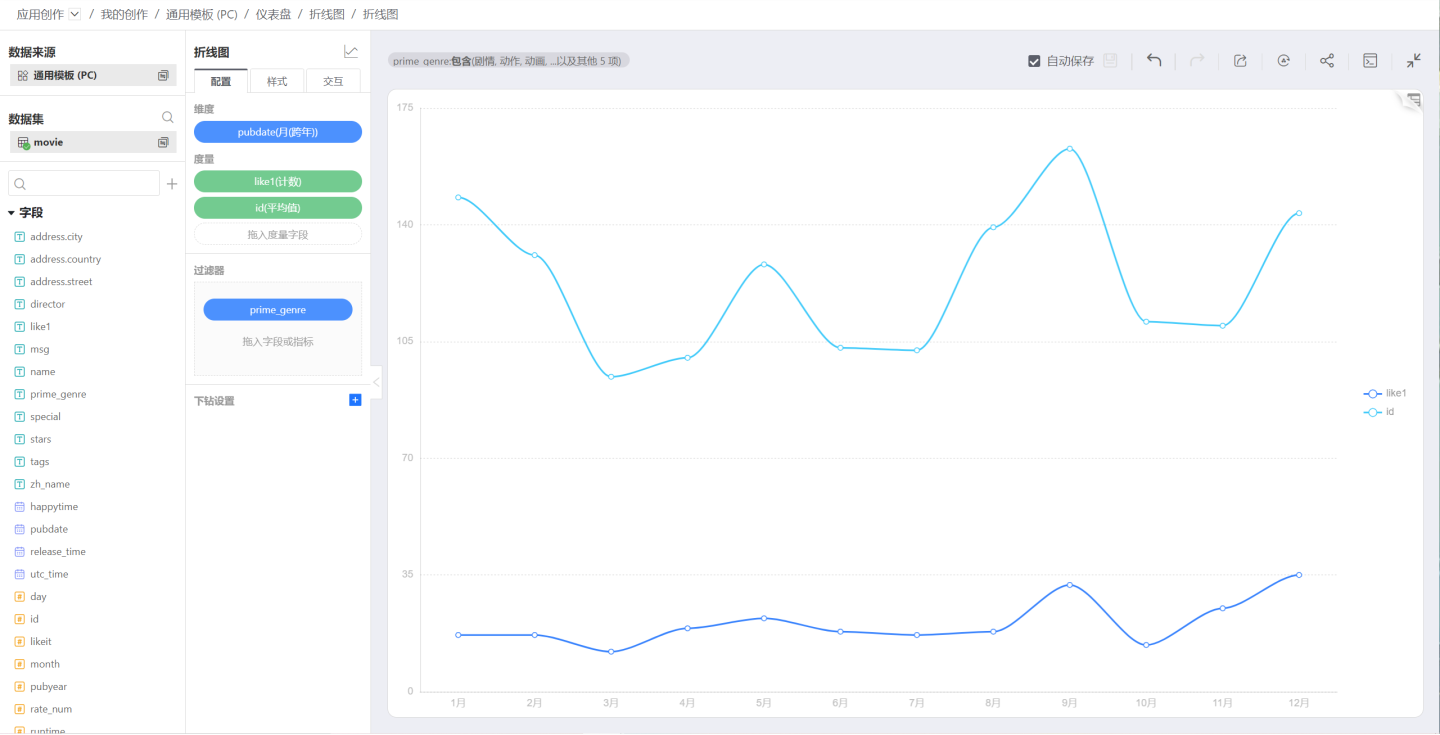
A line chart typically displays the trend of one or more measures over a time dimension and can be used together with a bar chart.
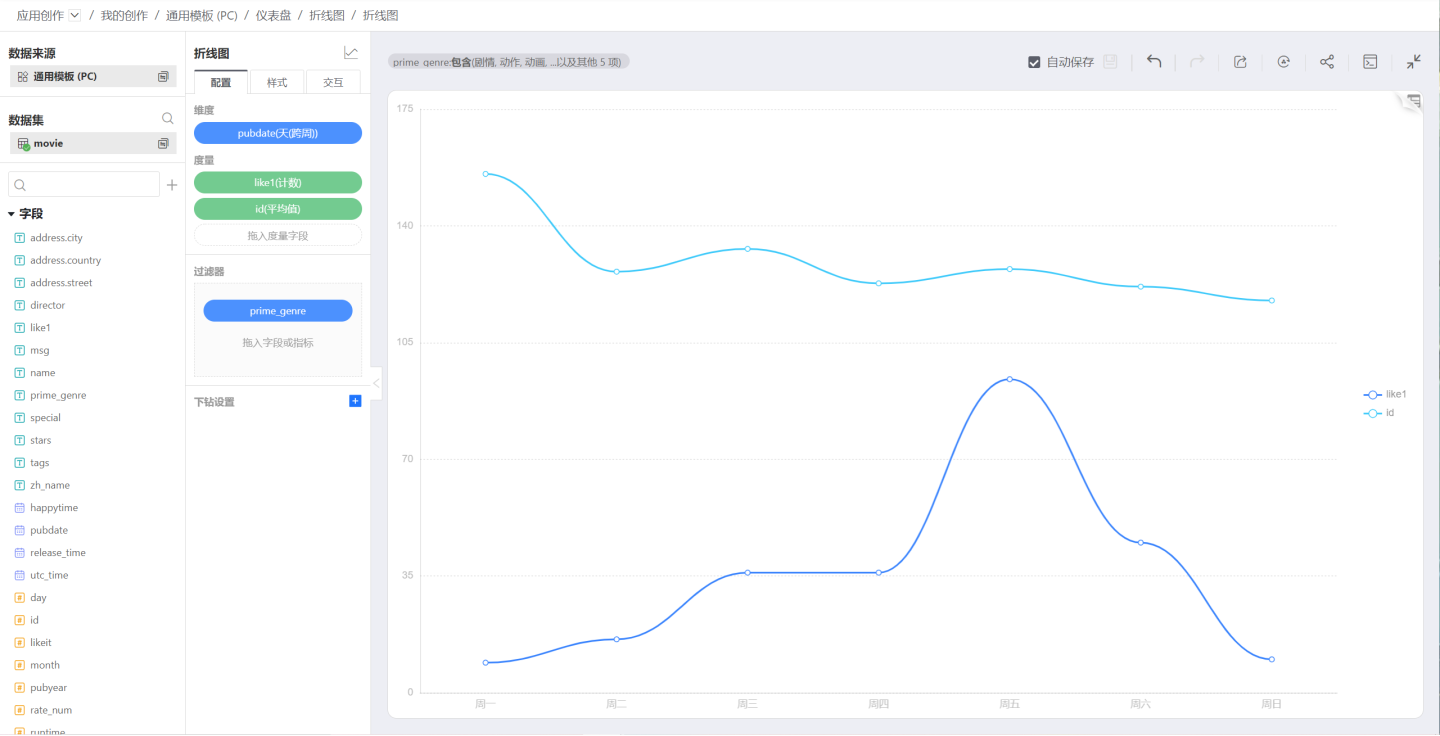
- Adjust granularity on the time dimension: year, month, day, etc.
Version 6.2 Update
Line charts and line-bar combo charts now support setting field lines to dashed style. Configuration path: Style > Others > Line Type, supporting both global and per-field settings.
Grouped Line Chart
A grouped line chart is equivalent to splitting a single-series line chart into multiple single-series line charts.
Advantage: more intuitive and clearer.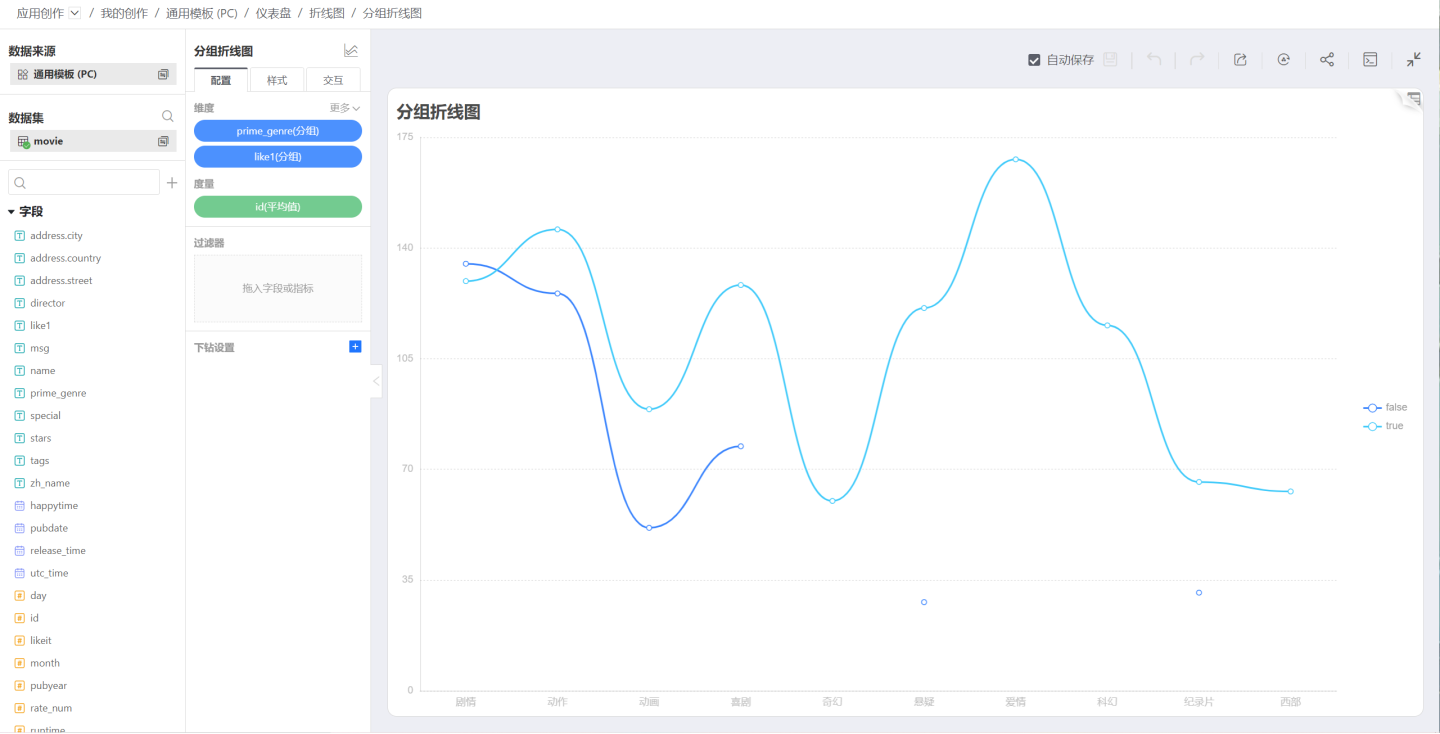
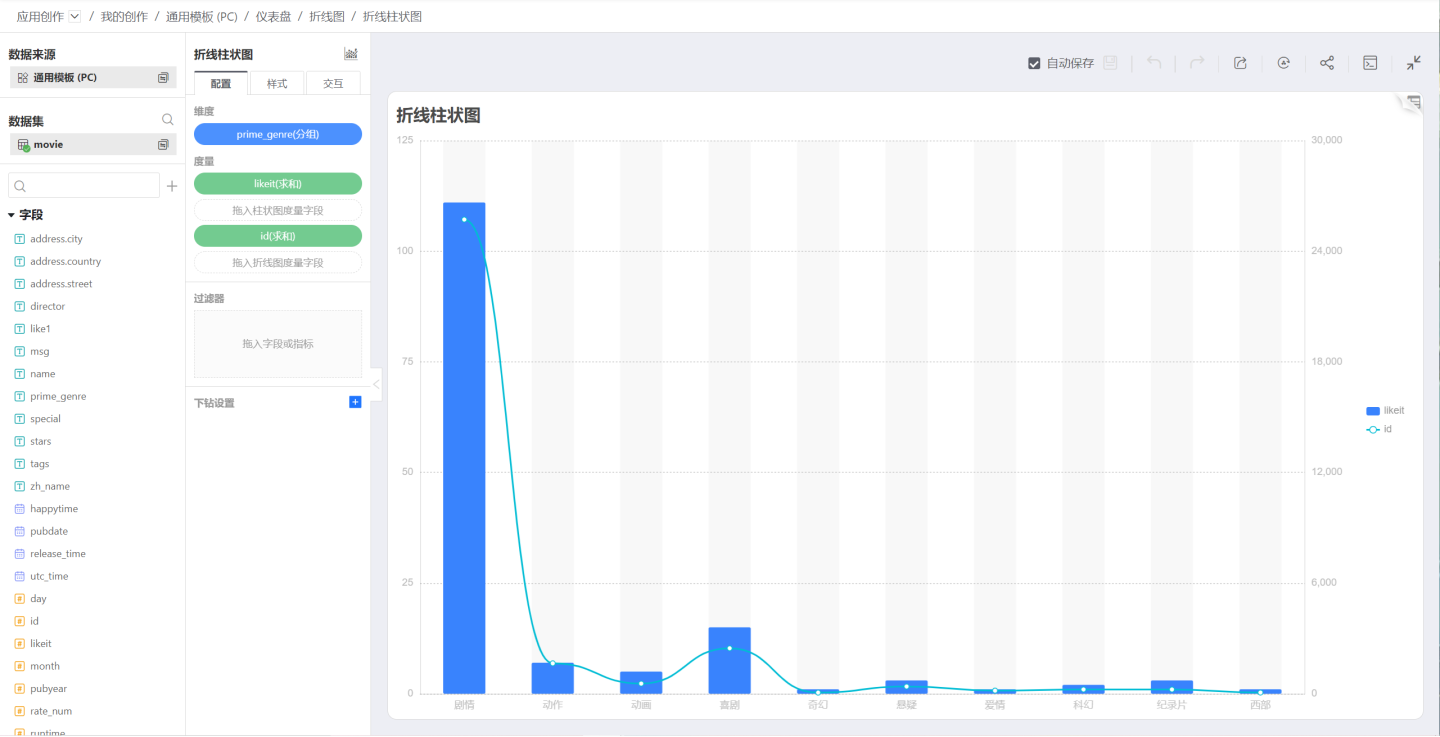
Line-Bar Combo Chart
You can combine line and bar elements based on a time dimension.