Combination Chart
The Combination Chart is a new chart type introduced in HENGSHI SENSE 3.2. In a Combination Chart, you can:
- Add any number of axes
- Set the position and direction of the axes
- Freely add graphic elements in a Cartesian coordinate system
- Lines, bars, and areas each support custom stacking
- Use measures outside the graphic elements to control chart labels and tooltips
- Control chart colors with any dimension/measure
X-axis/Y-axis
In a combination chart, you can set which metric controls the X-axis and Y-axis, allowing you to create horizontal or vertical charts as needed.

Charts
In a combination chart, you can select the shape of each measure above each measure area. Currently, the following shapes are supported:
- Column
- Line
- Area
- Circle
- Ring
- Shape
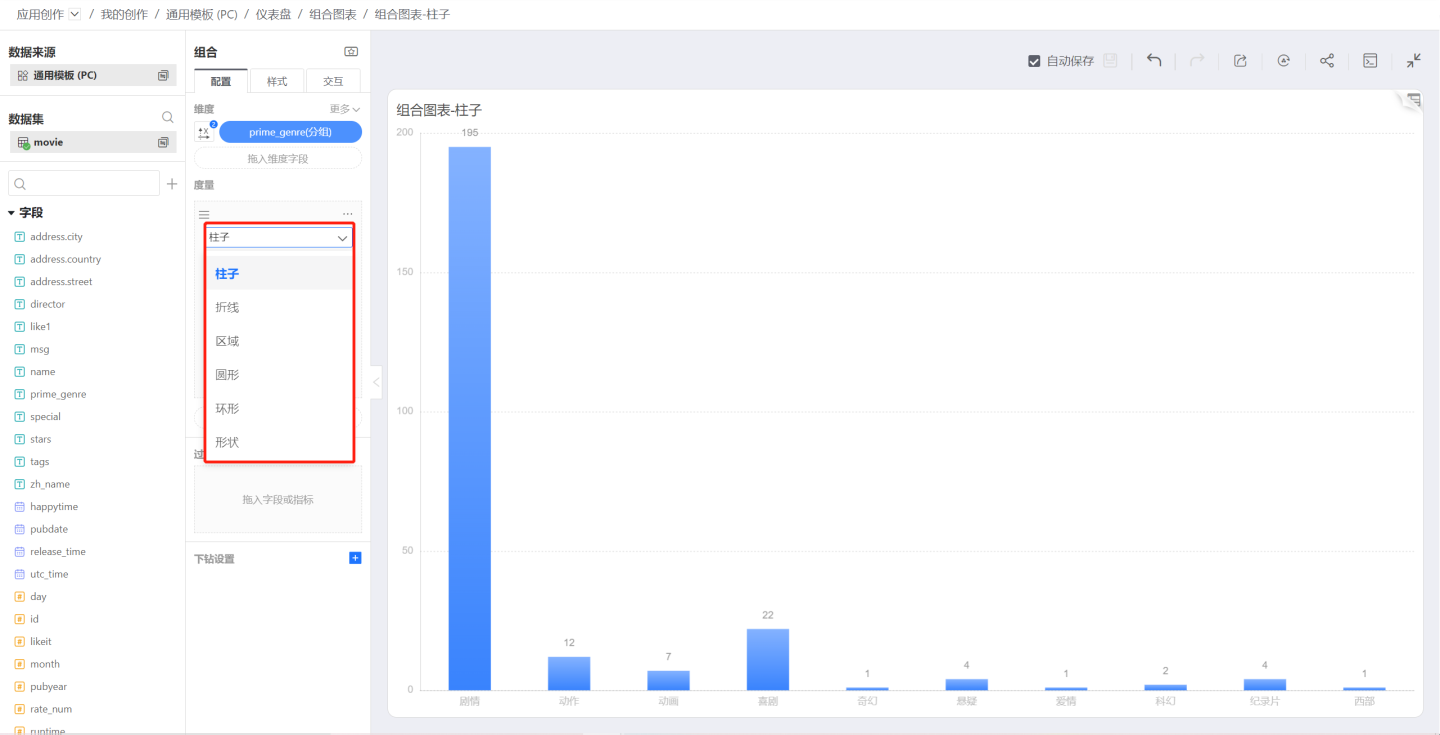
In a combination chart, each measure can be assigned a different shape, allowing multiple shapes to appear in a single chart. The reason the shape settings are displayed in the measure area is that when plotting, the graphical elements are plotted based on the size of the measures.
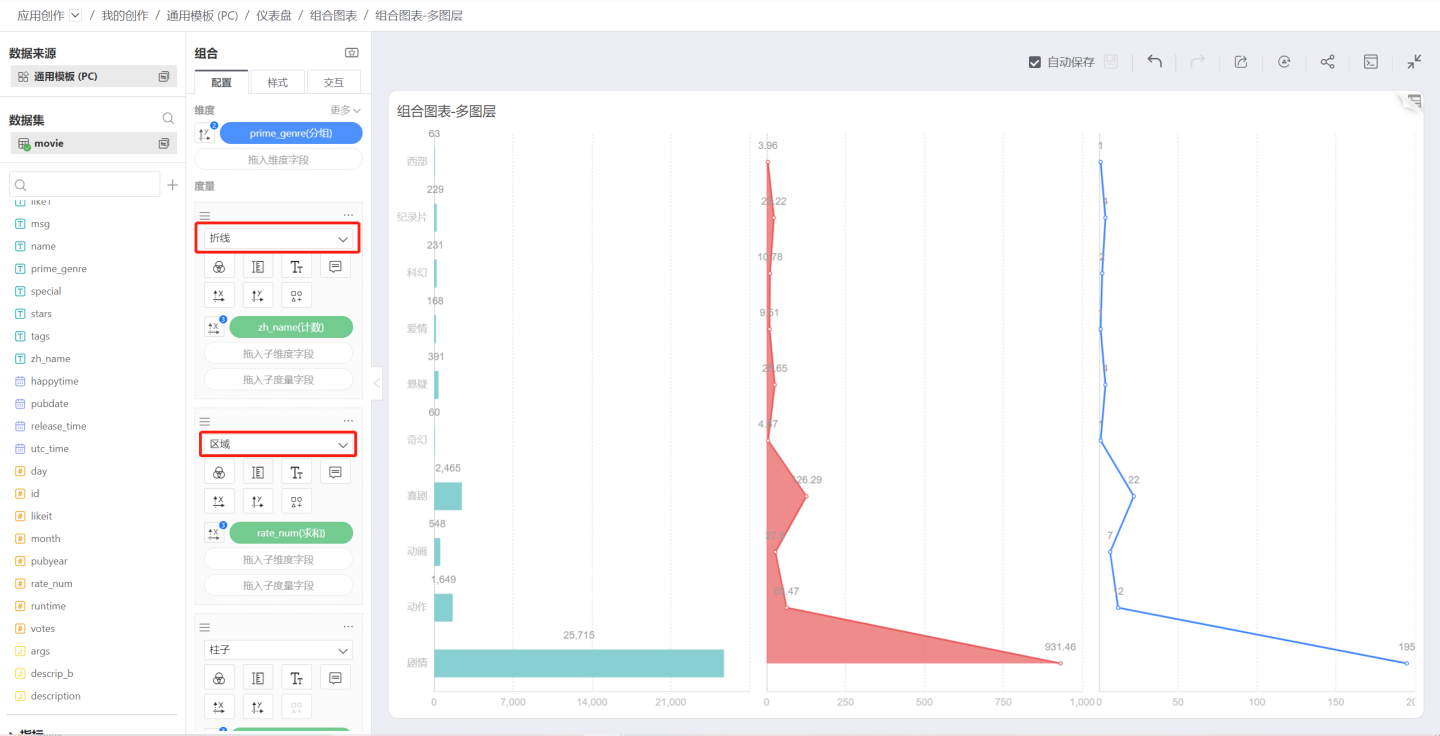
Column
Column is the default chart shape.
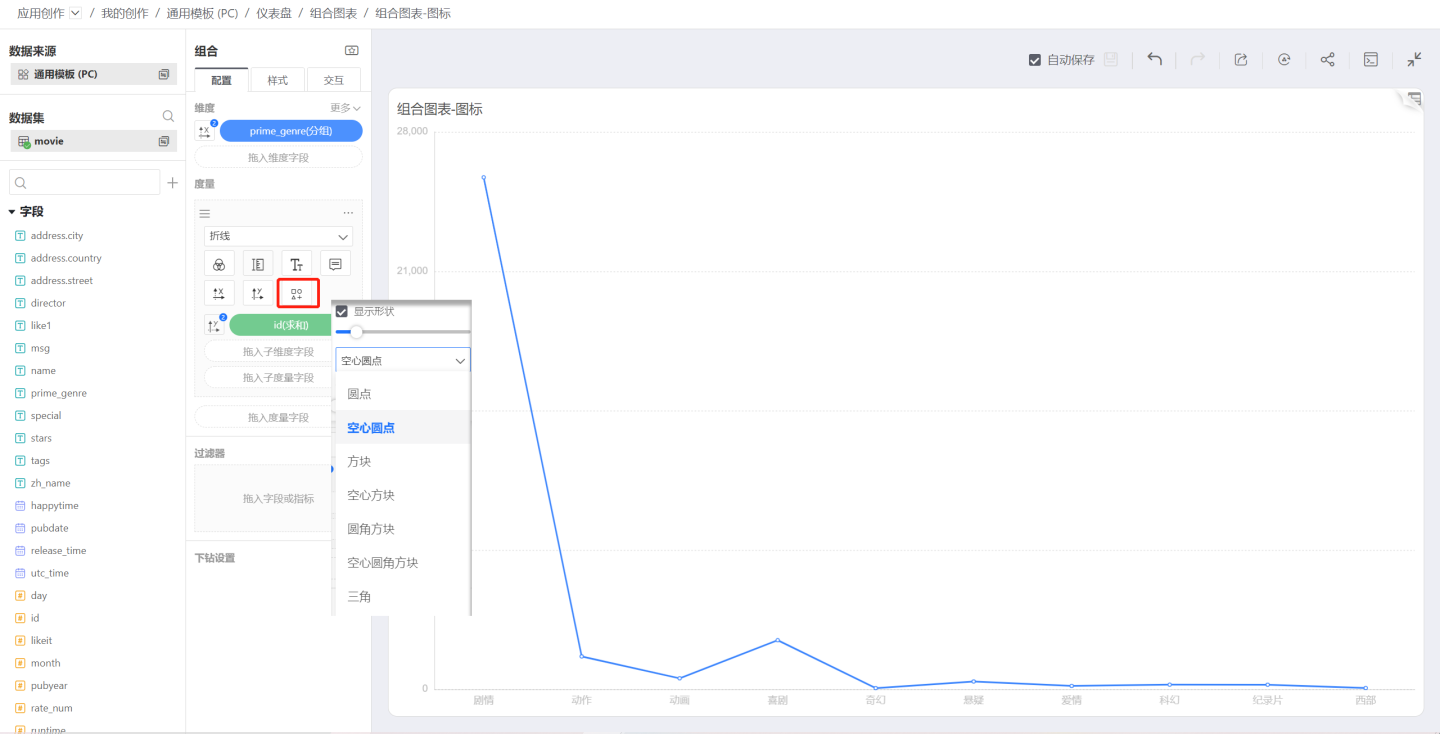
Line
When the shape is selected as Line, the symbol control will be enabled. Click on the symbol icon to choose the shape and size of each data point.
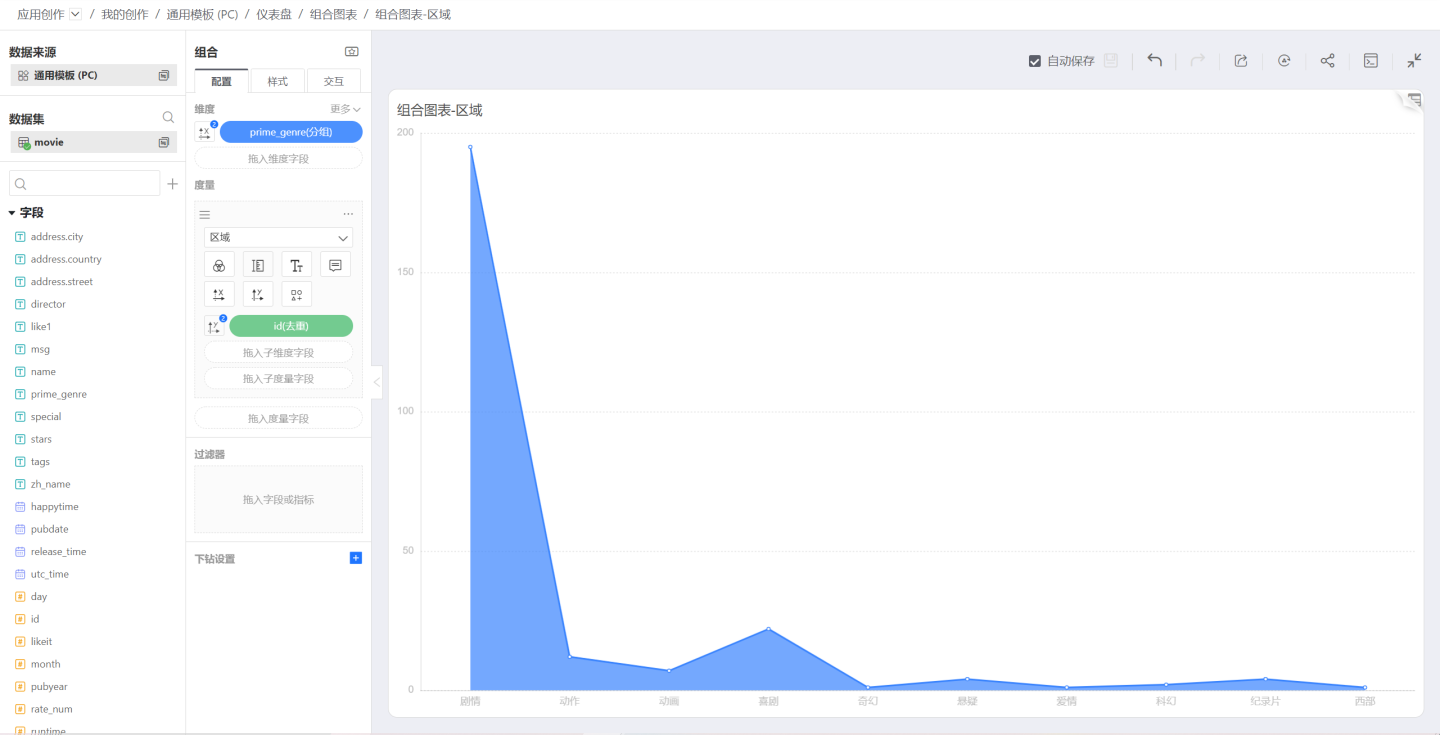
Area
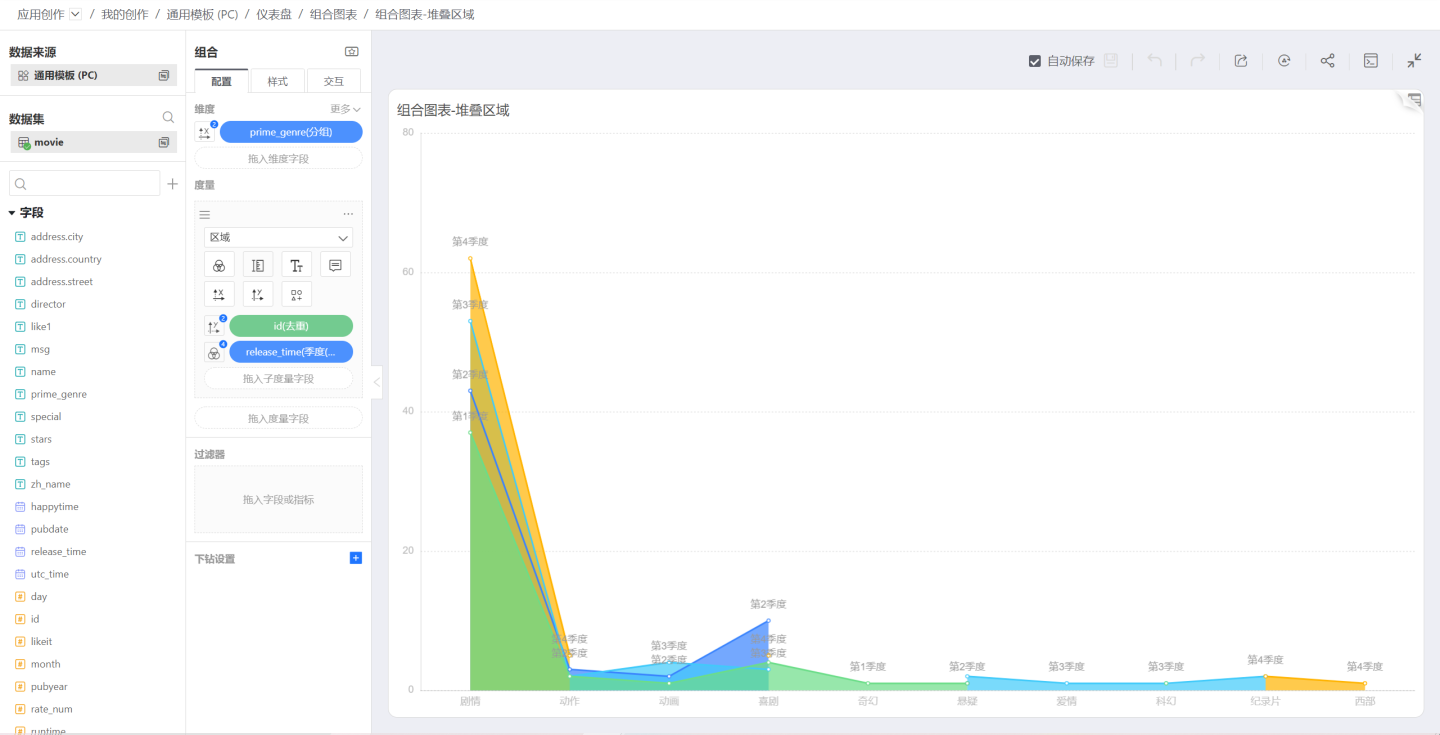
Select Area in the shape:
Drag a sub-dimension into the measure, the area chart becomes a stacked area chart, then use the sub-dimension to control color, labels, and tooltips:
Circle
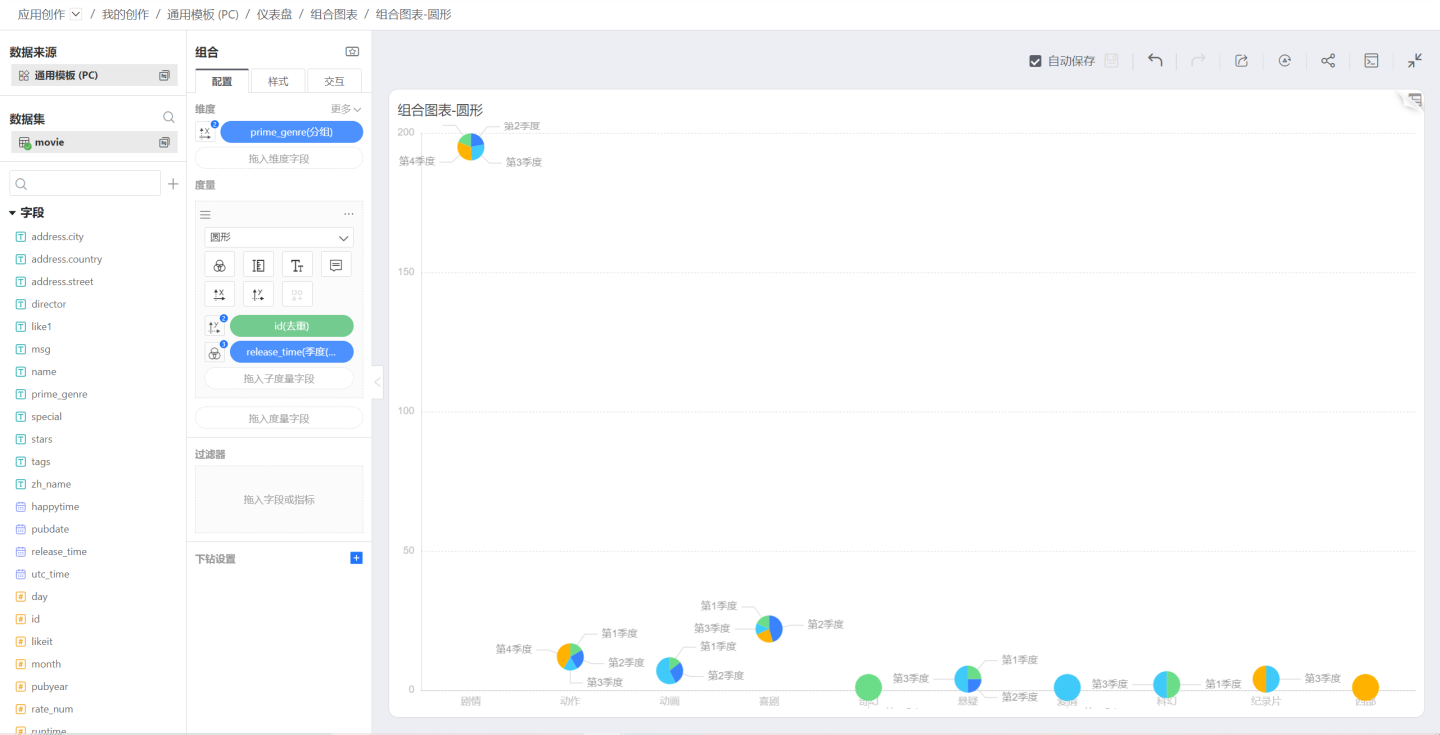
Based on the above figure, change the shape to Circle, and the resulting chart is as follows. The size of the circle can be controlled using the Size icon:
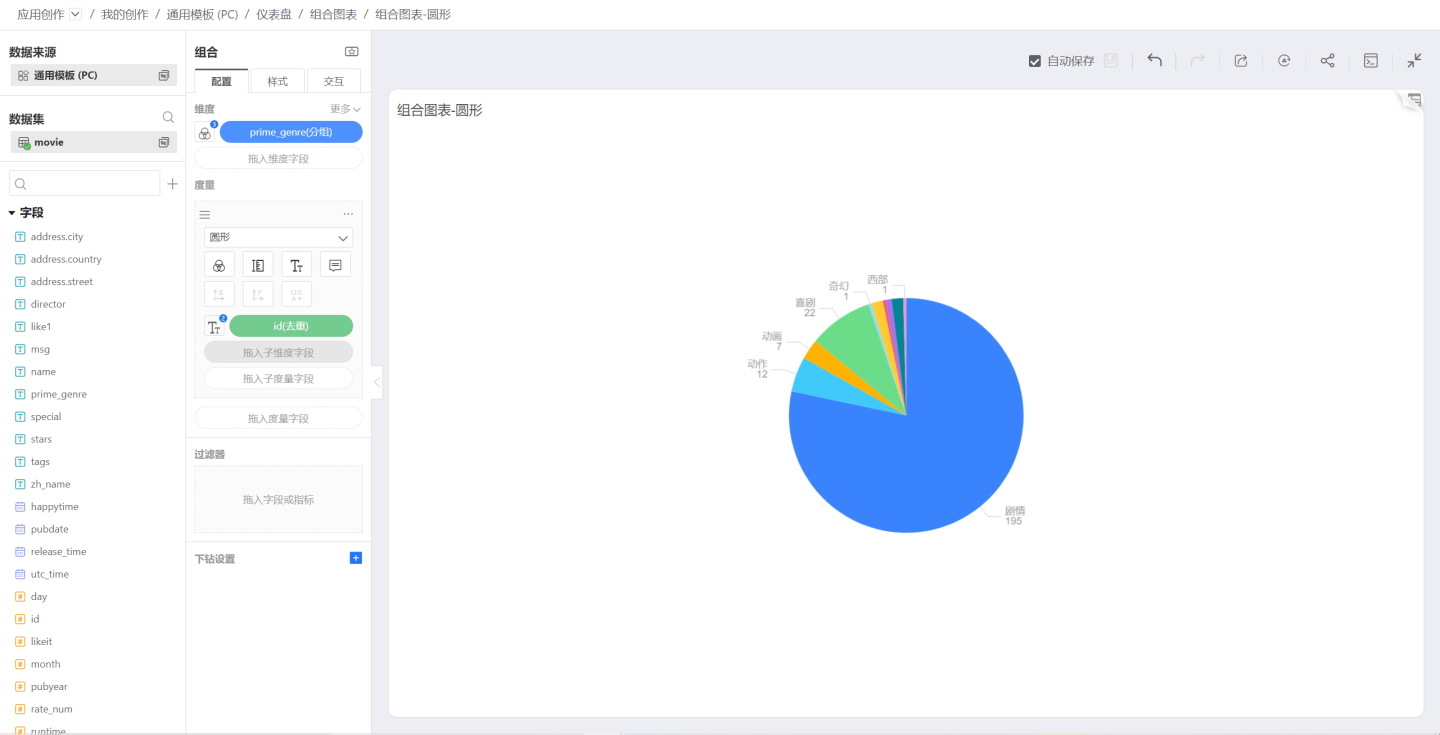
You can use Circle to draw a pie chart under the condition that neither the dimension nor the measure controls the X-axis and Y-axis. The dimension controls the color, label, and tooltip, while the measure controls the label and tooltip:
Angle and Radius
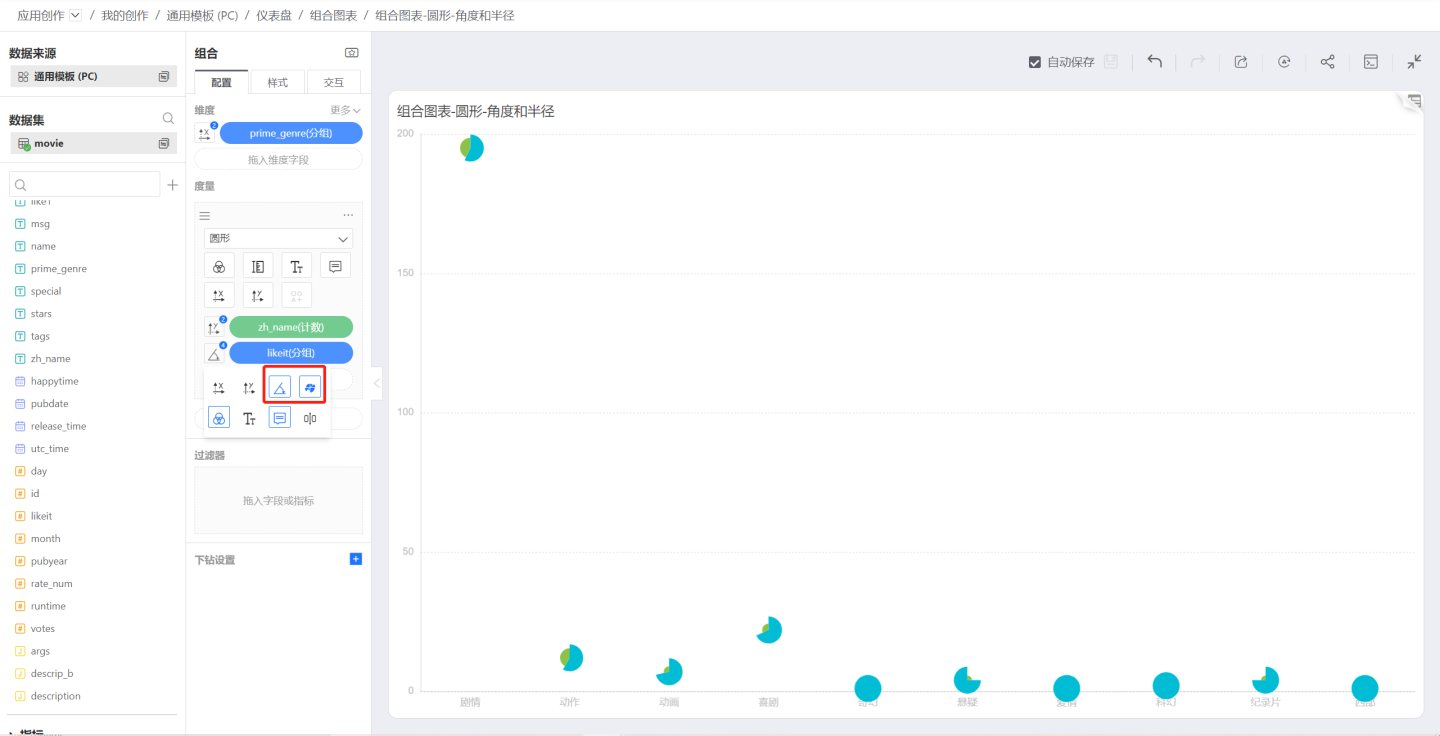
When the shape is circular, dragging in a sub-dimension allows the sub-dimension to control the angle and radius of the circle.
Angle controls the sector angle corresponding to the value of each sub-dimension. If this option is not selected, each sector will have the same angle.
Radius controls the size of the sector radius corresponding to the value of each sub-dimension. If this option is not selected, the output is a pie chart; if selected, the output is a Nightingale chart.
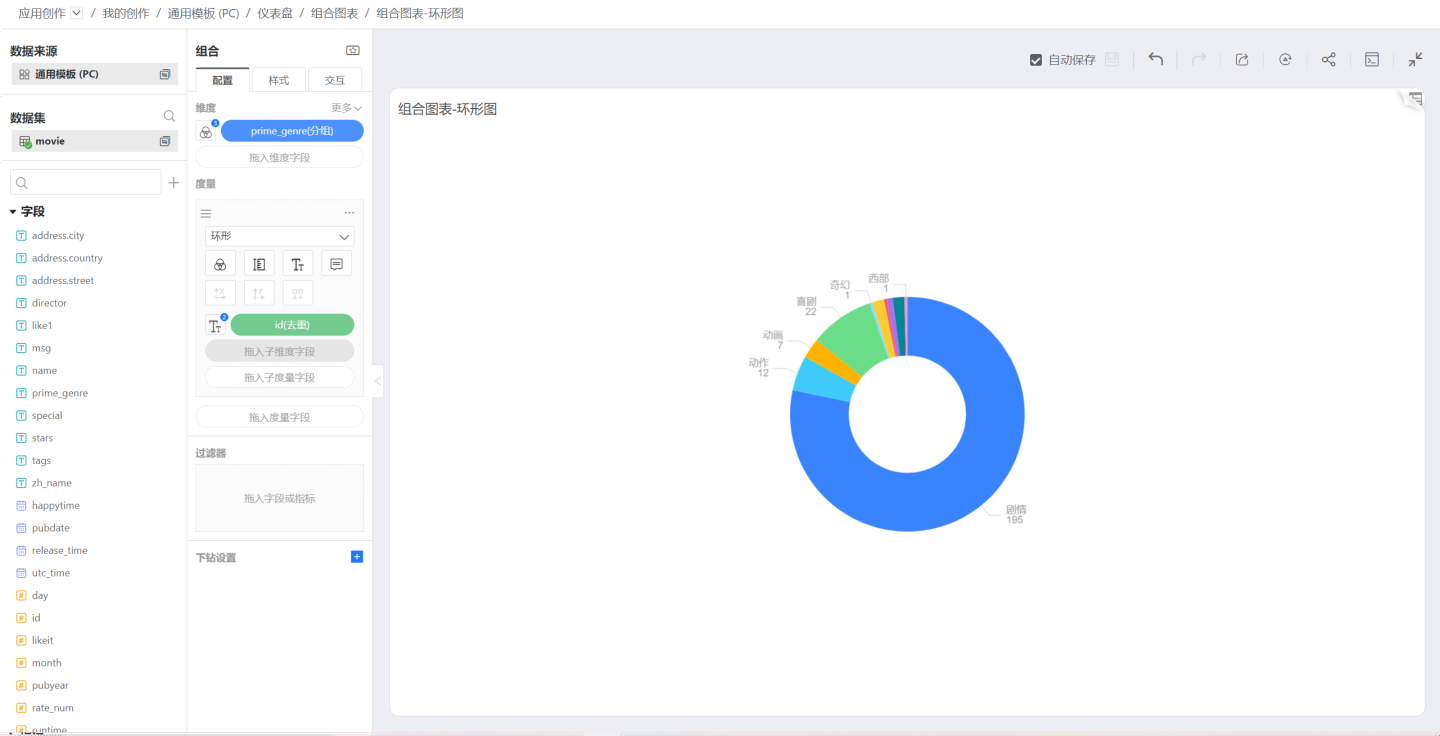
Donut
When selecting the Donut shape, the chart will be displayed as a donut chart.
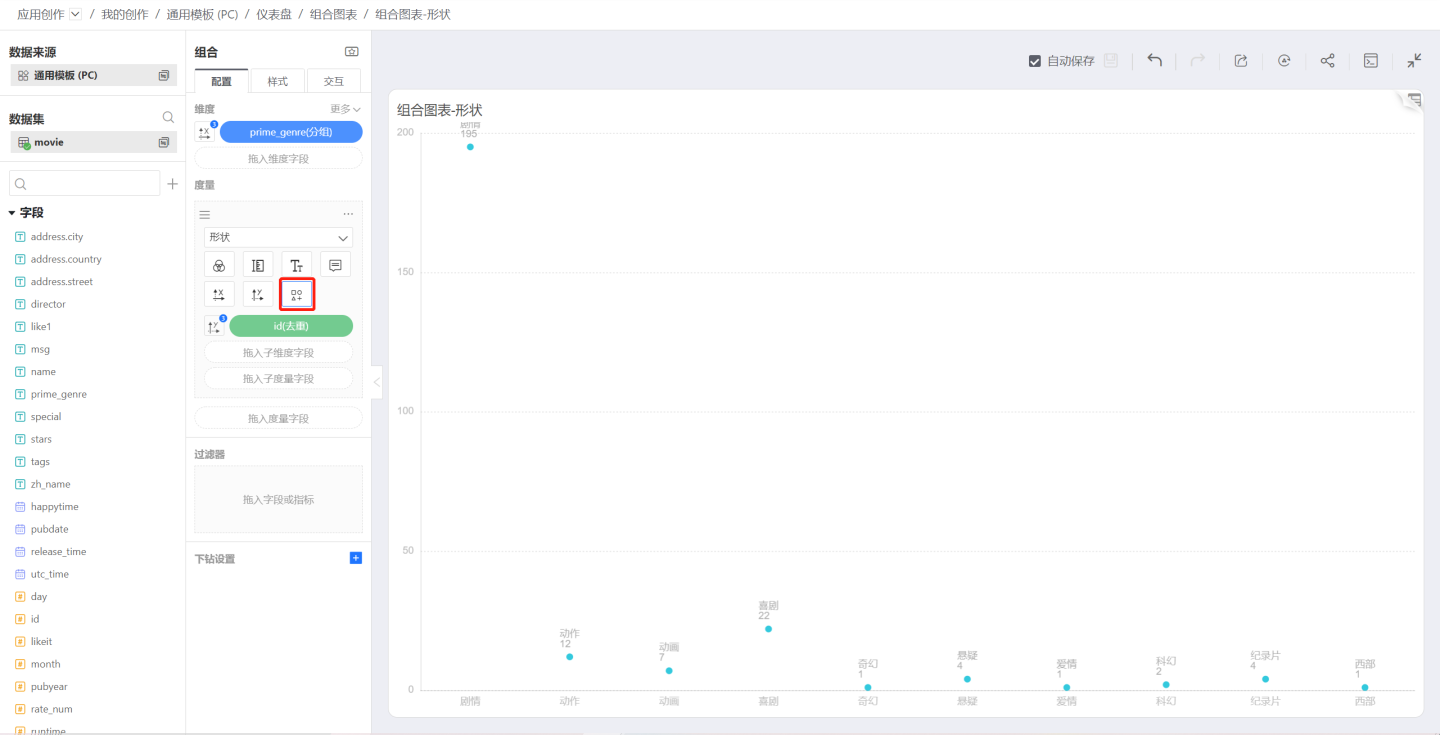
Shape
When the shape selection is set to Shape, the data points are displayed as the selected symbol. You can choose the symbol to be displayed through the symbol pop-up window:
Color
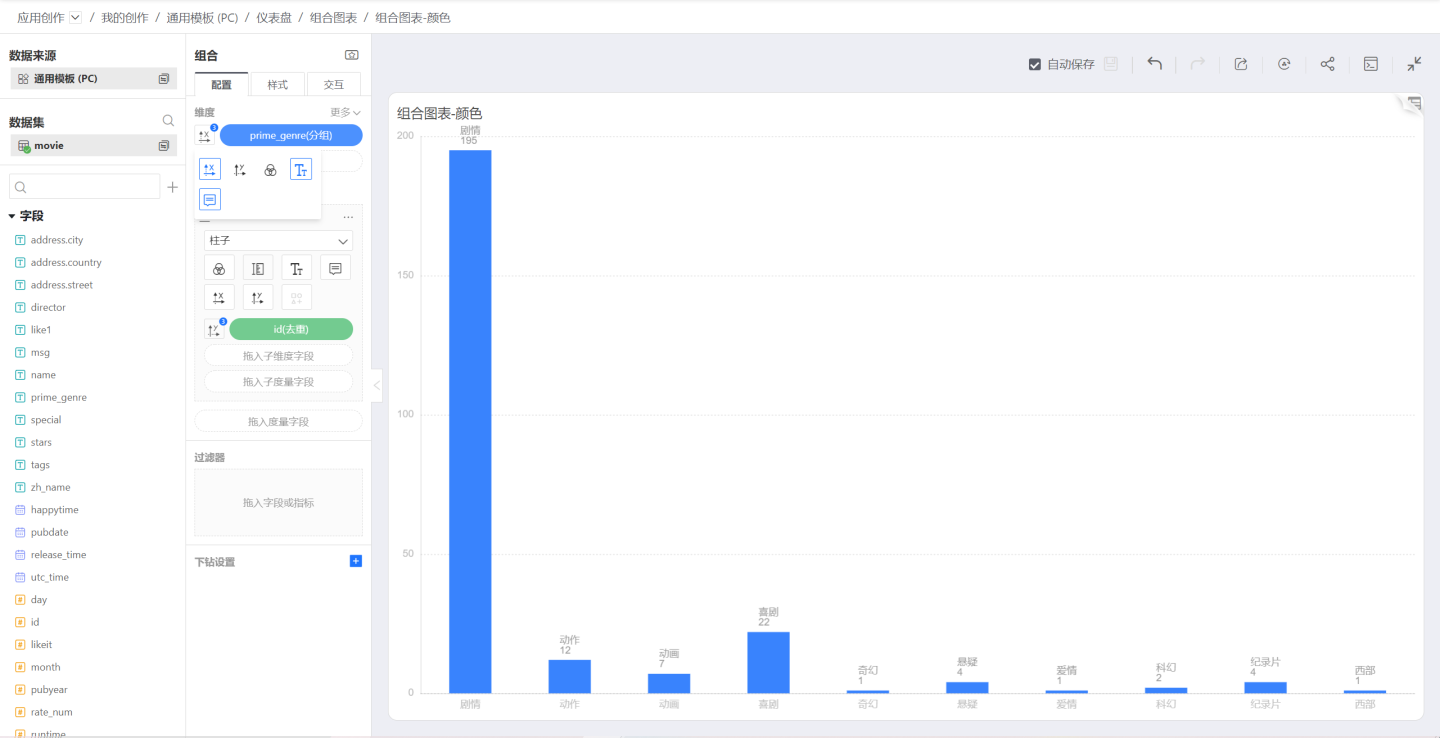
Monochrome
When you first create a chart, there are no dimensions/measures controlling the chart color, and the chart is monochrome, as shown below:
Discrete Colors
To control the chart color using dimensions, click the icon on the left side of the dimension to bring up the control menu, and select the color icon. At this point, the chart color is discrete, meaning each dimension value has its own color.
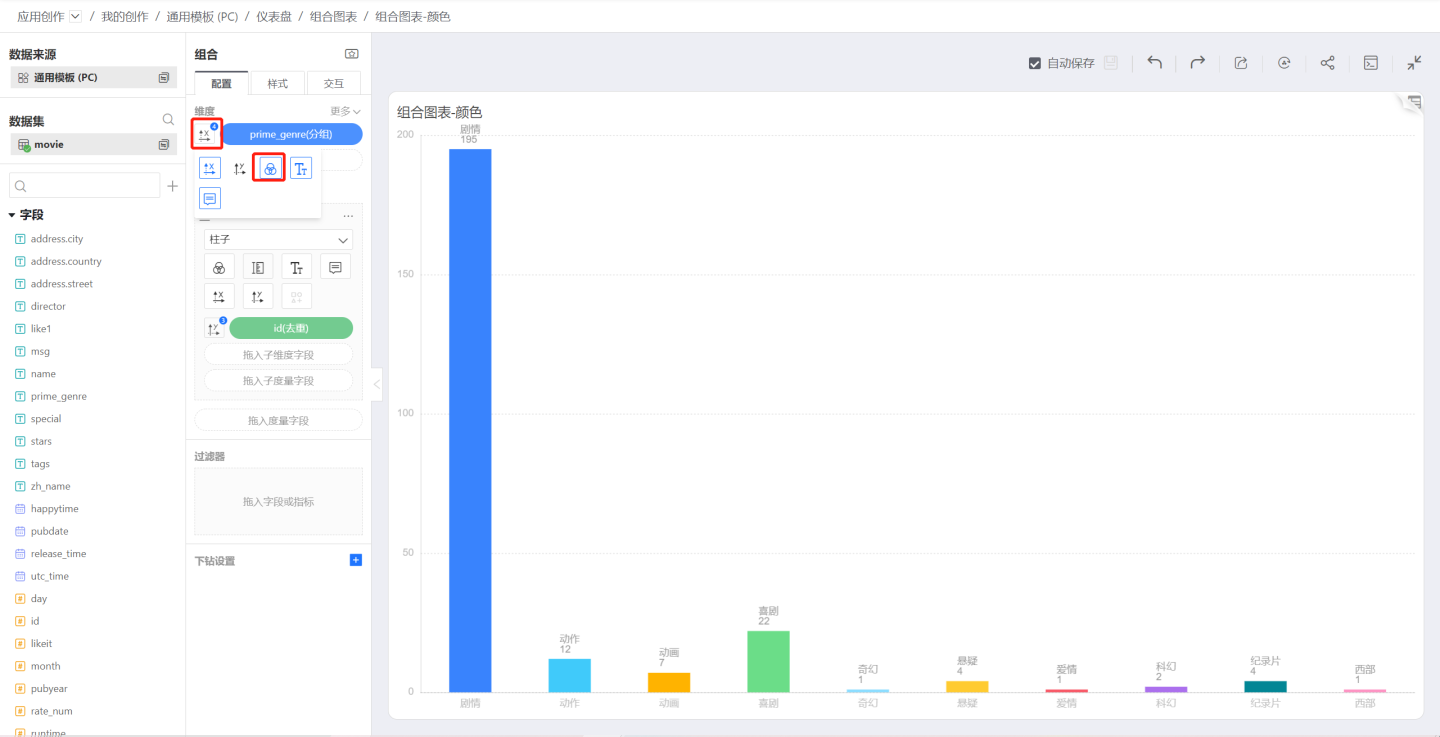
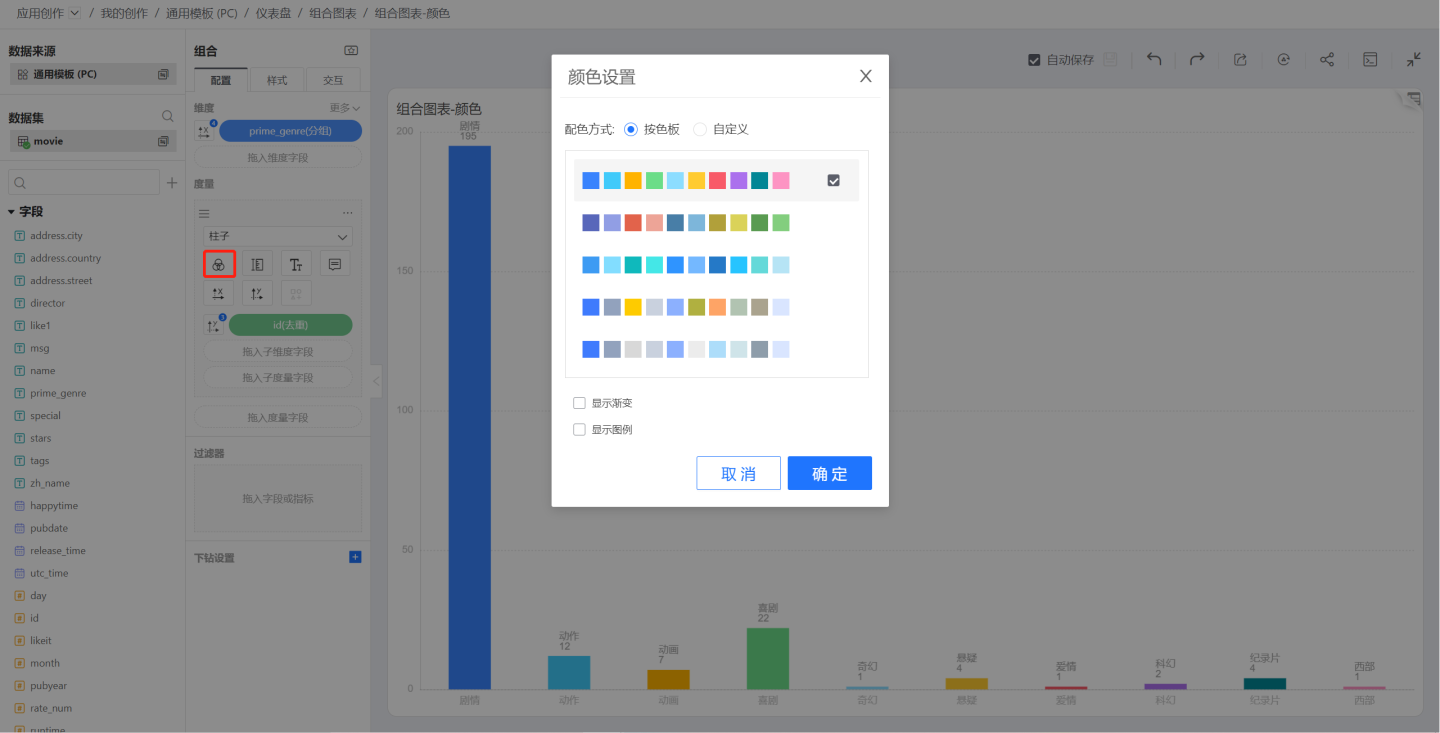
To change the color scheme, click the color icon below the graphic to bring up the discrete color palette.
Additionally, if Show Gradient is selected in the palette, each bar will display a gradient effect.
Continuous Color
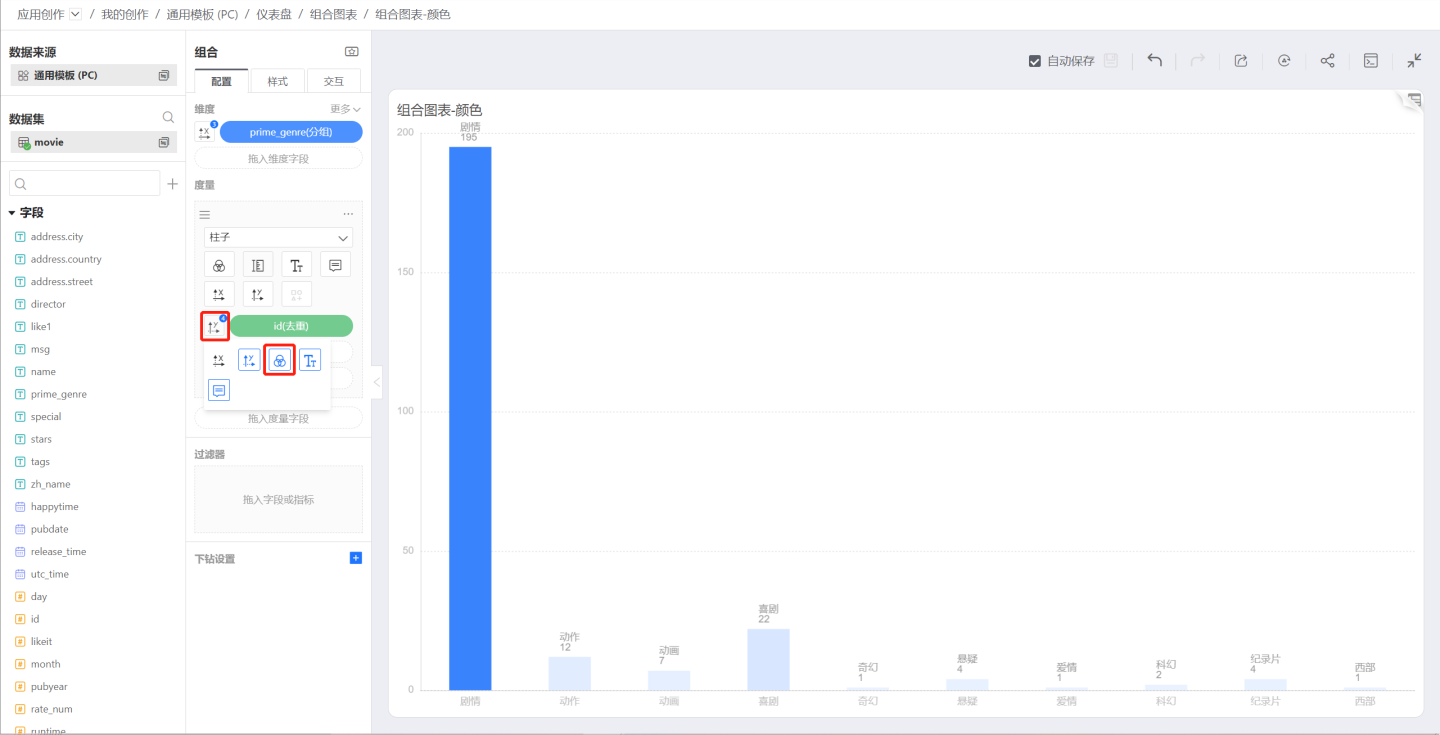
To use a measure to control the color of a chart, click the icon on the left side of the measure to bring up the control menu. Select the color icon, and the chart color will display a continuous gradient based on the measure value.
Size
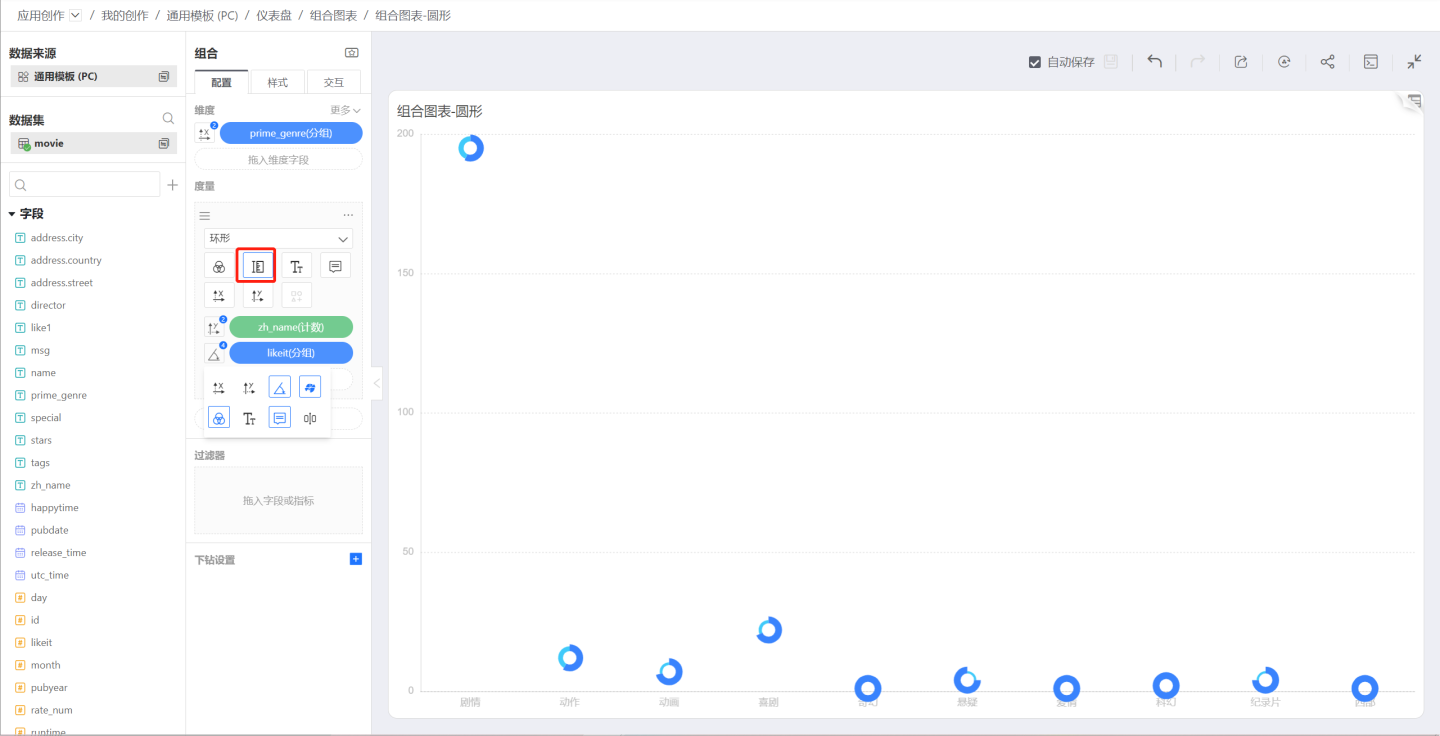
The Size icon can control the size of various graphics, such as the thickness of columns, the size of circles or rings.
Labels
Labels are used to set the display of labels. Additionally, various measures can be dragged in to control the content of the labels.
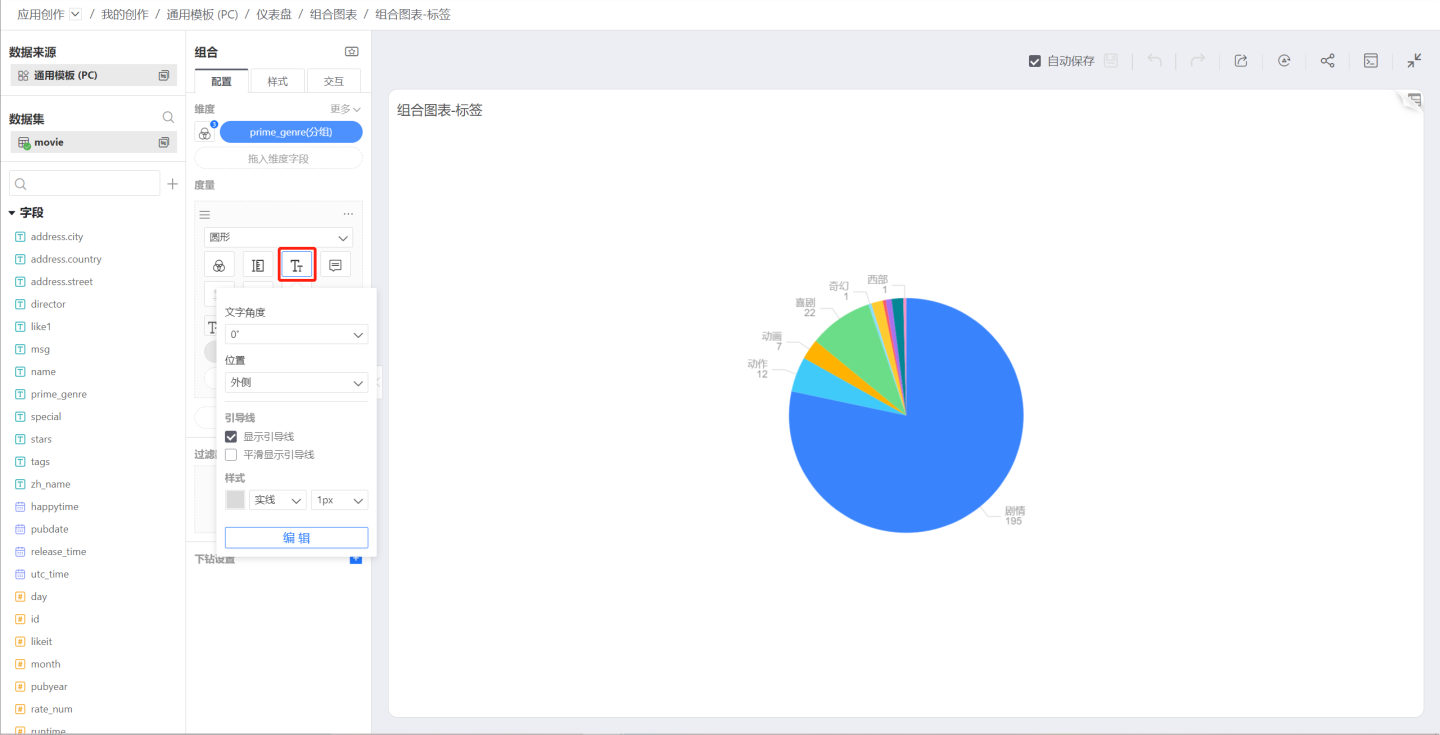
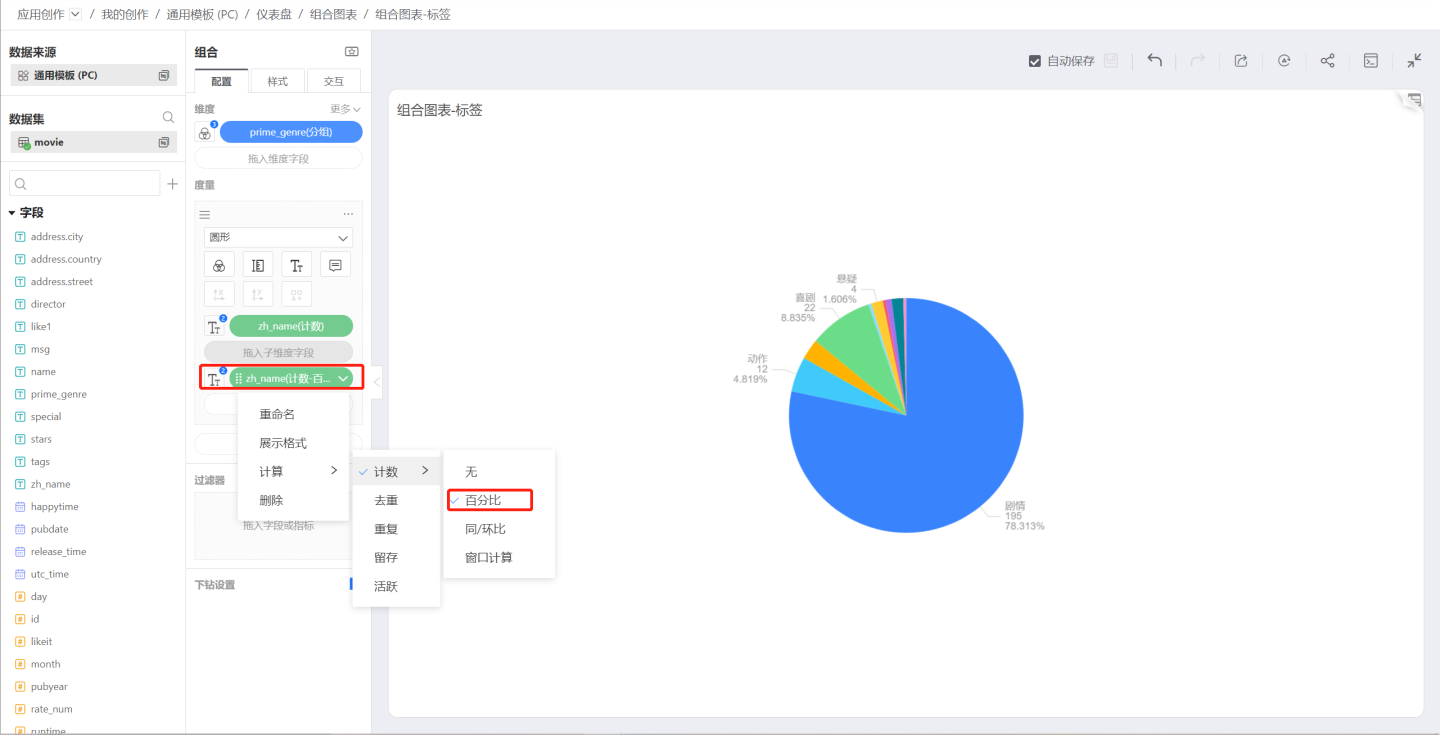
For example, in a pie chart, dragging in a sub-measure where the sub-measure is count -> percentage, the sub-measure does not control the display of the graphic elements, but only controls the labels and tooltips, allowing both the measure and its proportion to be seen simultaneously in the chart.
Tooltip
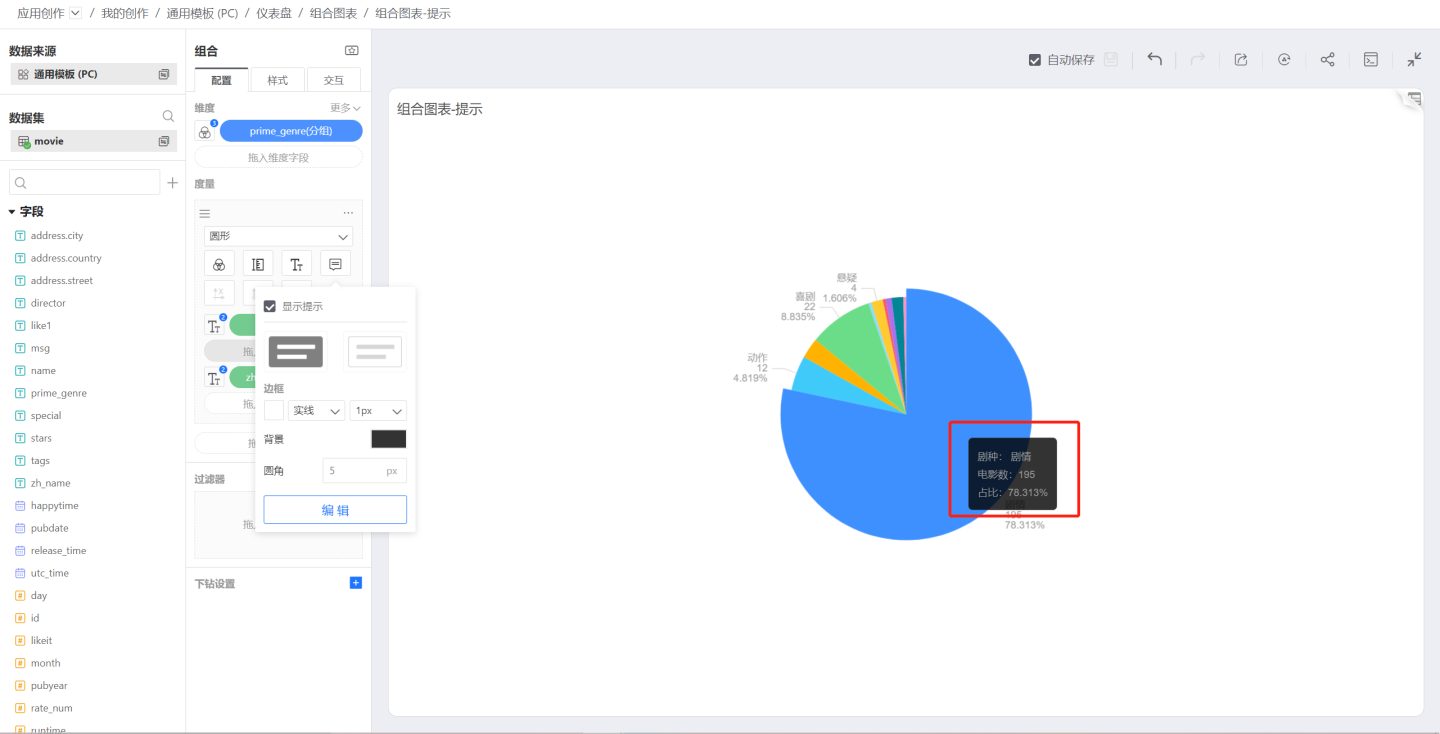
Tooltip is used to control the tooltip displayed when hovering over the chart. Like labels, you can drag sub-measures to add additional tooltips.
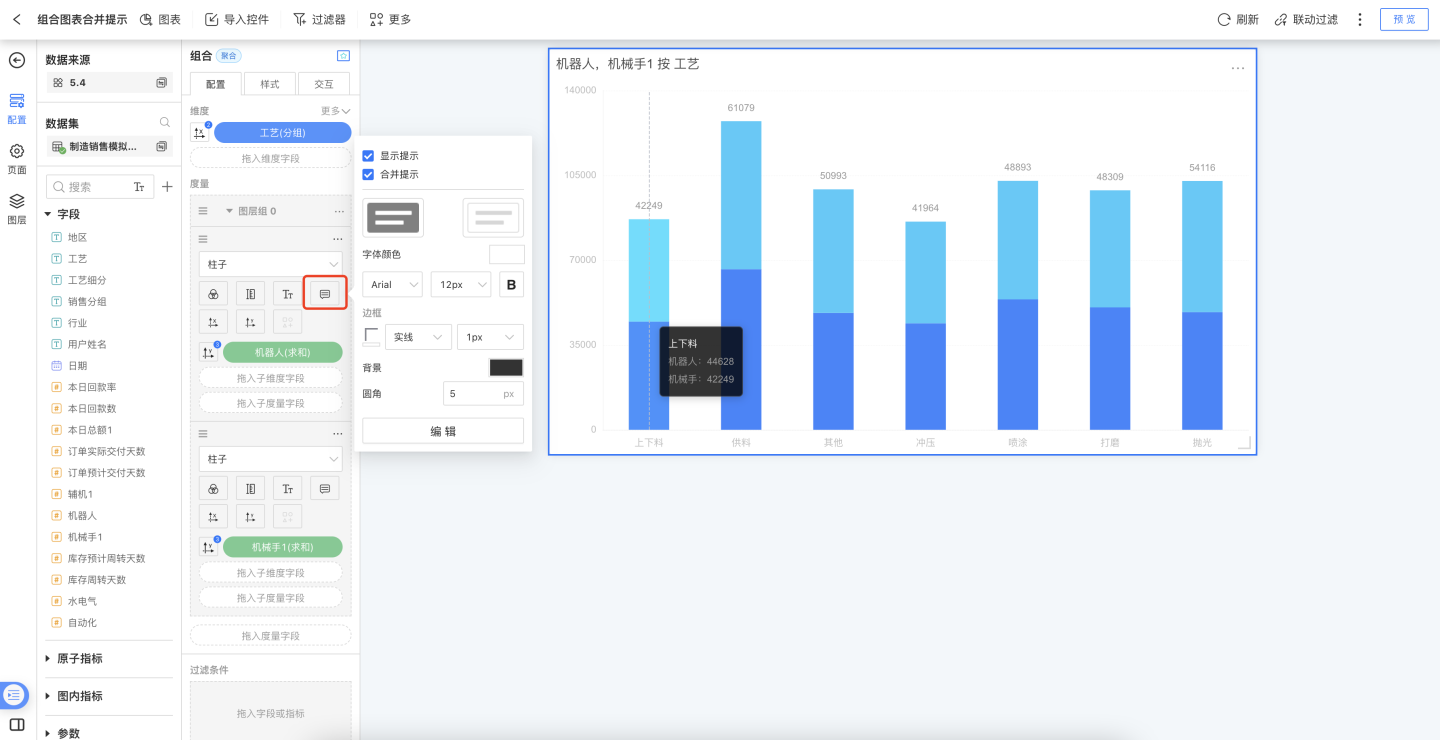
The Tooltip content within the measure group supports merged display. Configuration path: Configuration > Measures within Measure Group > Tooltip > Merge Tooltips.
Note: After checking Merge Tooltips, the tooltips for multiple measures are initialized and merged, and manually edited content before merging is not retained. Unmerging will also initialize the Tooltip content.
Symbols
The Symbol icon is enabled when selecting columns, areas, and shapes in the chart.
Symbols can control the shape of each data point. In the symbol list, custom symbols can be set.
The size of the symbols is controlled by the Size setting mentioned earlier.

Measure Operations
Click on the three-dot menu in the upper right corner of the measure area to pop up the measure menu, including options such as creating a copy, converting to a group, deleting, and adding filters.
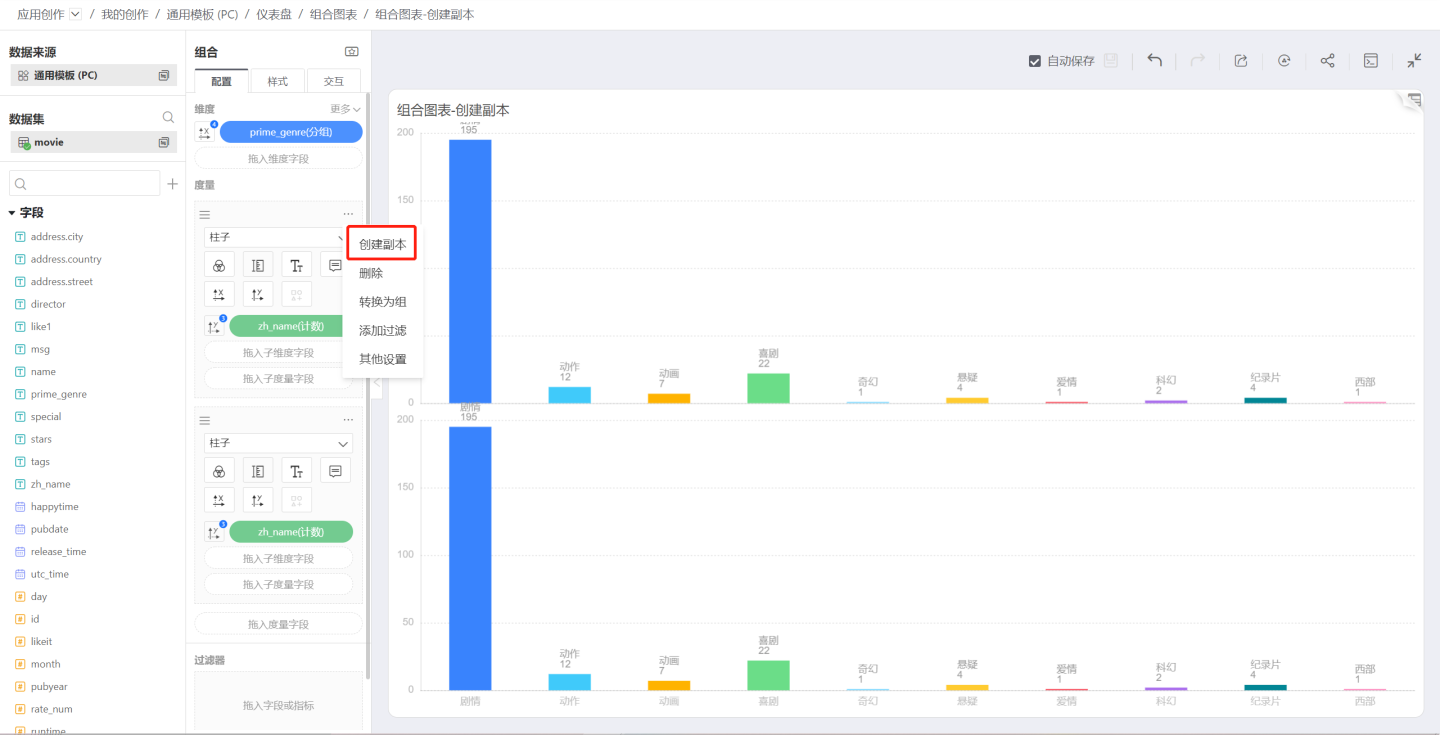
Create a Copy
Create a Copy will create an identical measure that shares the dimension settings with the original measure.
Convert to Group
Click Convert to Group in the measure menu to convert a measure into a group, with the default group name being Layer Group 0.
Join Group
After converting a measure to a group, clicking on the menu of another measure will reveal the option Join Group, allowing you to select the previously created group Layer Group 0. 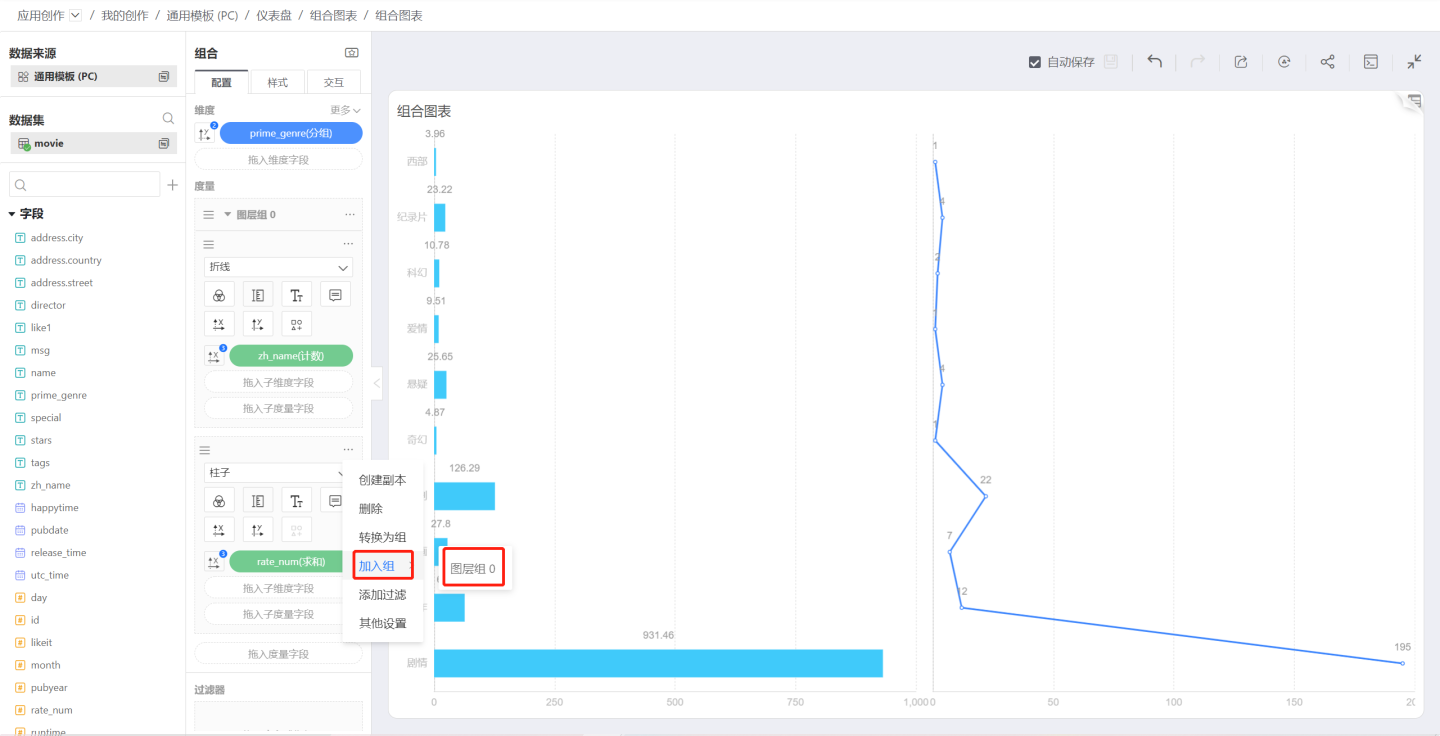
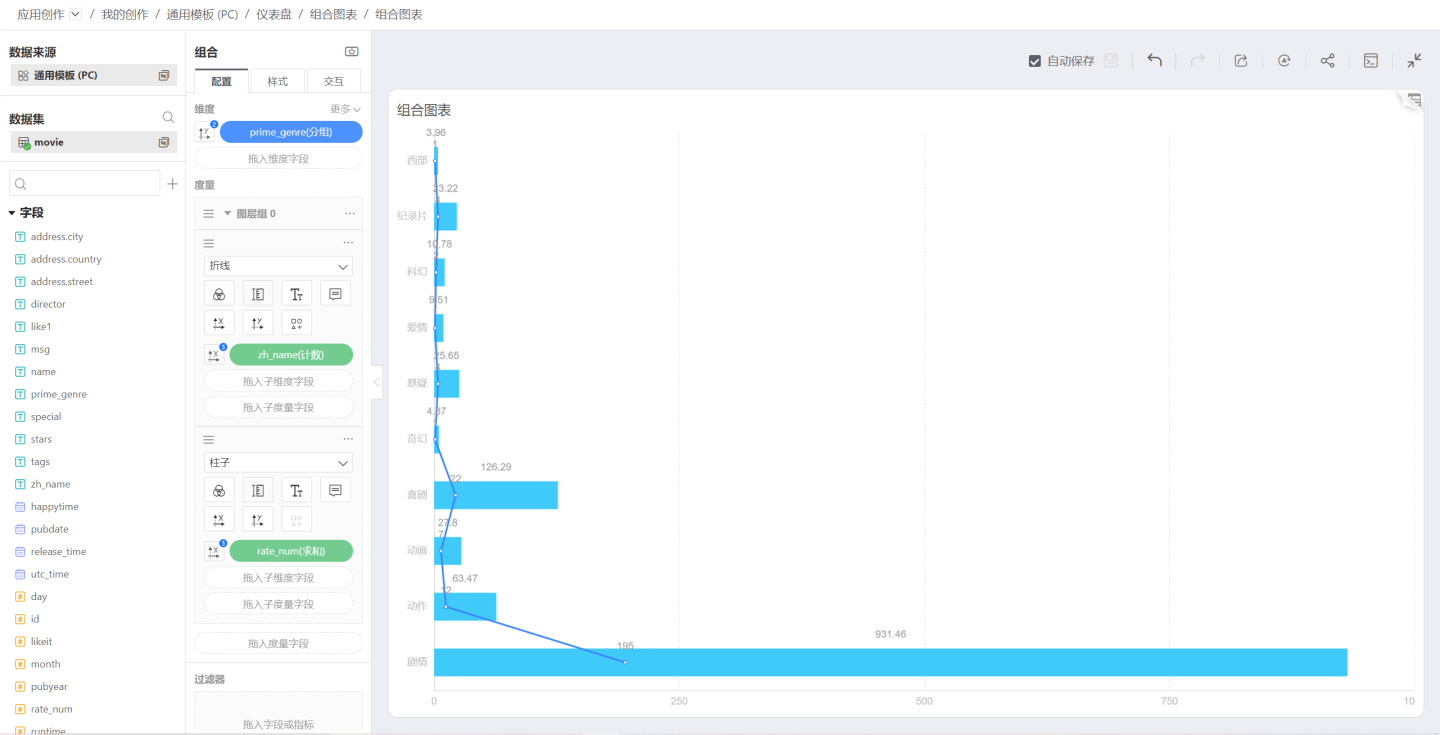
After joining the group.
Exit Group
In the layer group, within the joined measures, click on the three-dot menu to select Exit Group. After exiting the group, the measure becomes an independent measure again, and is plotted separately:
Add Filter
This feature, like other chart measure filtering functions, allows filtering on a single measure.
Metric Sorting
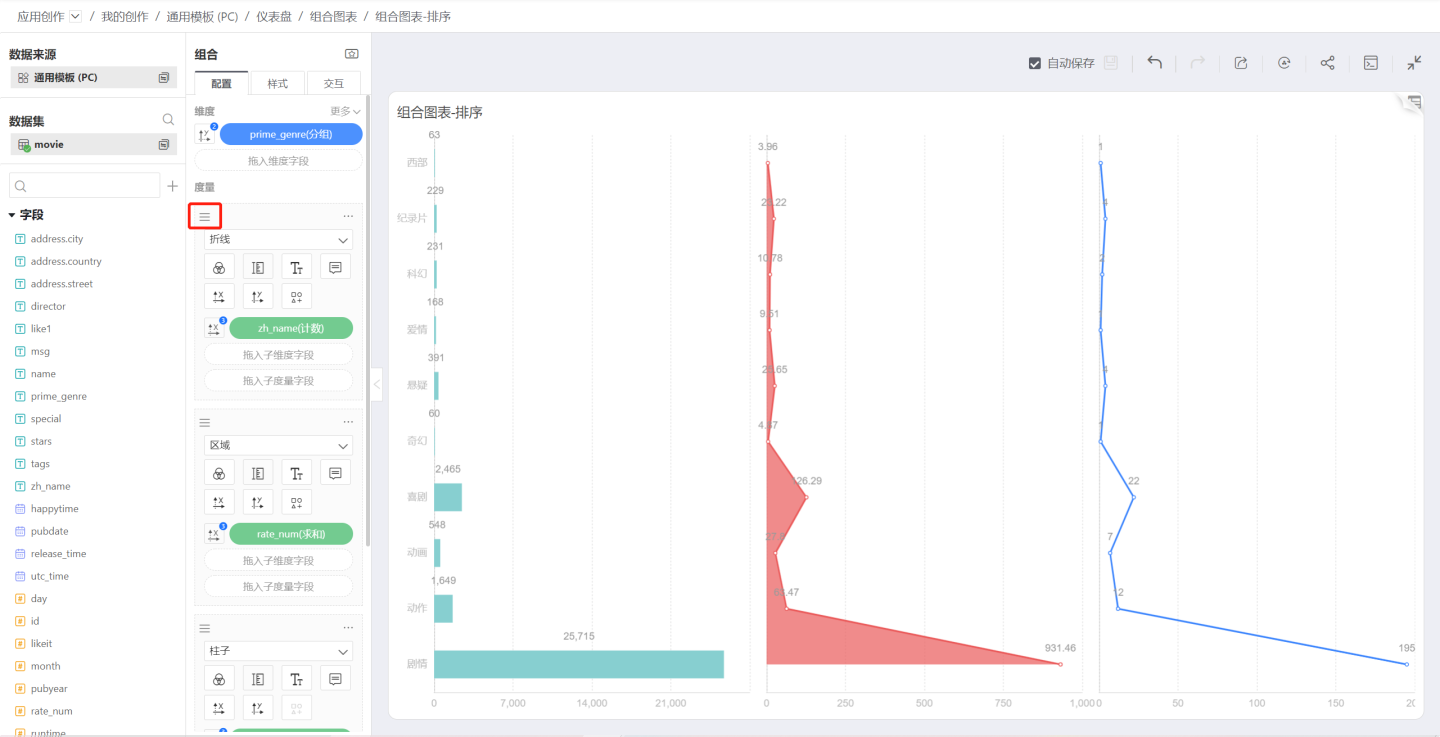
You can drag the sorting icon in the upper left corner of each metric to sort the metric graphics.
Sub-dimensions
Dragging sub-dimensions into measures will divide the measures, generating stacked bar charts, stacked area charts, and other types of charts based on the graphic settings.
Sub-Measures
Dragging a sub-measure into a measure allows you to use the sub-measure to control color, labels, tooltips, or to control the X-axis or Y-axis. However, in this case, other measures within the measure cannot control the X-axis or Y-axis. This means that, whether it is a measure or a sub-measure, only one measure can control the chart output.
Layer Group Menu
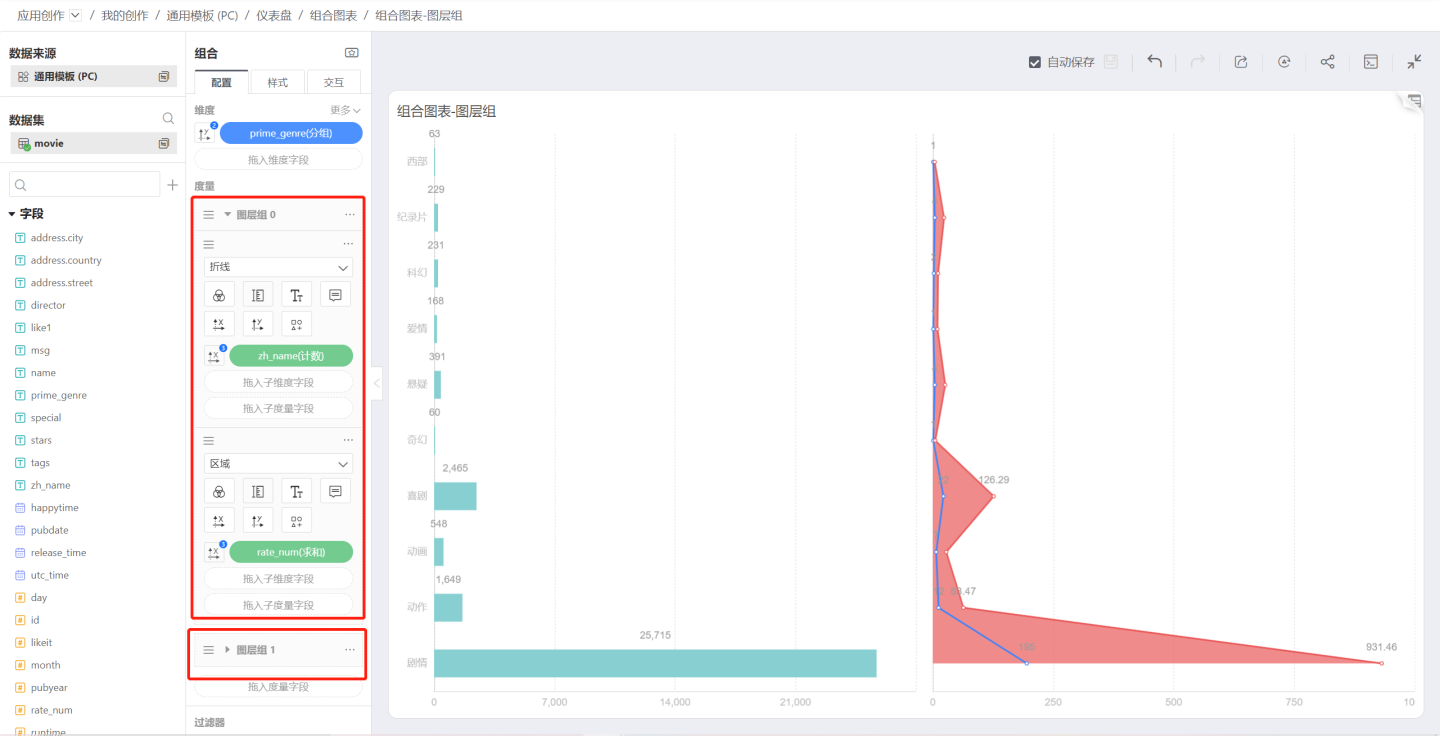
Modify Name
You can change the layer group name to a more user-friendly name.
Create a Copy
Create a layer group that is exactly the same as the original layer group.
Merge Mode
Click on the three-dot menu of the layer group to pop up the Merge Mode menu, which controls the merge mode between the metric graphics within the group.
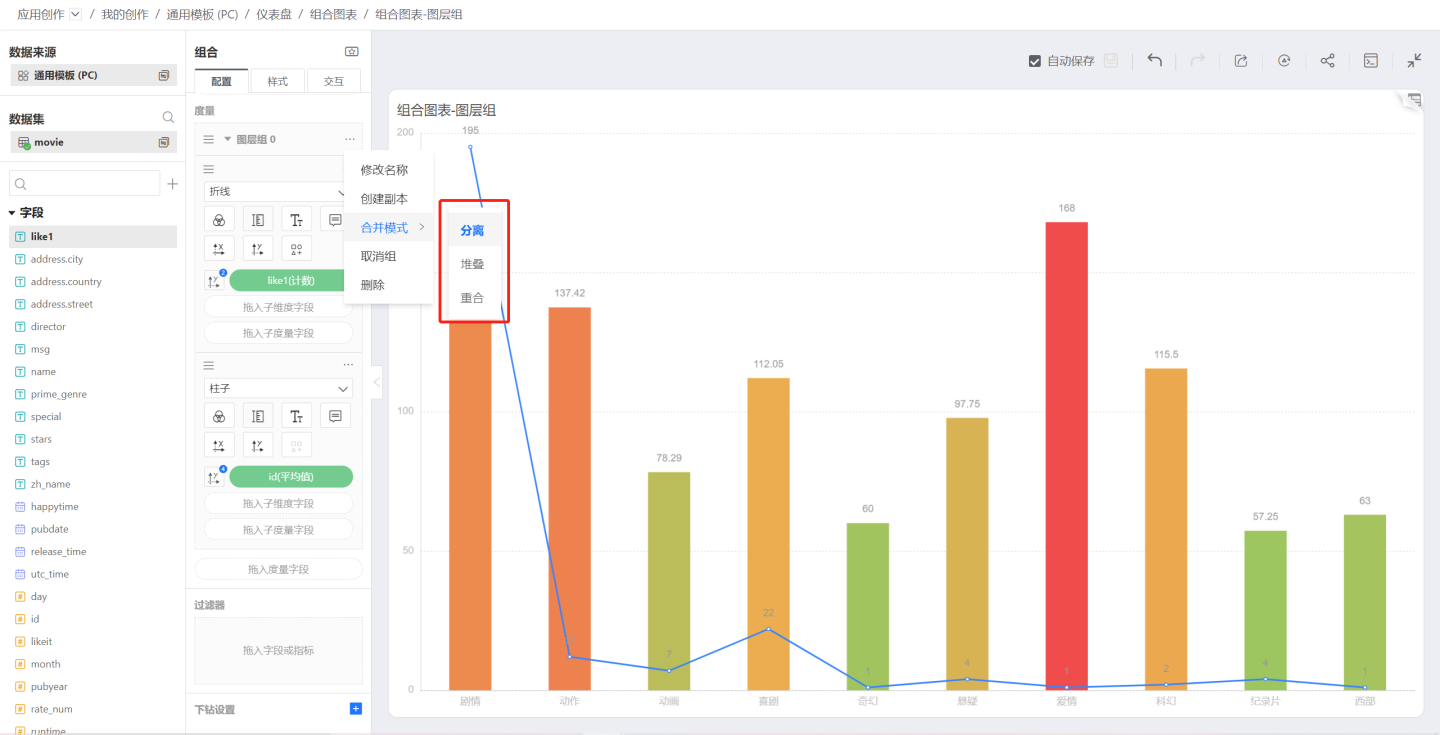
Separation
After joining a group, the default merge mode is Separation. After merging, the two bar charts become a clustered bar chart: 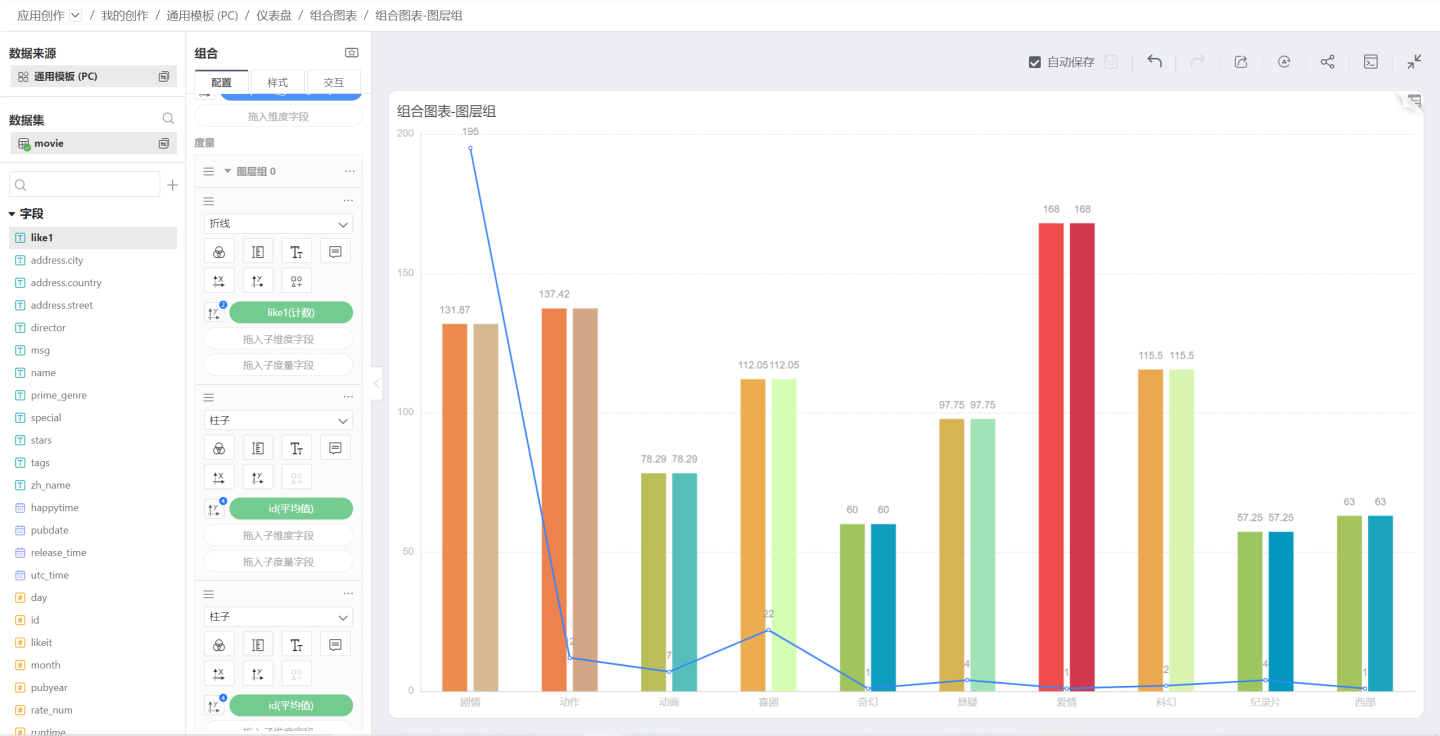
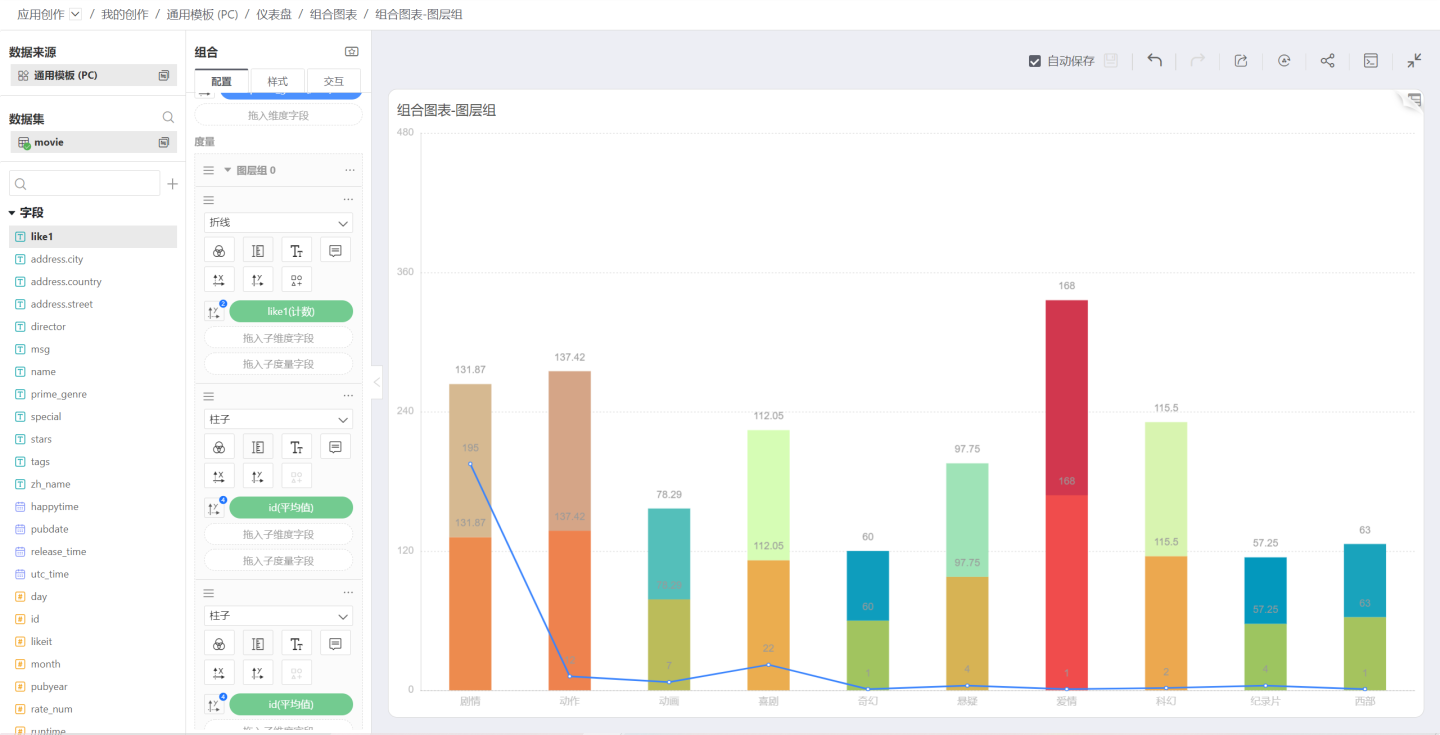
Stacked
When the merge mode is selected as Stacked, the two bar charts merge into a stacked bar chart. At this point, it is necessary to disable dimension control over color and have each measure control its own color:
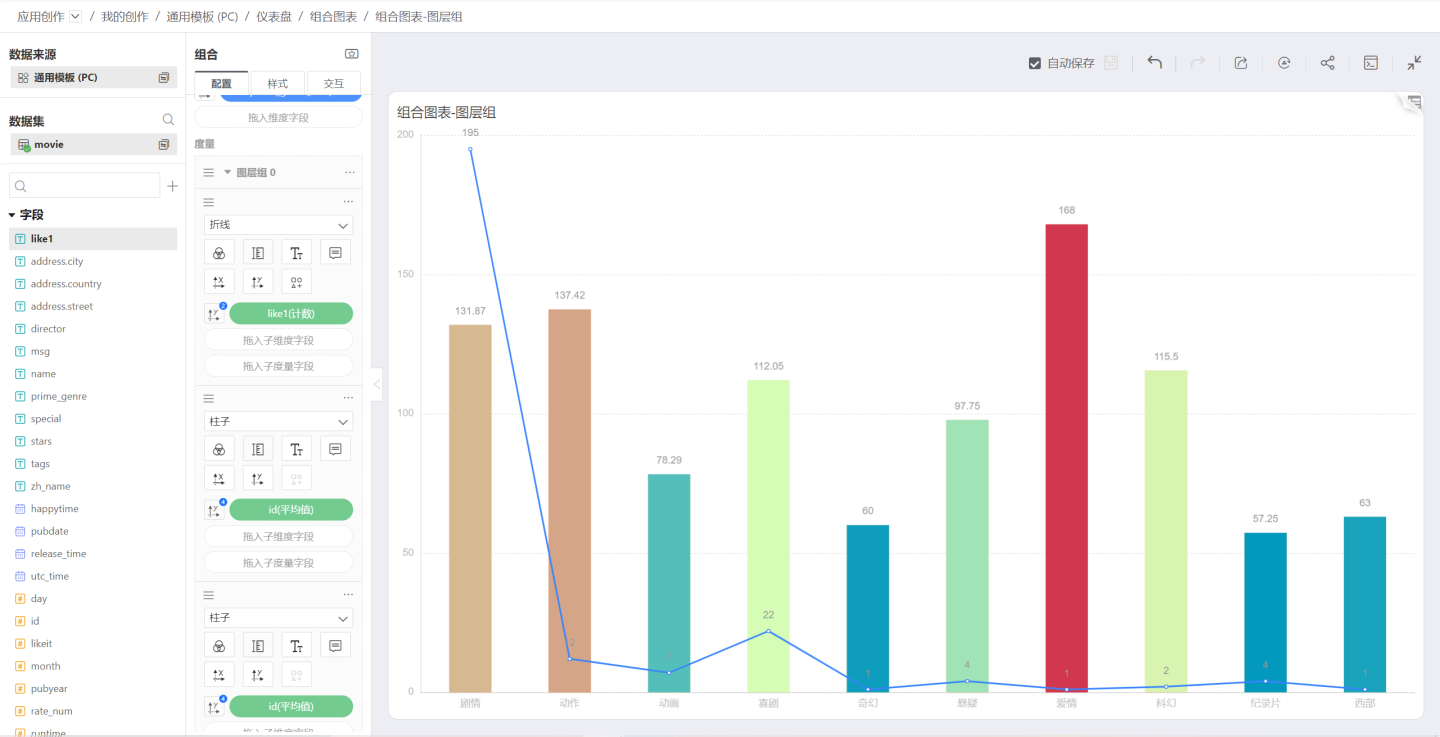
Overlap
When the merge mode is selected as Overlap, the measures will overlap with each other. Below is the effect of two area charts overlapping:
Stack Settings
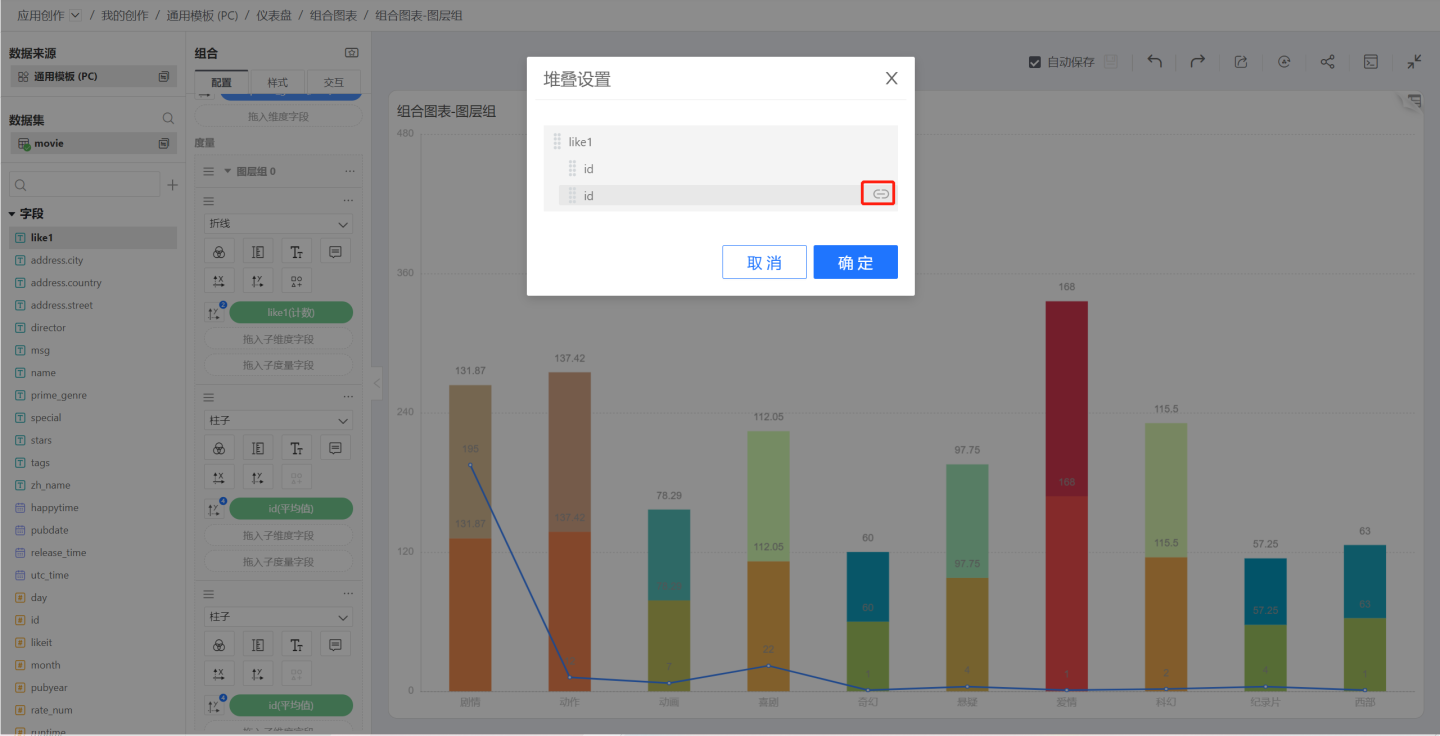
When the merge mode between measures within a layer group is Stack, the Stack Settings will appear in the layer group menu. The stack settings control the stacking relationship between each layer. For example, if there are 5 bars, the first can be stacked on the second, and the third and fourth can be stacked on the fifth.
Clicking the Stack Settings menu of the layer group will pop up the Stack Settings window. Clicking the indent icon will control whether to stack.
In the figure below, the bars of two IDs are stacked.
Join Group
If there are multiple layer groups, the Join Group option will appear in the layer group menu. By selecting another listed group, you can add all the contents of the current group to the selected layer group.
Ungroup
You can click the three-dot menu of the layer group and select Ungroup. The entire group will then be disbanded, and all measures will revert to independent measures, with the Merge Mode no longer in effect.
Delete
Delete all selected group contents. After deletion, if you want to restore, you can click the back button on the chart.
Layer Group Sorting
You can drag the sorting icon in the upper left corner of the layer group to sort between layer groups.