Welcome to HENGSHI SENSE Intelligent Analysis Platform
HENGSHI SENSE is a next-generation intelligent BI analysis platform for the AI era!
To address current data challenges, we have tailored this standardized enterprise-grade tool for data-driven organizations. By integrating advanced features such as ChatBI, metric management, data integration, complex reporting, and multi-tenant collaborative publishing on top of agile BI, we empower business users to explore data flexibly and make data insights accessible across the organization with a single click.
- Compatible with various mainstream LLMs, providing intelligent data querying capabilities through ChatBI, which can be integrated and invoked within various business applications
- Offers centralized metric management capabilities, establishing a metric system and providing a standard language for metric definitions: HQL — Hengshi Query Language
- Supports integration with various mainstream data platforms, including databases, data warehouses, lakehouse platforms, big data platforms, NoSQL databases, Excel files, custom APIs, and more
- Features a high-performance data warehouse engine design, compatible with platforms using MPP architectures such as Greenplum and Apache Doris, providing data integration capabilities
- Built-in H5-based data visualization engine, supporting multi-screen adaptation, customizable visual charts, and JS extensions
- Comprehensive enterprise-grade platform permission control and sharing mechanisms, supporting mainstream SSO protocols
- Headless architecture design, supporting Restful API and OEM

Core Concepts of the Product
Building an enterprise-level BI platform requires a wide range of skills: from low-level architecture aspects like data storage, data synchronization, and computational performance optimization mechanisms; to presentation-layer aspects like visual chart rendering, dashboard layout, and responsiveness; to IT governance aspects like permission systems and integration capabilities; to business implementation aspects like data modeling principles; and to user experience aspects like interaction design. As a result, the development of a BI product is often a highly resource-intensive endeavor.
In contrast, the core concepts of a BI product are relatively few. The complexity of the product is built upon the combination of these core concepts. Below, we outline the basic concepts of the product. These concepts are embedded throughout our entire product and ultimately manifest as its functional features. We hope that the HENGSHI SENSE platform can become a powerful tool for professionals across various industries to conduct business analysis—simple, stable, and easy to use.
The Beginning of Everything — Data Connection|Data Connection
Data connection is oriented towards physical data sources and serves as the bridge between BI work and data warehouse tasks. Only after establishing a data connection can datasets be created.
In today's world, where the scope of analyzable data has greatly expanded, various specialized data engines and data warehouse technologies are flourishing. In most cases, BI work is positioned after the preparation and setup of the data warehouse. The combination of data warehouses and BI for obtaining data insights remains the most proven and reasonable path, and the rise of AI large model technology has yet to disrupt this status quo.
Unit of Analysis — Dataset|DataSet
A dataset is a virtual two-dimensional table, an abstraction of tables and views in a database, and serves as the starting point for analytical work.
This definition is an abstract representation of all structured data in the form of a two-dimensional table. The purpose of this definition is to eliminate the need to worry about which specific data source the data physically comes from. Subsequent statistical analysis and processing focus on operations on rows and columns of data. Aggregation calculations are concentrated on row traversal, while all filtering primarily uses columns as anchors.
The Language of Visualization — Data Charts|Chart
A chart is the smallest unit of data visualization. In HENGSHI SENSE, an argument based on data is presented through a chart.
The underlying principle of "a picture is worth a thousand words" lies in the fact that the human brain processes graphical information hundreds of times faster than textual information. One of the primary tasks in BI is to create the most suitable visual charts for managing datasets. The purpose of data visualization is not to be flashy but to efficiently convey information. The most classic charts are often the most useful, such as line charts, bar charts, and pie charts, which can solve many problems. Heatmaps and bubble charts are also very useful.
KPI is another frequently used form, which can highlight the precise value of a key metric. It is often combined with visual elements like line charts in a dashboard.
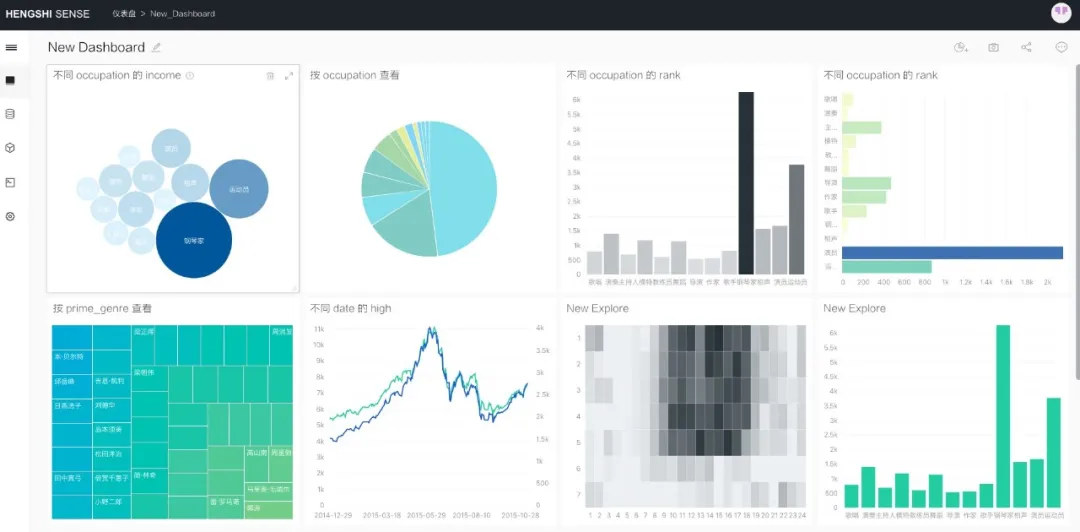
At Your Fingertips — Dashboard
A dashboard is a composite layout of charts, filters, and text, designed to present a specific theme and narrate a user story.
The dashboard is one of the primary outputs of BI engineering and serves as the central hub connecting different roles. For a BI project to be implemented, it is essential to clarify two roles: who is responsible for everything from data modeling to dashboard creation, and who will consume and view the dashboard.
In the HENGSHI SENSE product, there is another related concept called Application. We aim to package a set of dashboards to form a more comprehensive analytical solution and provide more usage scenarios, such as data portals.
A data screen is a special presentation form of a dashboard, primarily used in scenarios focused on visual effects, such as reporting and exhibitions.
The Core of BI — Data Model|Model
A data model logically defines the relationships between datasets, with Union and Join being the two most fundamental types of relationships.
The ultimate purpose of defining a data model is flexibility, which is one of the most critical capabilities of a BI platform. Businesses require statistical analysis of detailed data across multiple dimensions and calculations at different aggregation levels, striking the best balance between responsiveness and flexibility. Support from the data model can minimize the scope of computations before actual data queries occur, reducing data duplication and transportation at the physical layer. As the performance of data engines continues to improve, the importance of modeling has grown significantly. Without robust modeling capabilities, it would be akin to wasting the innovative achievements of various data engine platforms developed during the era of big data. The current mainstream trend in BI is clear: embracing stronger real-time data processing capabilities and leaning towards flexibility in the trade-offs of overall architecture!
Business-Friendly Language — Measures & Metrics
The capability of metrics is essentially an extension of data modeling, an enhancement and expansion of datasets, and a core threshold in BI product modeling.
Metrics are the most important concept in HENGSHI SENSE, divided into two categories: data modeling level and business level. In the product, they are distinguished as atomic metrics and business metrics, with the more fundamental capability lying in atomic metrics. Atomic metrics define expressions for a dataset based on specific statistical measures, such as a flexibly defined year-over-year growth rate under certain conditions or a dynamic expression composed of field values and functions. Atomic metrics significantly expand the operational scope when performing BI analysis actions on datasets. This capability relies on a rich library of functions, with HENGSHI providing hundreds of advanced functions to support it.
Business metrics are designed for business operation experts and represent specific business-caliber calculation results after dimensions and calculation expressions are determined. The management, analysis, and viewing of business metrics, as well as the ability to manage metric systems, are new functional modules that enable BI tools to move further from IT technical departments into the hands of business users.
Dynamic Representation 1 — Filter
Filters bring dynamic capabilities to static dashboards, enabling insights by shifting perspectives.
The amount of information a static page can carry is ultimately limited. Filters in dashboards allow for dynamically switching the observation scope. Since data review actions are user-oriented, filters need to offer a variety of types and presentation methods. By filtering content, there are text, time, and numeric filters; by presentation, there are input controls, selection controls, tiled controls, slider controls, tree controls, and calendar controls; by scope, there are local filters, global application filters, and dataset filters. Filters require extensive interactive capabilities, enabling dashboards to achieve a personalized effect akin to "a thousand faces for a thousand people." This functionality highlights the high level of functional complexity in data tool products.
Dynamic Representation 2 — Parameters
Parameters essentially represent a dynamic switch of underlying data, explicitly integrating this switching capability into the interactive operations of dashboards.
Parameters can be extensively used in dashboards in the form of controls, enhancing the interactivity of charts. They are categorized into local parameter controls and global application parameter controls. As an important tool for flexibility, parameters are also frequently used in scenarios such as metric calculation expressions, permission control, and dataset creation.
Similar to filters, parameters embody the dynamic and complex nature of data analysis tasks. As a fundamental capability, when combined with the semantics of metric expressions, they provide powerful business logic expression capabilities.
Analysis Performance — Engine|Engine
Data conclusions are derived from data computation, which requires a physical layer for efficient data querying and aggregation. This layer is called the engine.
The default engine is an external high-performance data warehouse. However, due to the pursuit of higher responsiveness, modern BI tools often adopt in-memory computing engines to achieve a better response experience. With the rapid development of data warehouse platforms today, in-memory computing is no longer a mandatory choice. This is a judgment of the times and a significant simplification in architecture.
In the analysis pipeline, the engine is an indispensable component. Different enterprises have varying approaches to building and planning their data platforms. Therefore, the HENGSHI product architecture provides a ready-to-use engine to meet general computational needs, which we call the built-in engine. Whether to use the HENGSHI built-in engine or a customer-built one is entirely up to the implementation scenario—both options are viable.
Business Encapsulation — Application | App
Starting from version 2.0, we have encapsulated the Dashboard | Dashboard and Dataset | Dataset into the Application | App, allowing users to focus more on the current business scenario during exploration and fully utilize the functionalities provided by the Dataset and Dashboard.
Instant Presentation, Instant Synchronization - Publish
We have integrated the publishing feature as a fundamental capability into the App. Users can utilize the publishing feature to share their data analysis work. Since HENGSHI SENSE is built on H5 page characteristics, the shared results retain their interactivity and can adapt to different devices where the information is accessed. Additionally, we provide a refined permission control system to meet the management requirements of large organizations.
Publishing is crucial for internal collaboration within an organization. It is essential to minimize the cost of understanding the current business situation within the organization, enabling data consumers to receive immediate feedback and making data visualization results accessible with a single click. Efficiency optimization in these high-frequency operations will significantly enhance the flow of information within an organization. The longer users collaborate around this platform, the higher the organization's data efficiency will become, creating a virtuous cycle that ultimately fosters the formation of a data-driven team.