Layered Map
As the name suggests, a layered map displays geographic information in multiple layers, each with a complete meaning. These layers are then combined into a map chart to provide a comprehensive display and analysis of geographic-related information.
Layered maps support layers such as Area Map, Heat Map, Scatter Plot, Flow Map, Trajectory Map, and Label Map. It can be composed of a single layer or multiple layers superimposed. Below, we will detail the usage scenarios, configuration information, and style information of each layer. For map creation, please refer to Layered Map Creation Process.
Area Map
An area map fills the geographical regions on a map and displays the data information of those regions. For example, if a user wants to view the sales volume in different regions, they can use an area map for display.
The following configuration requirements must be met when creating an area map.
- Basic Configuration Requirements An area map requires one dimension field, one measure field, and several information fields.
- The dimension must be a geographic role field, so first convert the field to a geographic role.
- The measure is the related business information displayed on the map.
- Information fields will not be displayed on the map but will be shown in the tooltip.
- Style The area map supports settings for color, opacity, base color, labels, and tooltips.
The following is an example of an area map showing the sales situation across different regions of the country. 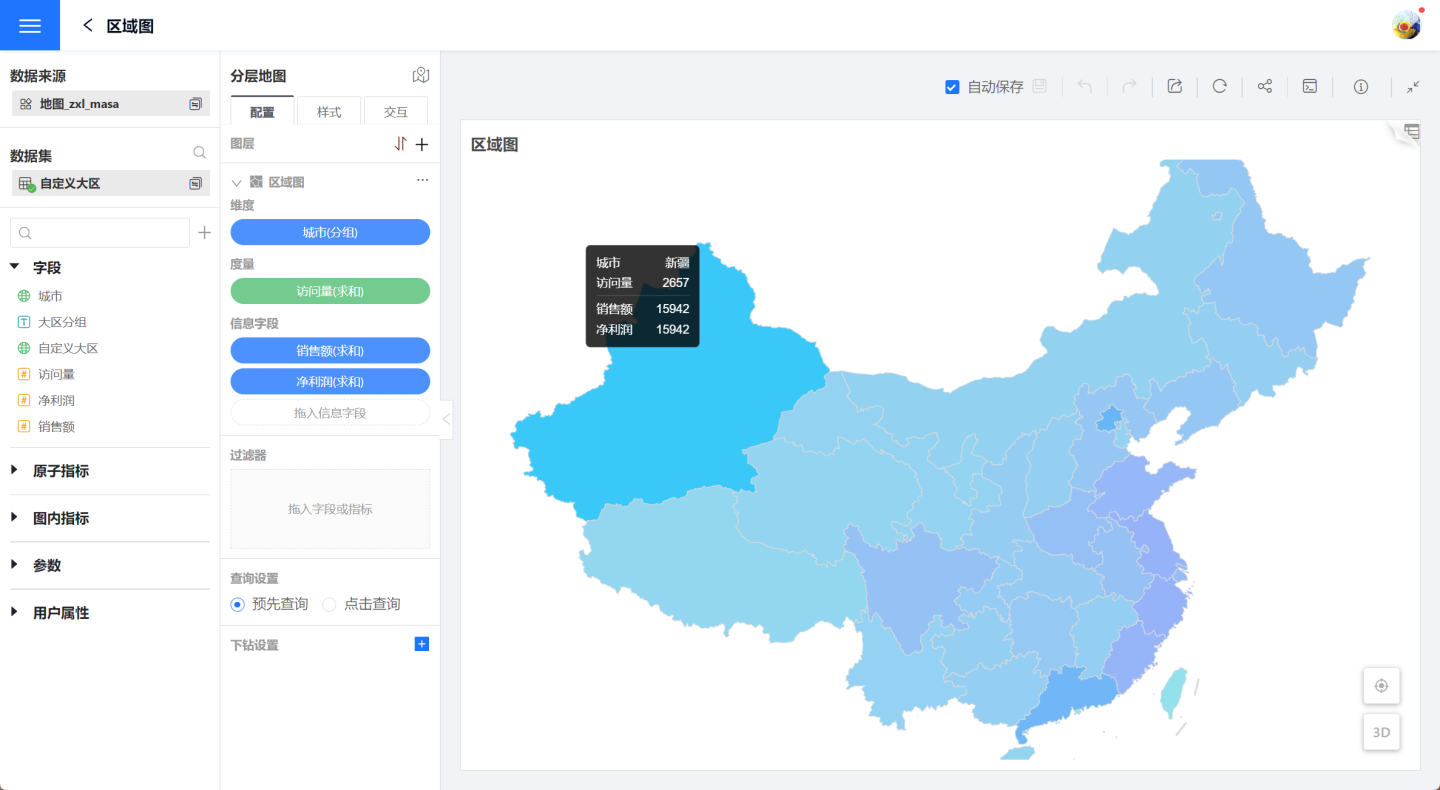
Heatmap
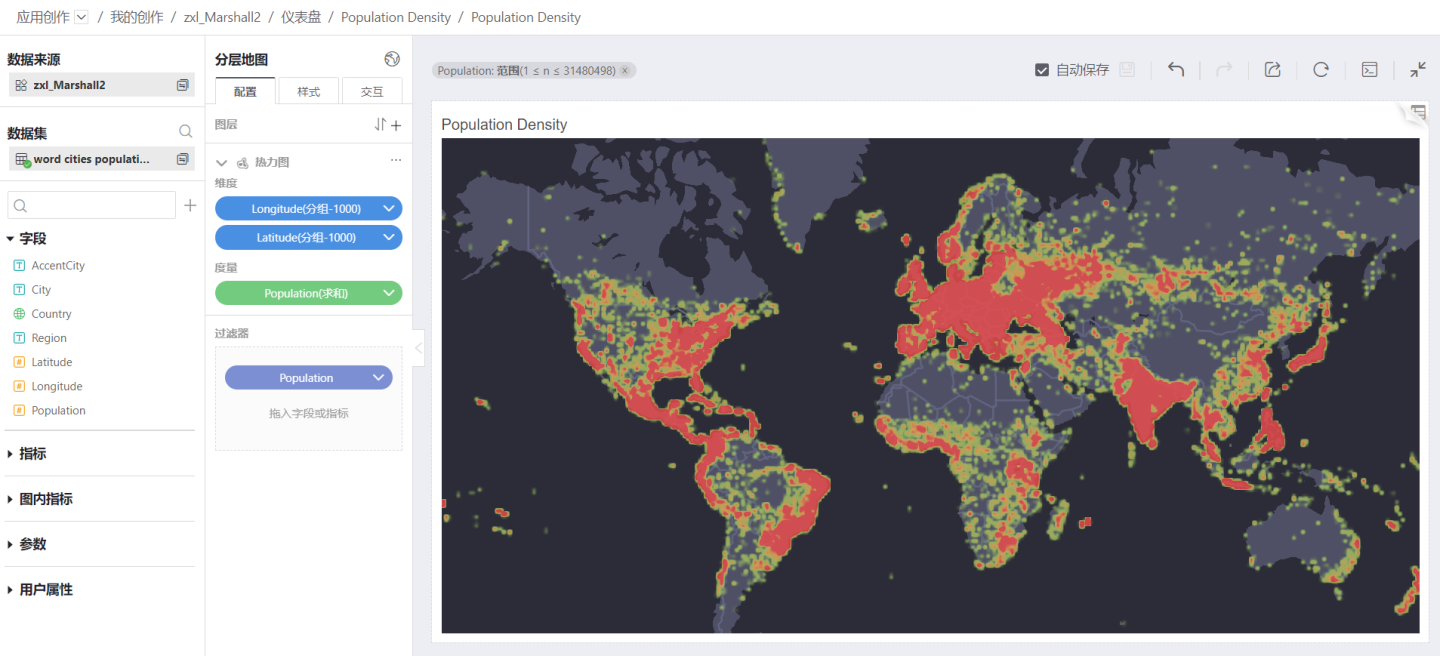
When displaying trends in a visual dataset on a map, a heatmap can be used to illustrate aspects such as population density, popular holiday destinations, or cities with a high concentration of employee business trips.
To create a heatmap, the following configuration requirements must be met.
- Basic Configuration Requirements A heatmap requires the configuration of one dimension and one measure. The dimension supports two positioning modes: geographic mode and latitude-longitude mode. When using geographic mode, the field must be converted using a Geographic Role.
- Style Settings In the style settings, you can adjust the layer color, opacity, and radius range.
The following image is an example of a heatmap, showing the population density around the world.
Scatter Plot
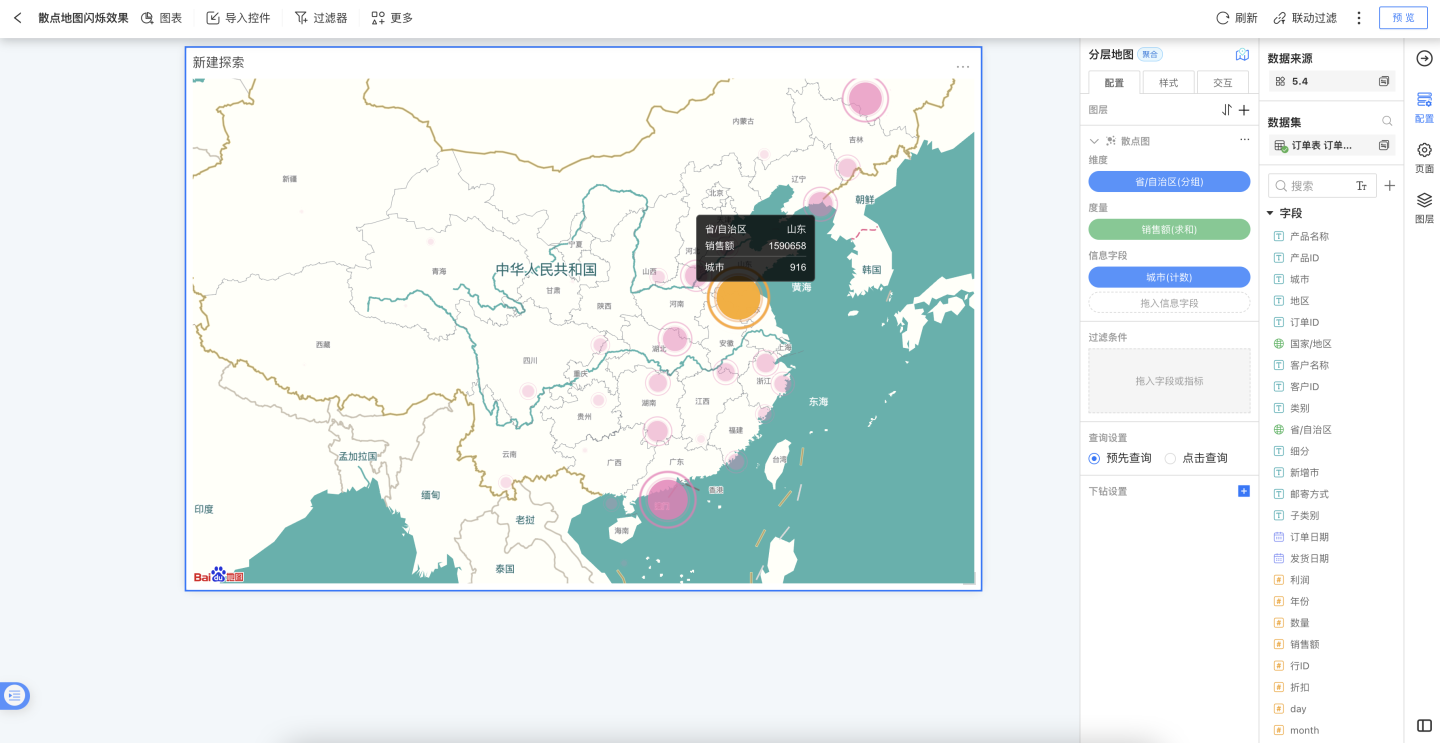
Scatter plots are used to describe the distribution of things in geographical areas, such as the distribution of coal mines nationwide, the distribution of animals nationwide, the distribution of freshwater, etc.
The following configuration requirements must be met when creating a scatter plot.
- Basic Configuration Requirements A scatter plot requires one dimension field, one measure field, and several information fields.
- Dimensions support two positioning modes: geographic mode and latitude-longitude mode. When using geographic mode, the field needs to be converted to a Geographic Role.
- Measures are the business information displayed on the map.
- Information fields are not displayed on the map but are shown in the tooltips.
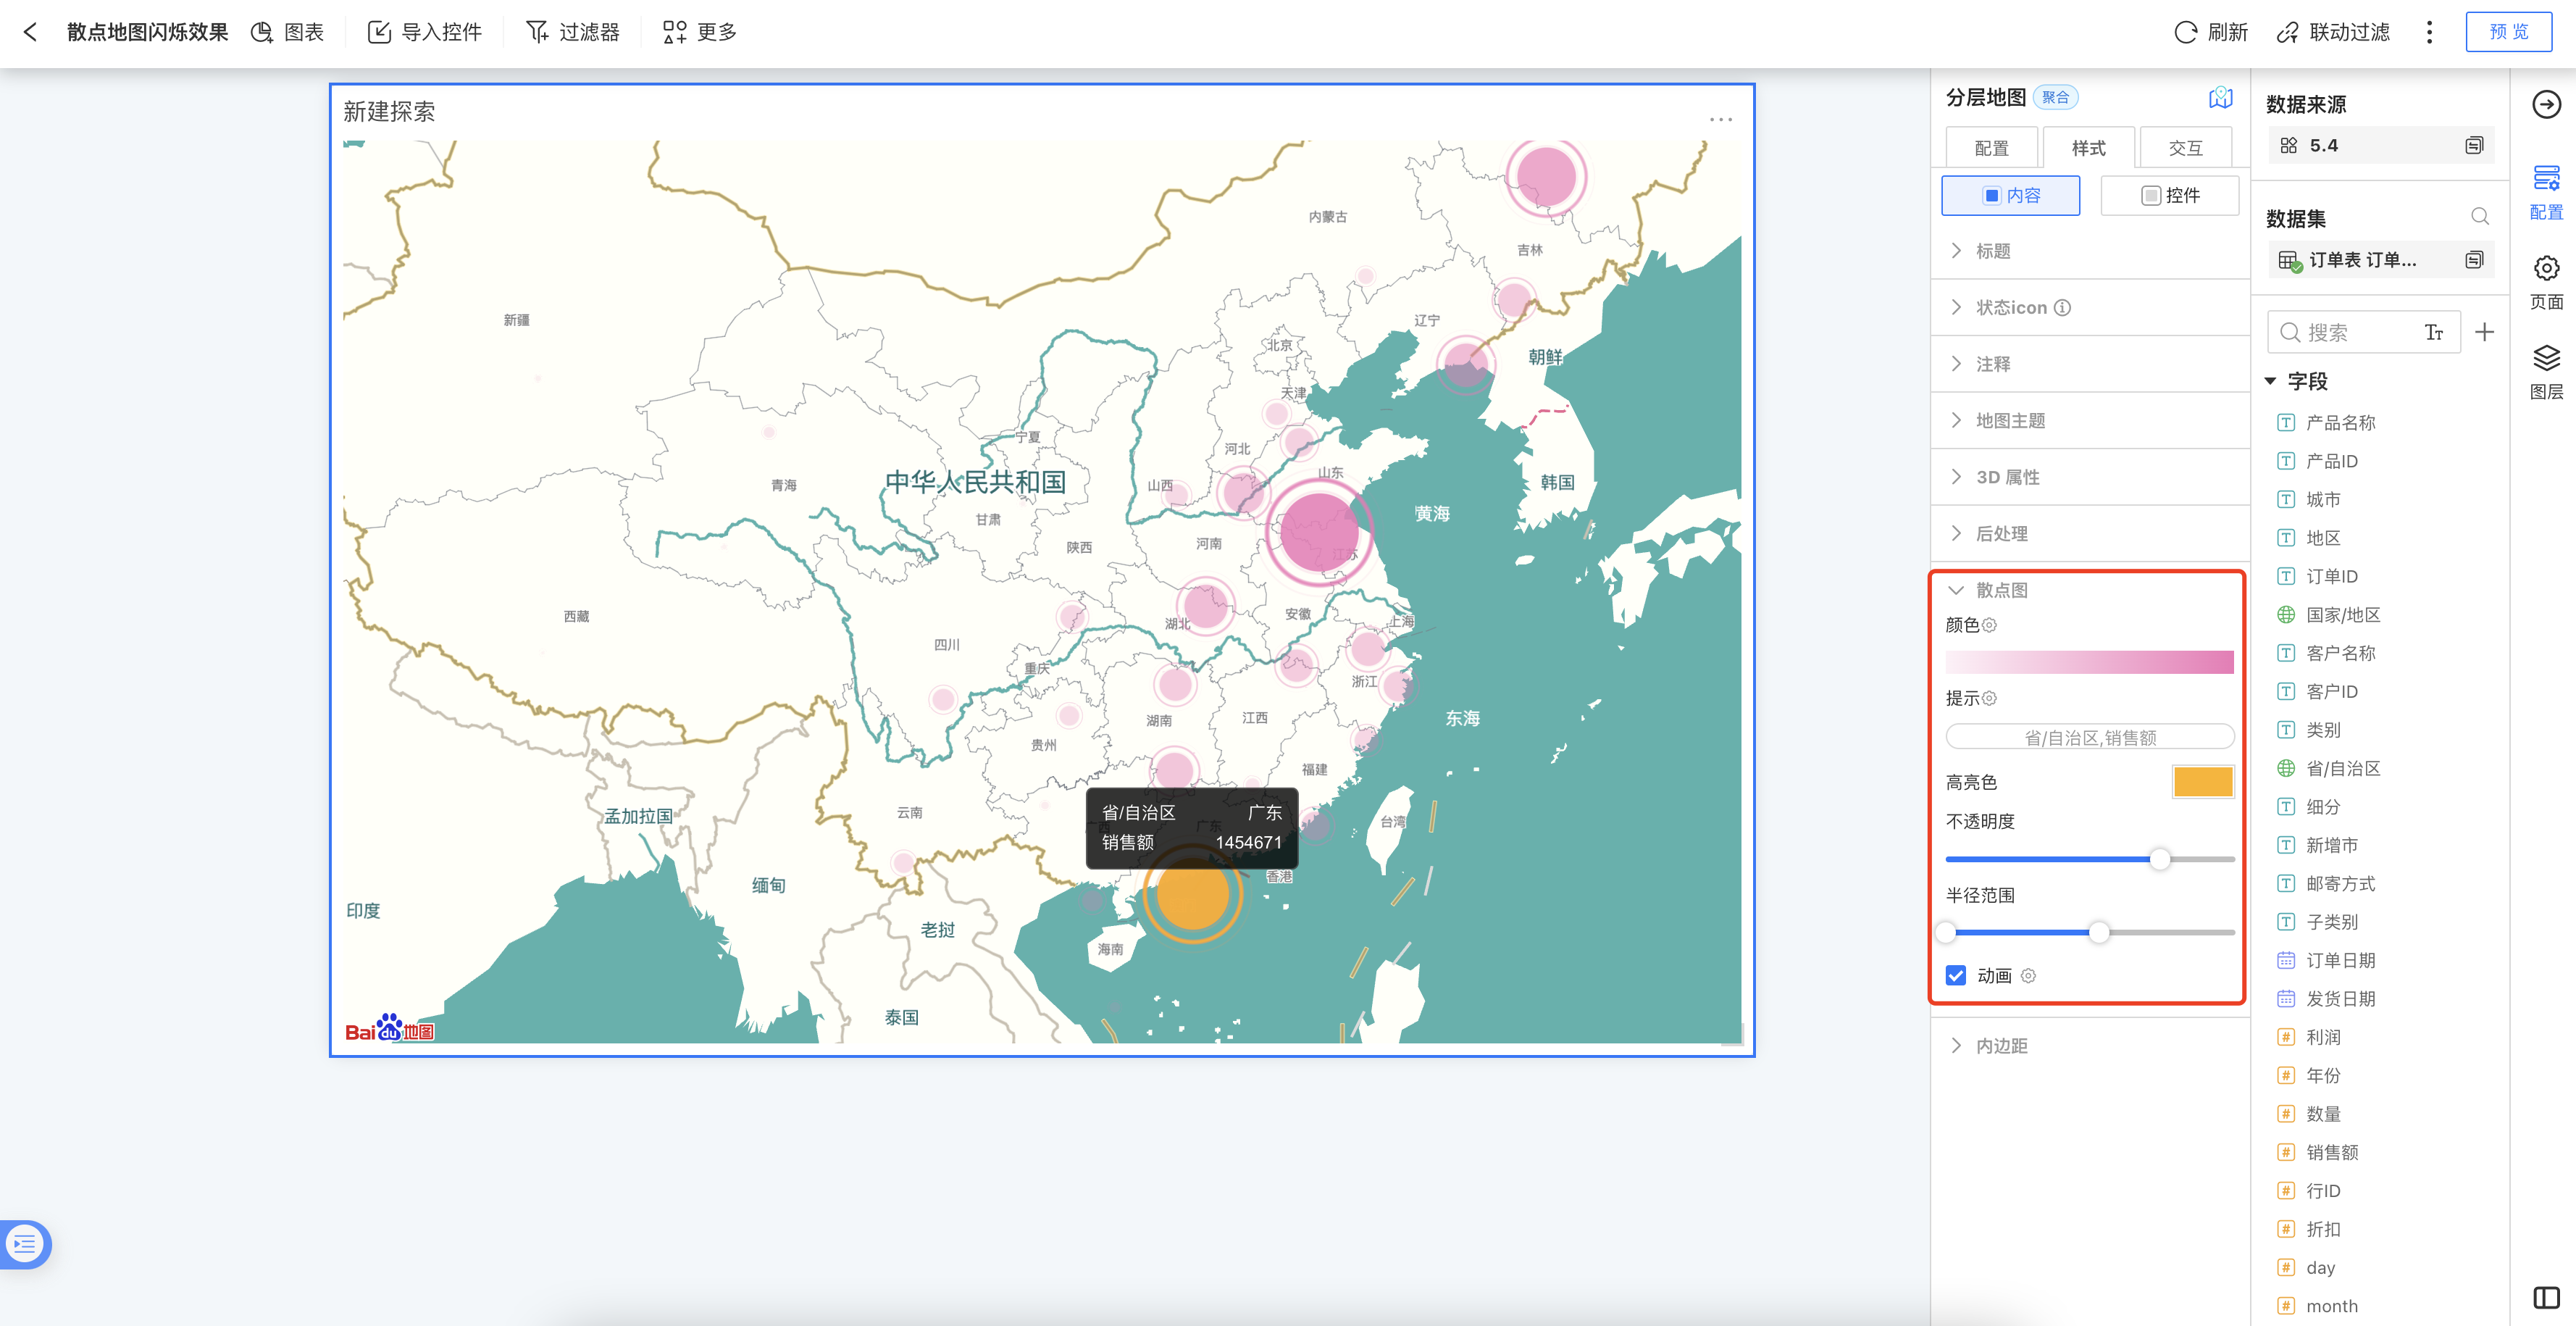
- Style Settings In the style settings, you can configure layer color, opacity, radius range, tooltips, and animations.
Flight Path Map
The Flight Path Map is used to describe the route from the starting point to the destination, such as airplane routes, cargo transportation routes, police dispatch routes, etc., all of which can be represented by a Flight Path Map.
The following configuration requirements must be met when creating a Flight Path Map.
- Basic Configuration Requirements The Flight Path Map requires two dimensions of information. One is the geographic information of the starting point, and the other is the geographic information of the destination. The dimension information supports two positioning modes: geographic mode and latitude-longitude mode. When using the geographic mode, the fields need to be converted into Geographic Roles.
- Style Settings The Flight Path Map can set colors, labels, tooltips, the thickness of the flight lines, curvature, etc., in the style settings. It also supports animations and location markers to enhance the display effect of the Flight Path Map.
The following is an example of a Flight Path Map, showing train routes from Beijing to various cities. The example uses effects such as animation, location markers, and 3D display. 
Trajectory Map
A trajectory map is used to display the trajectory of an object's movement. Unlike a flyline map, a trajectory map shows each point along the movement path, providing a detailed description of the movement process. Examples include the trajectory of Typhoon In-Fa after landfall, the stations a train passes through, the route of a city bus, and the migration path of migratory birds. These scenarios can all be illustrated using a trajectory map.
To create a trajectory map, the following configuration requirements must be met.
- Basic Configuration Requirements A trajectory map requires three dimensions of information: the trajectory identifier field, the trajectory sequence field, and the geographic role field.
- Trajectory Identifier Field: The identifier field for the trajectory, where the same identifier represents the same trajectory.
- Trajectory Sequence Field: The sequence in which positions appear on the trajectory.
- Geographic Role Field: The geographic location on the trajectory. Two positioning modes are supported: geographic mode and latitude-longitude mode. When using geographic mode, the field must be converted to a Geographic Role.
- Style Settings In the style settings of a trajectory map, you can set the layer color, opacity, and also configure the trail fade-out and animation effects of the trajectory route.
The following is an example of a trajectory map, showing the travel trajectory of the Z112 train. 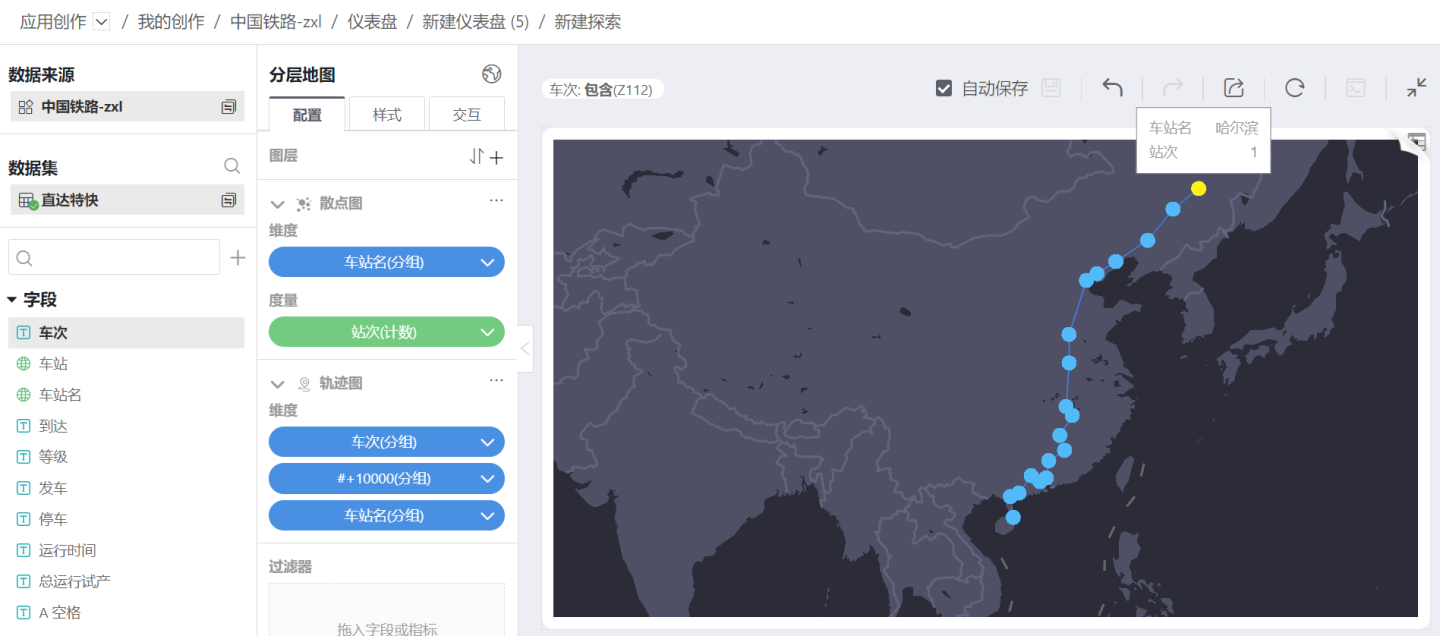
Label Map
The purpose of a label map is to annotate information on a layer, typically serving as supplementary information display for other layers.
The following configuration requirements must be met when creating a label map.
- Basic Configuration Requirements A label map requires the configuration of a positioning field and an information field. The positioning field is geographic information, and the information field is the information to be displayed. The positioning field supports two positioning modes: geographic mode and latitude-longitude mode. When using the geographic mode, the field needs to be converted to a geographic role.
- Style Settings In the style settings of the label map, you can set the display fields for the labels, which can be partially or fully displayed.
The following is an example of a label map, which adds the display effect of a label map on the basis of a regional map example. 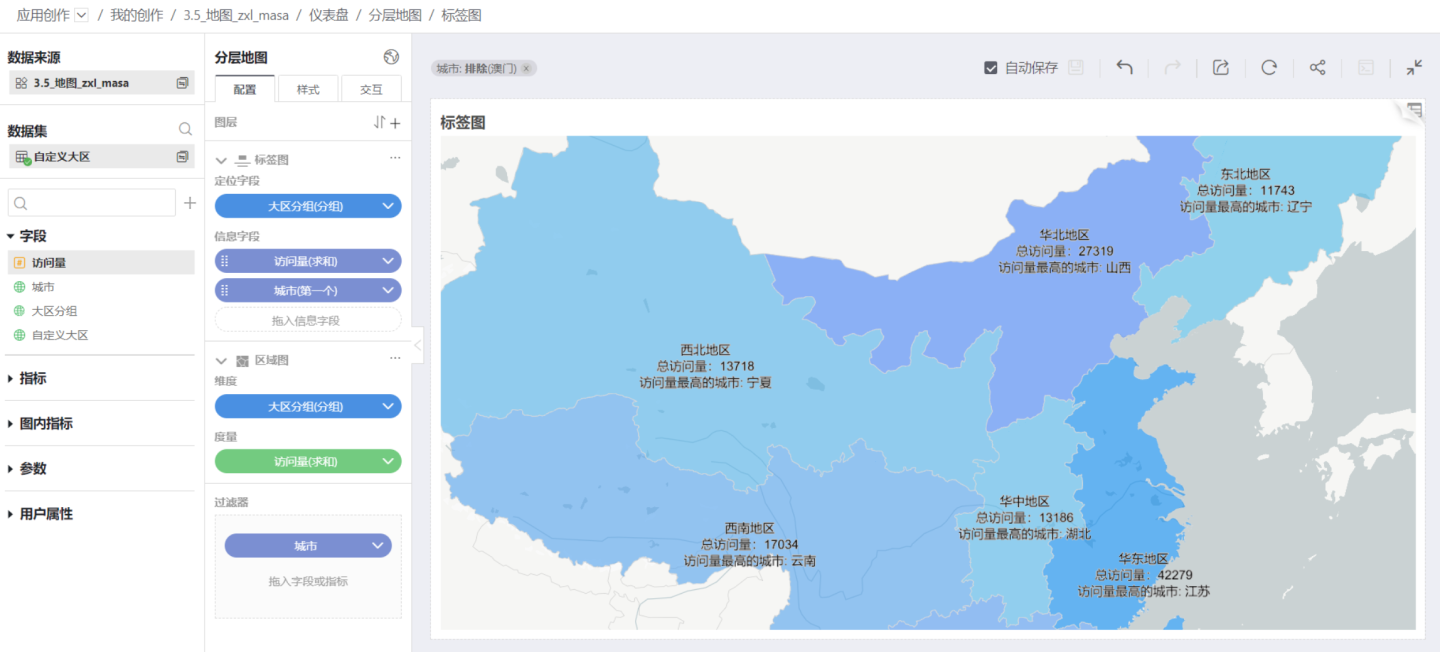
Polygon Area Map
GeoJSON is a commonly used standard for storing geographic location information. It can store concepts such as points, lines, polygons, and composite polygons in a consistent data structure. In the HENGSHI 5.2 feature update, we have provided the ability to read and load geographic location information from PostGIS, converting it into the standard GeoJSON format, and have added a new polygon layer to the map. With this new layer, users can flexibly define their own geofences without being limited to standard maps.
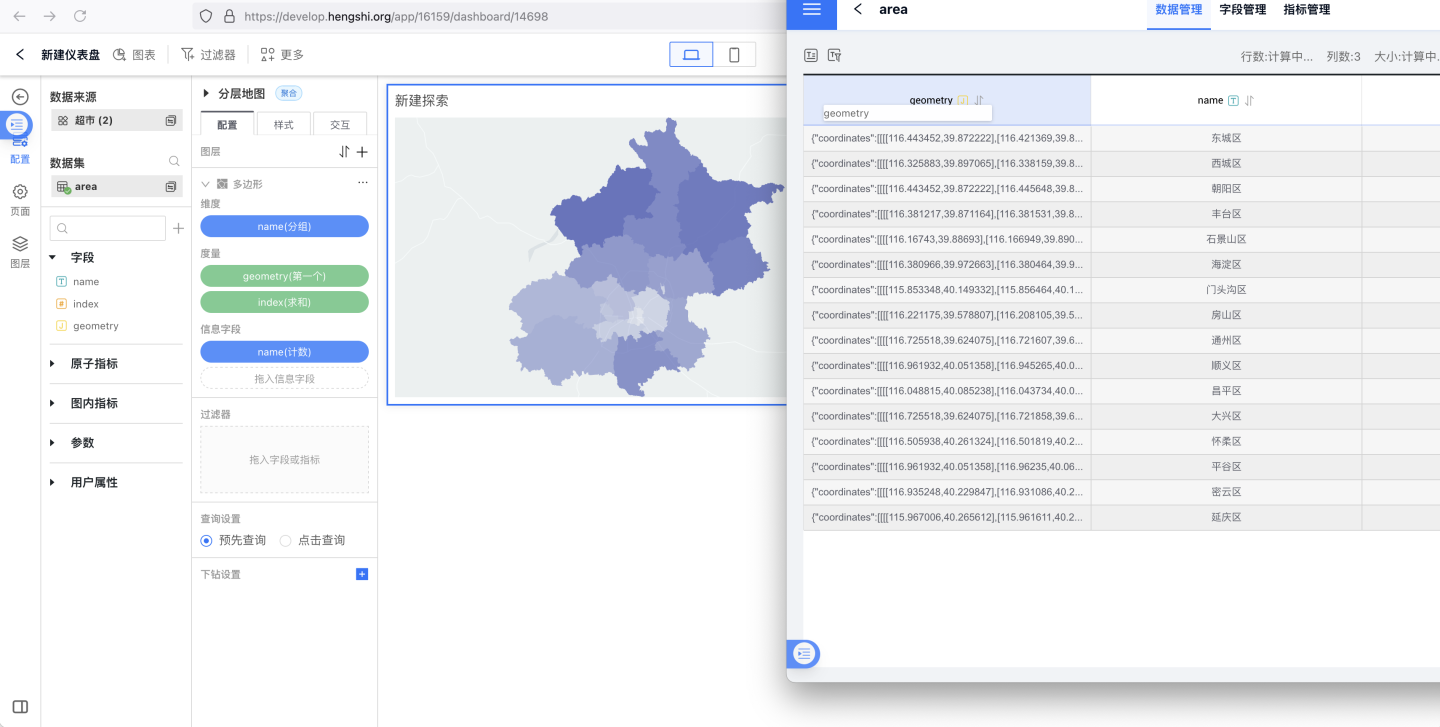
3D Map Display
3D Perspective Drag Effect for Maps
The layered map supports 3D visual effects, allowing for arbitrary adjustment of the 3D display perspective. During the adjustment process, it supports one-click restoration to the default positioning view.

The map display allows for free switching between 2D and 3D views.
Hierarchical Map Style 3D Attribute Configuration
A new 3D attribute settings panel has been added to the hierarchical map style configuration. Configuration path: Hierarchical Map > Style > 3D Attributes, where you can set the horizontal and vertical angles of the 3D view (vertical angle supports 0-60 degrees, horizontal angle supports -180 to 180 degrees rotation). 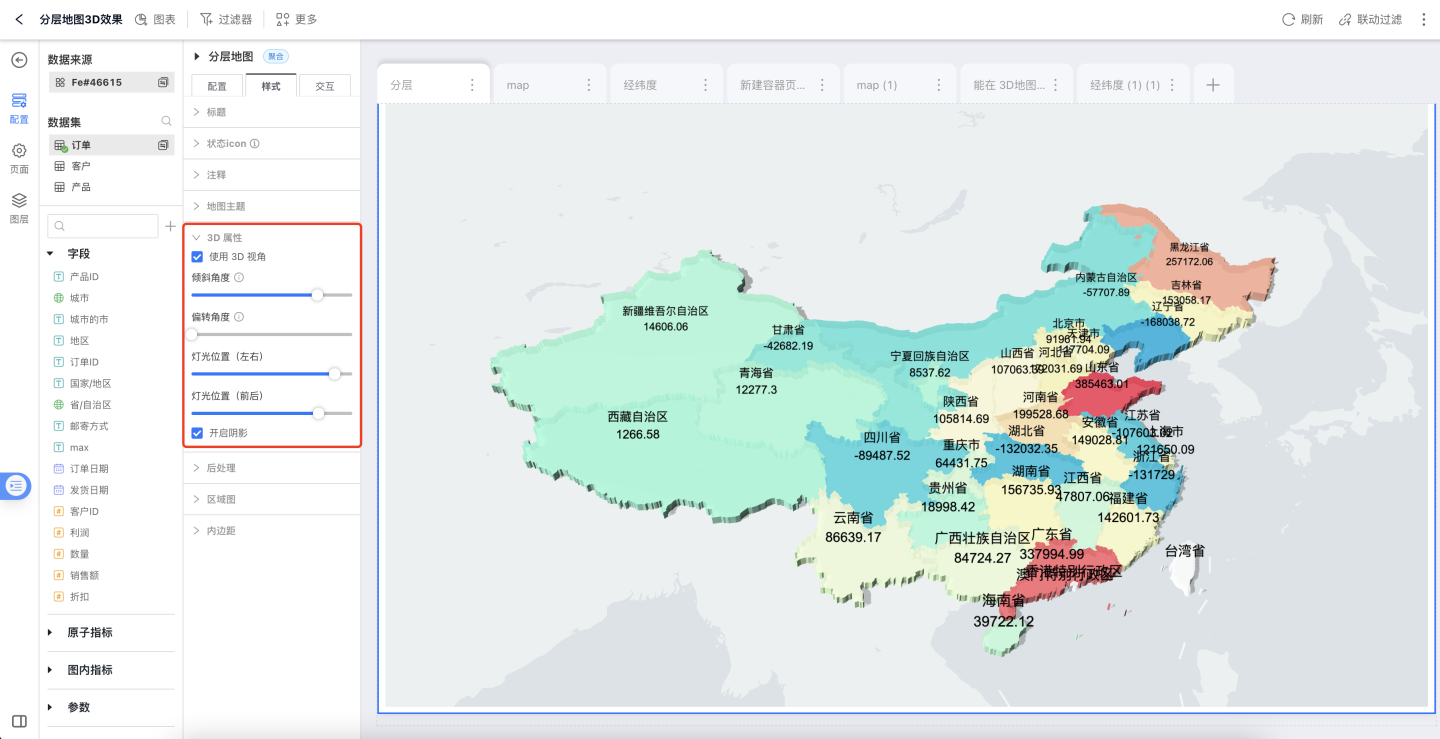
Add 3D map height settings to the area map layer. Configuration path: Hierarchical Map > Style > Area Map > Height Multiplier. 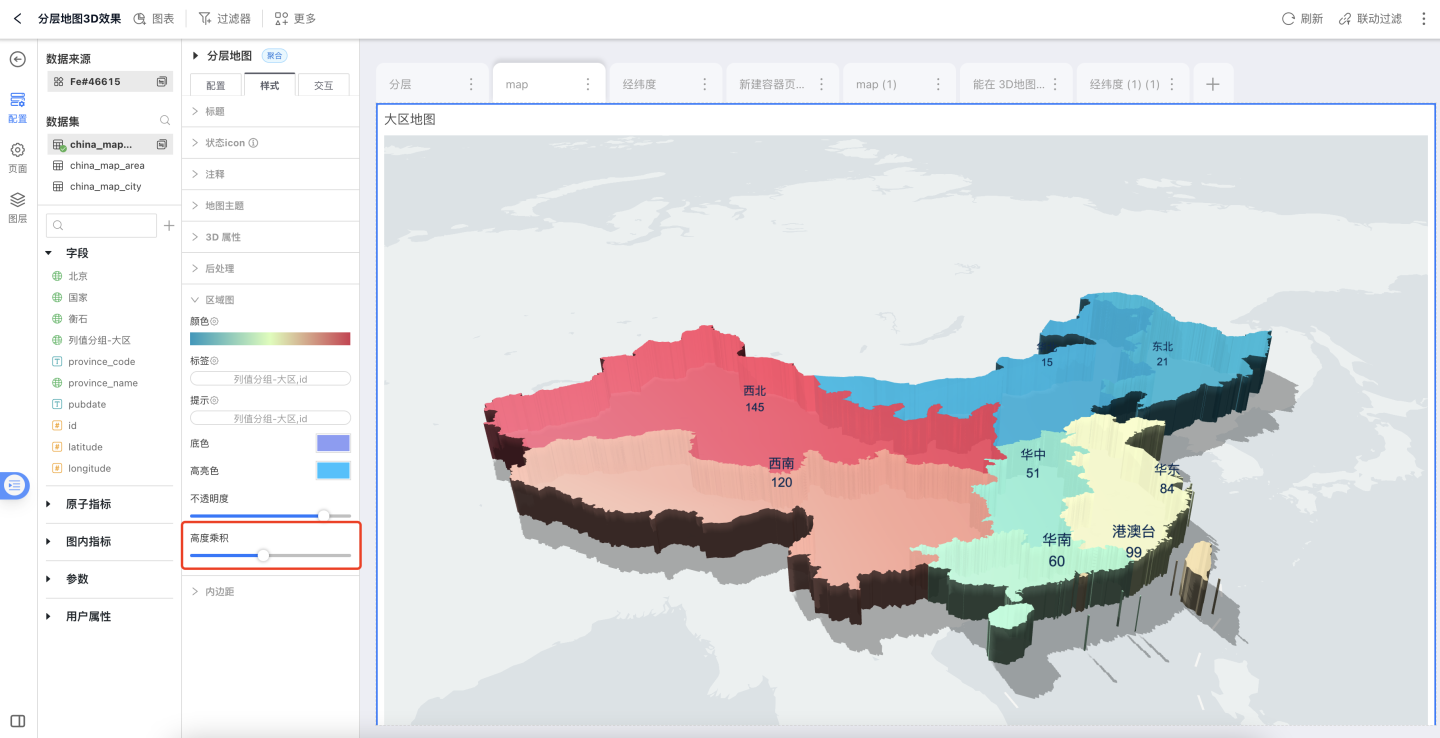
Tip
3D area maps support scatter plots, aggregate plots, and label plot layers. Other layers such as heat maps, hexbin maps, grid maps, flow maps, and trajectory maps are not currently supported on 3D area maps.