Line Chart
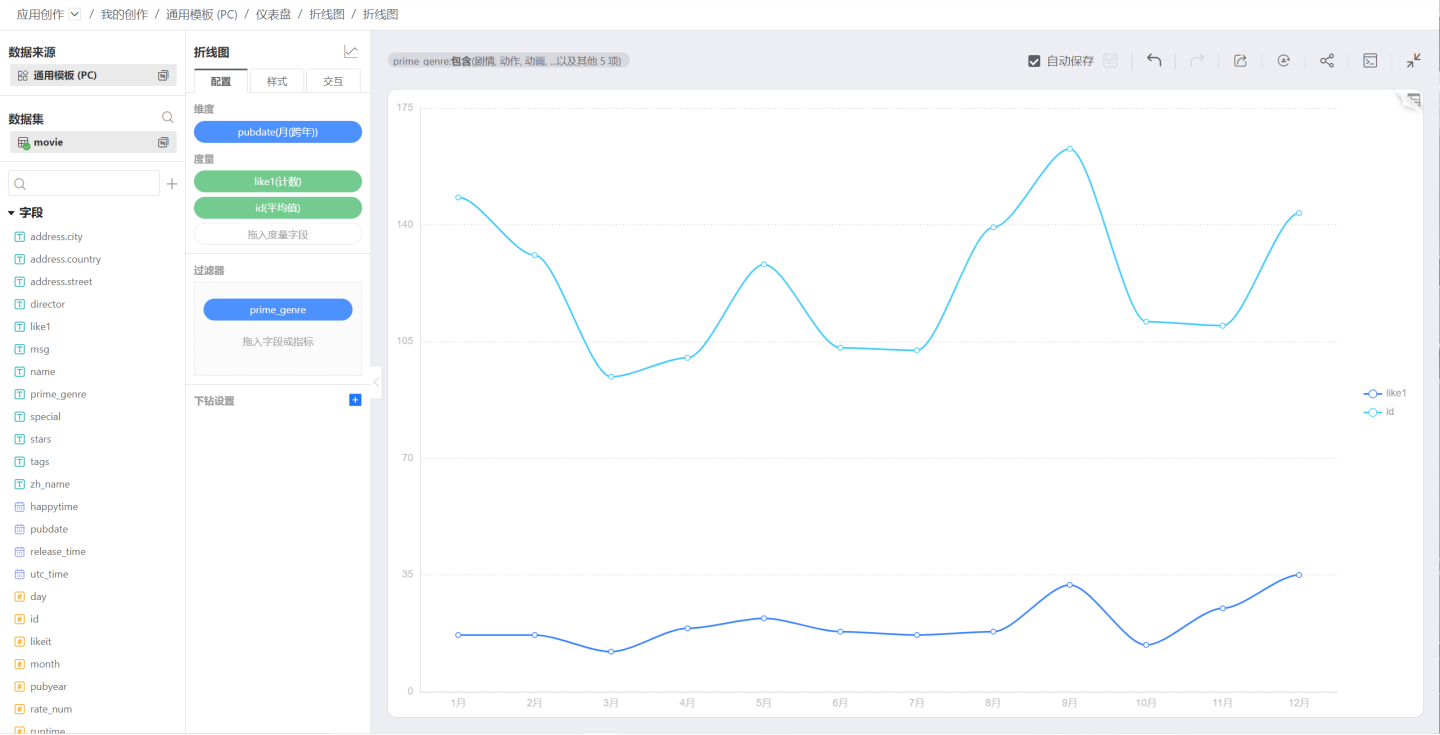
The line chart typically displays the trend of one or multiple measures over a time dimension, and can be used in conjunction with bar charts.
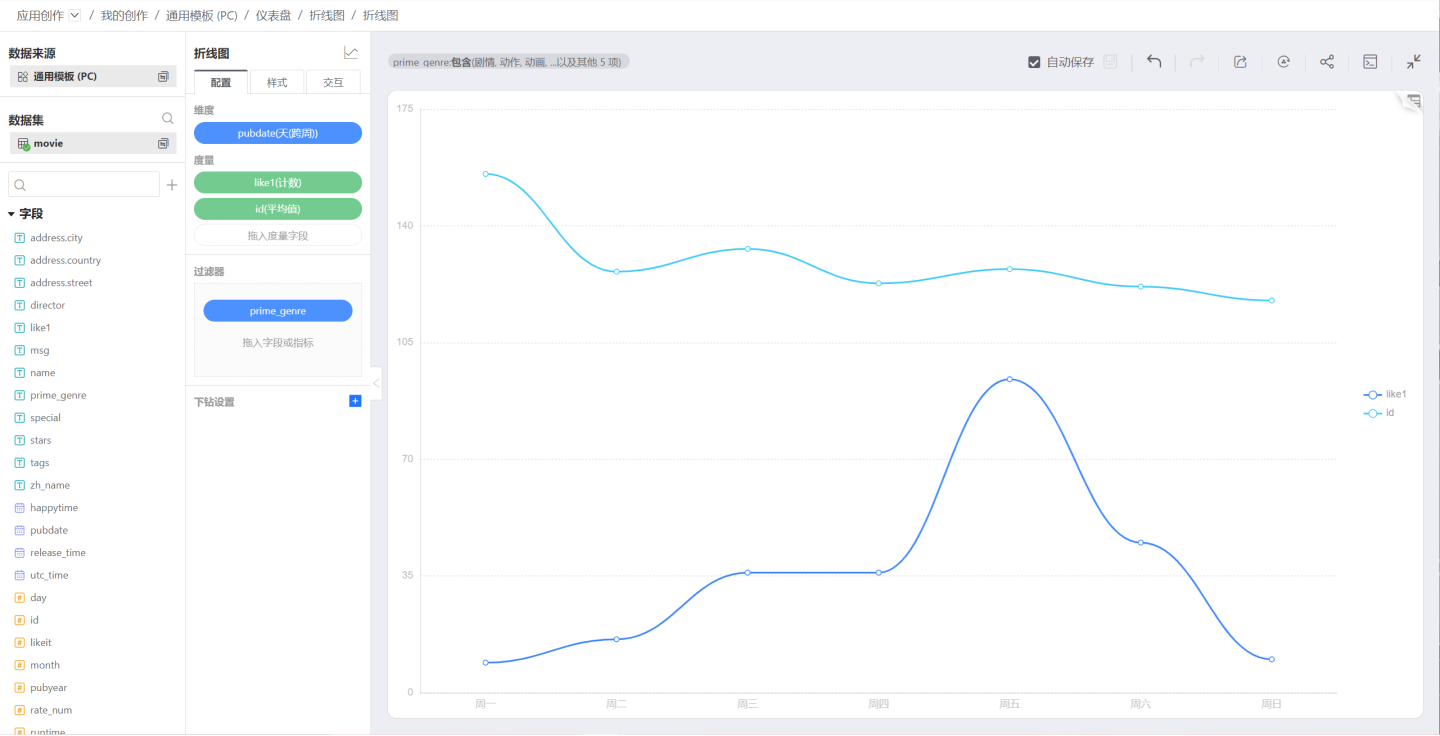
- Adjust the granularity control over time dimensions: year, month, day, etc.
Grouped Line Chart
The grouped line chart is equivalent to decomposing a multi-series line chart into multiple single-series line charts. Advantages: more intuitive and clear. 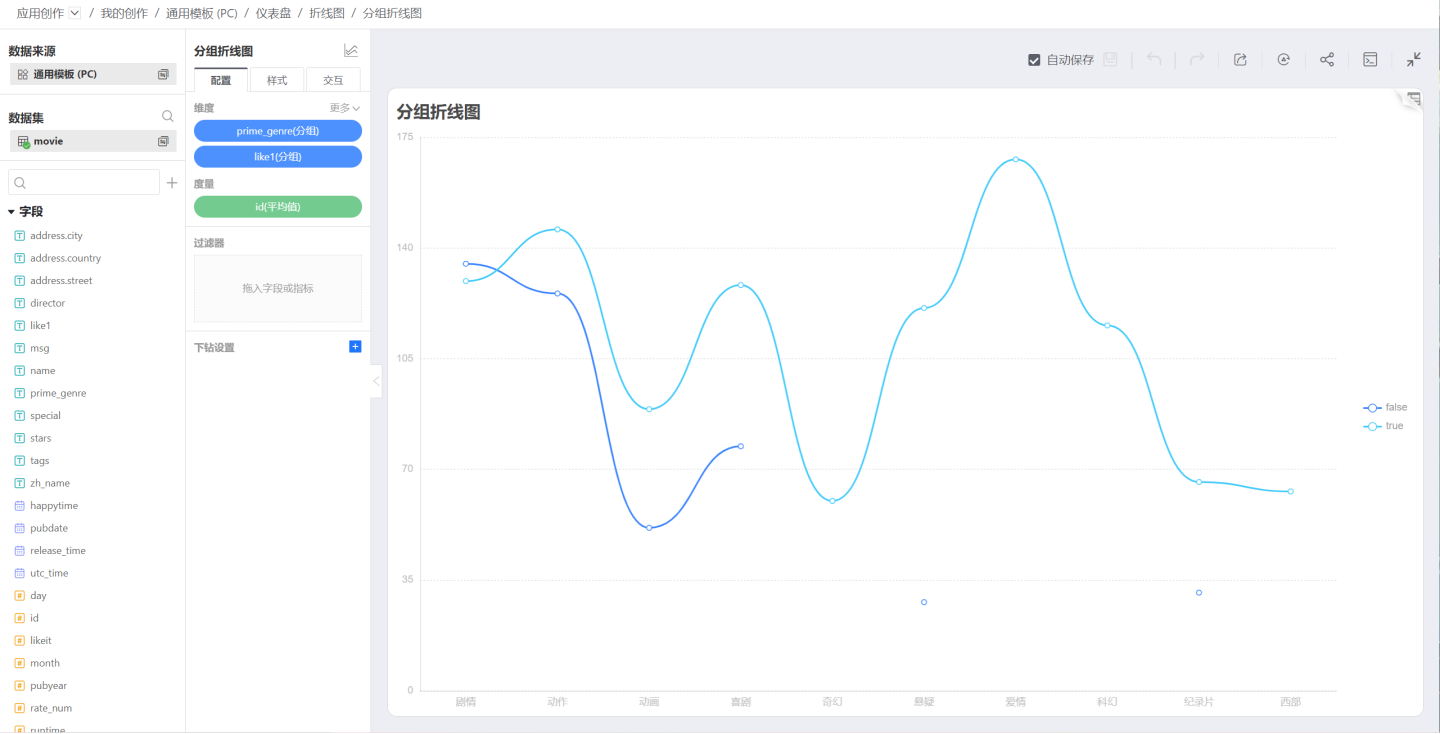
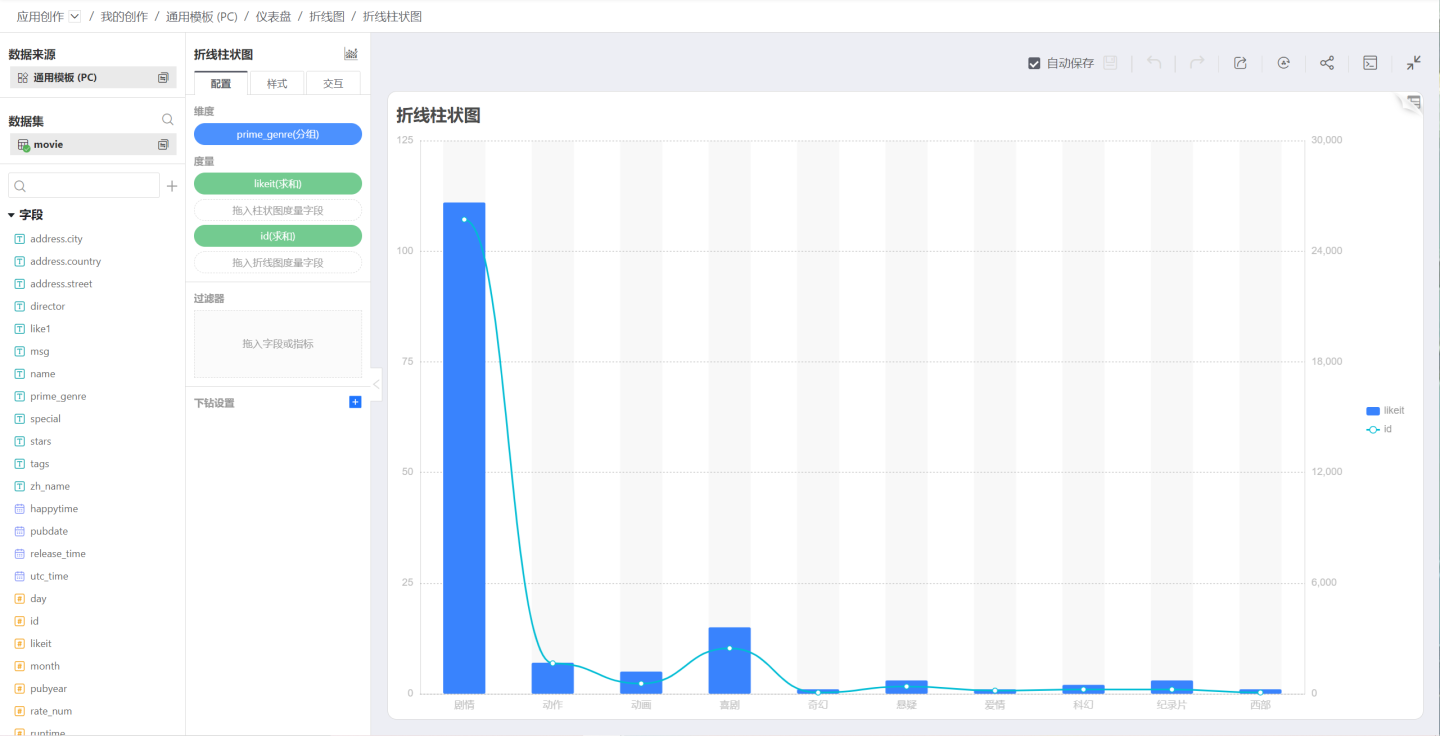
Line and Bar Combination Chart
You can choose to combine lines and bars based on a time dimension.