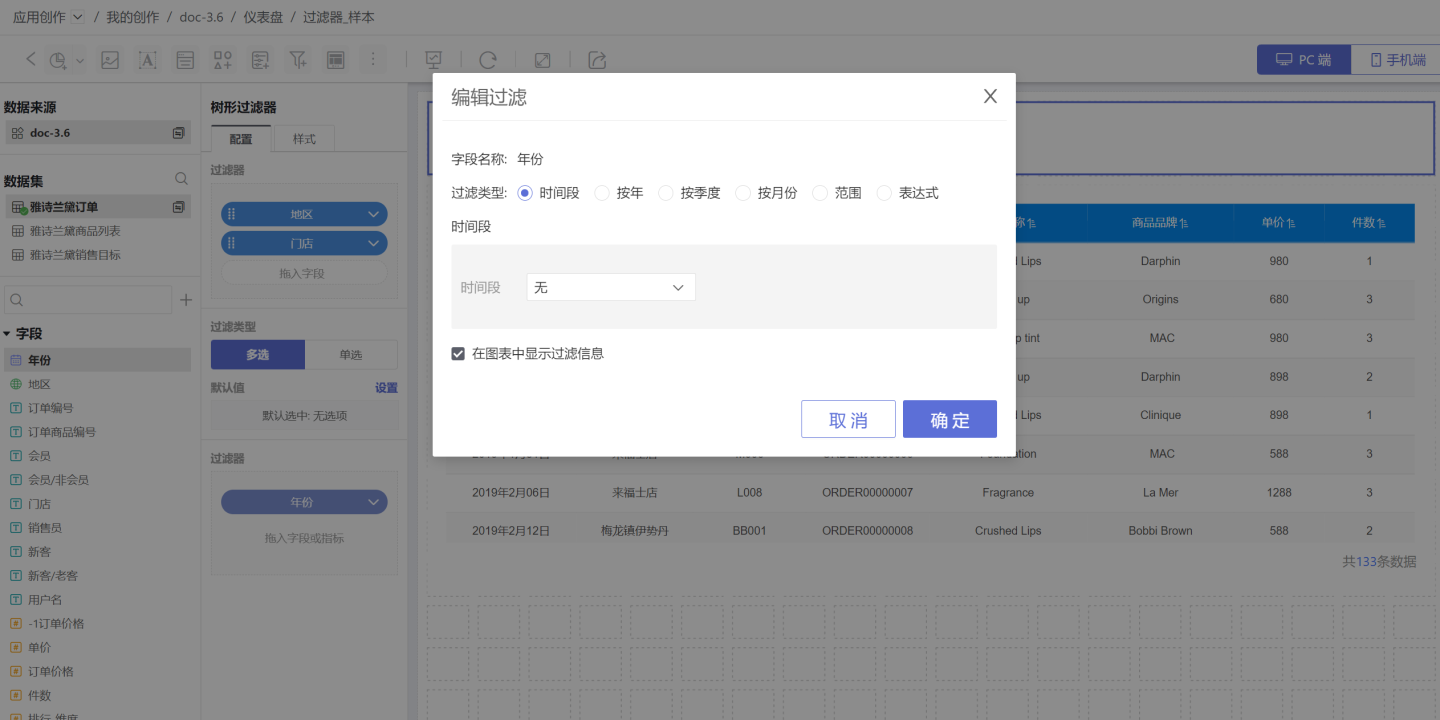
Filter Settings
Sidebar Filters
When there are limited controls on the canvas, filters can be moved from the canvas to the sidebar. Expand the sidebar to filter data when needed, and collapse it when not in use.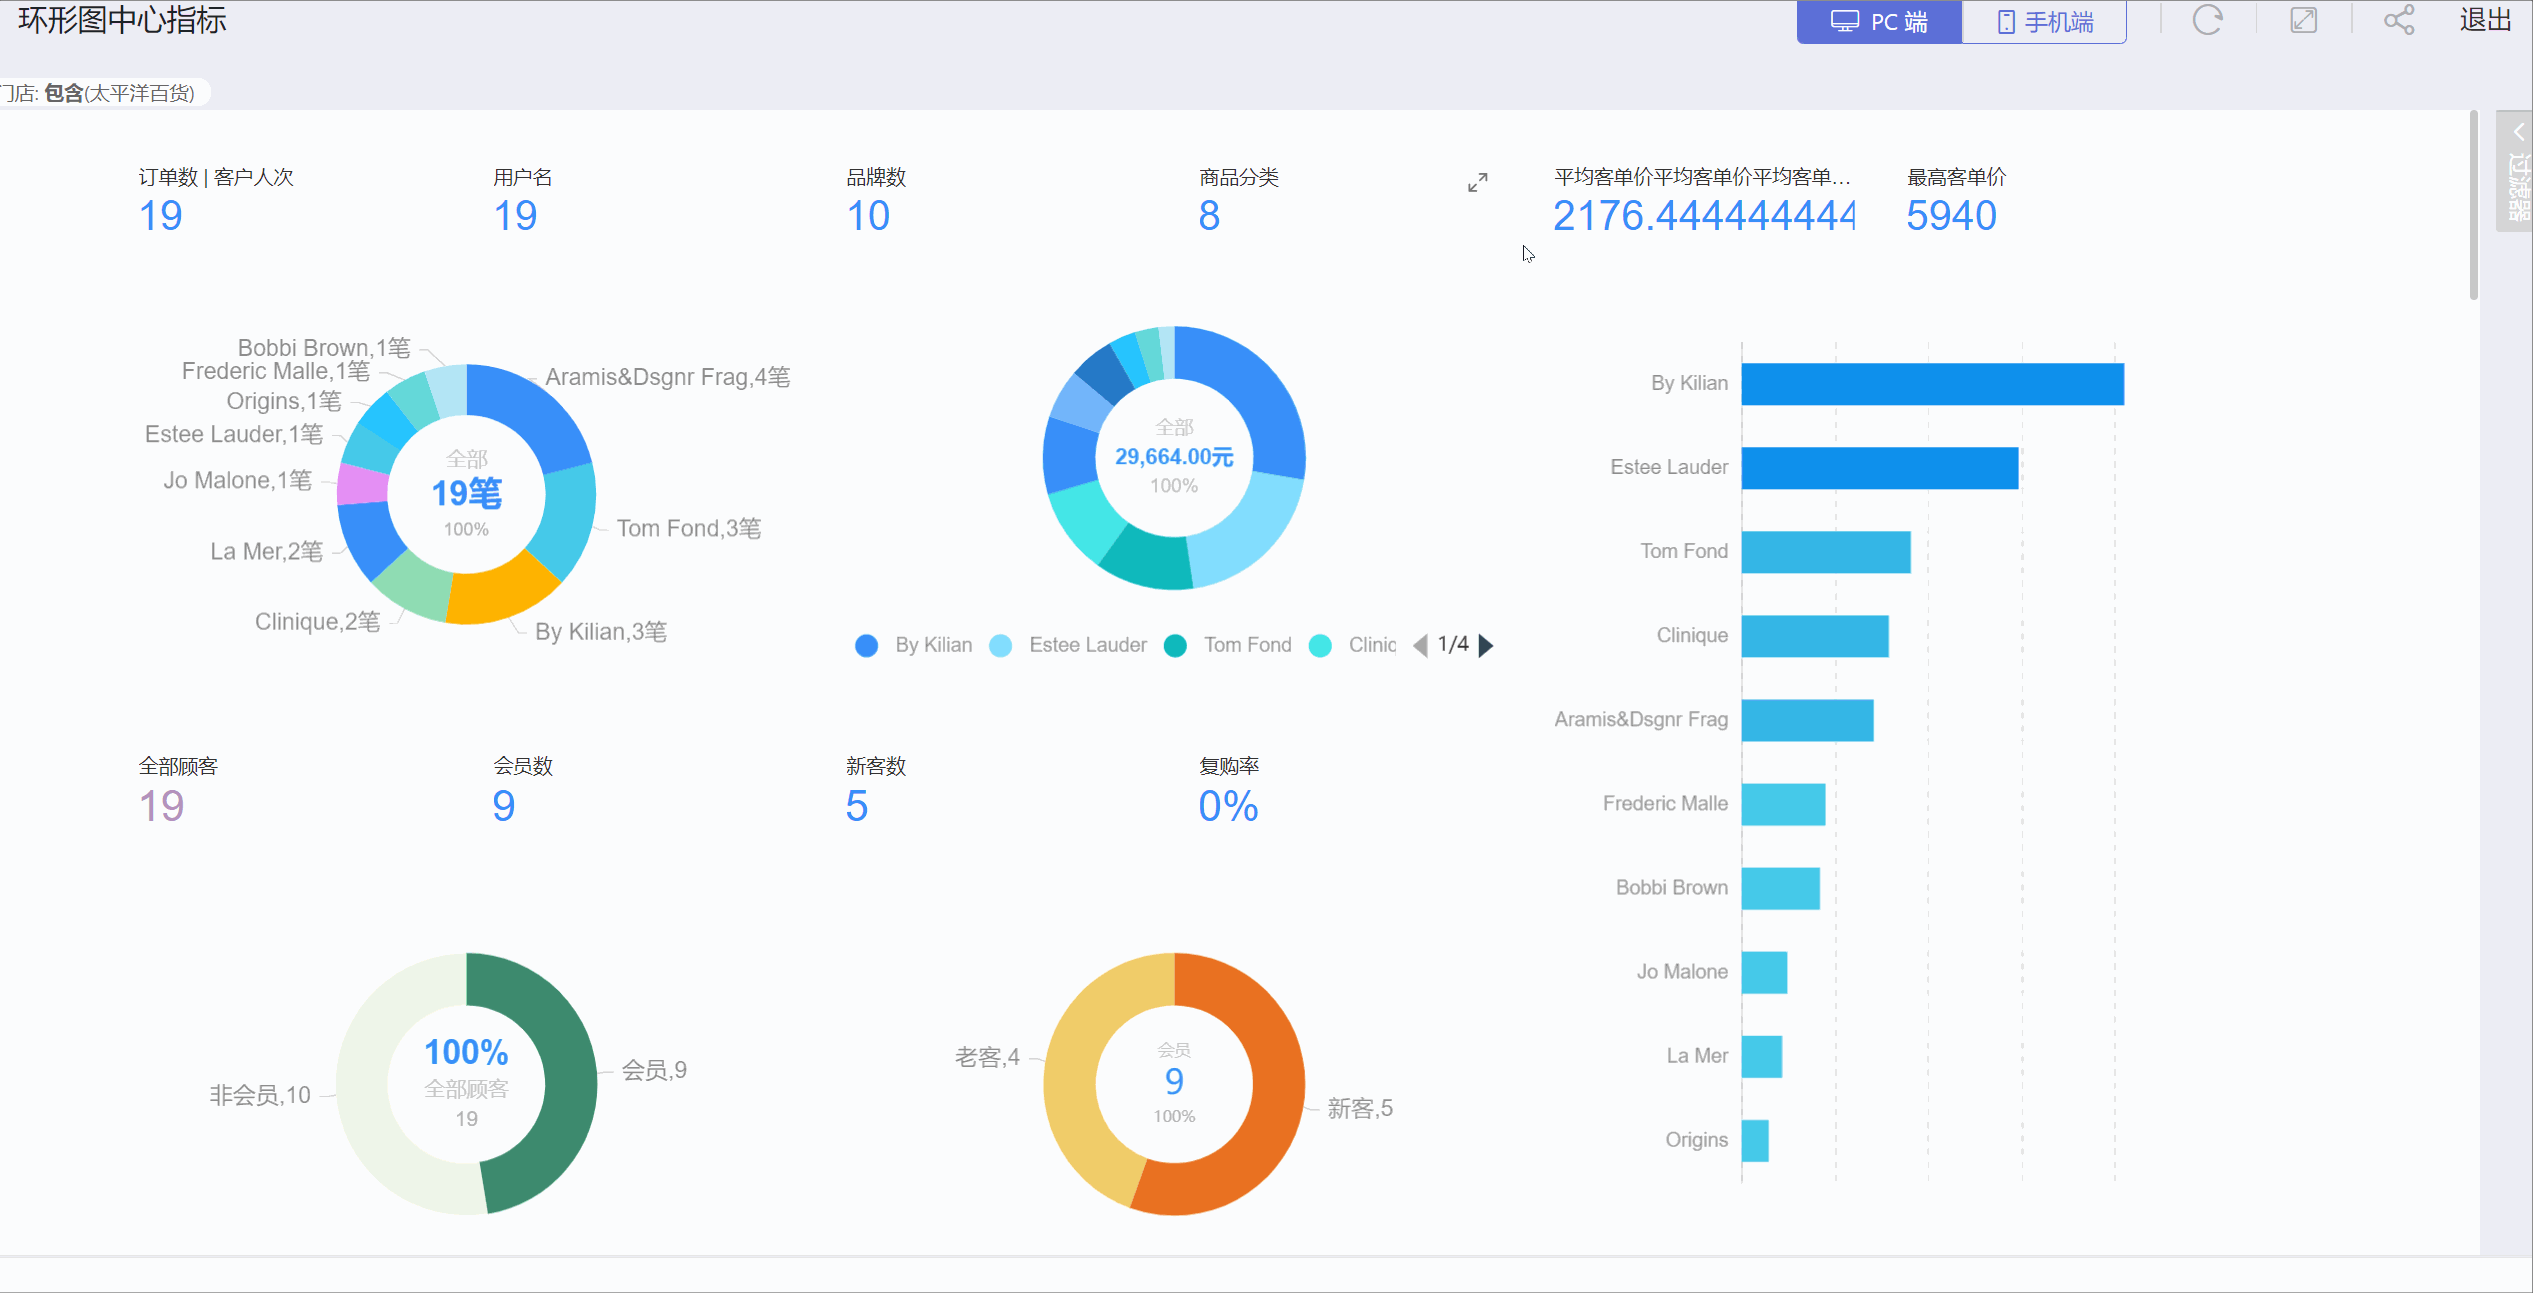
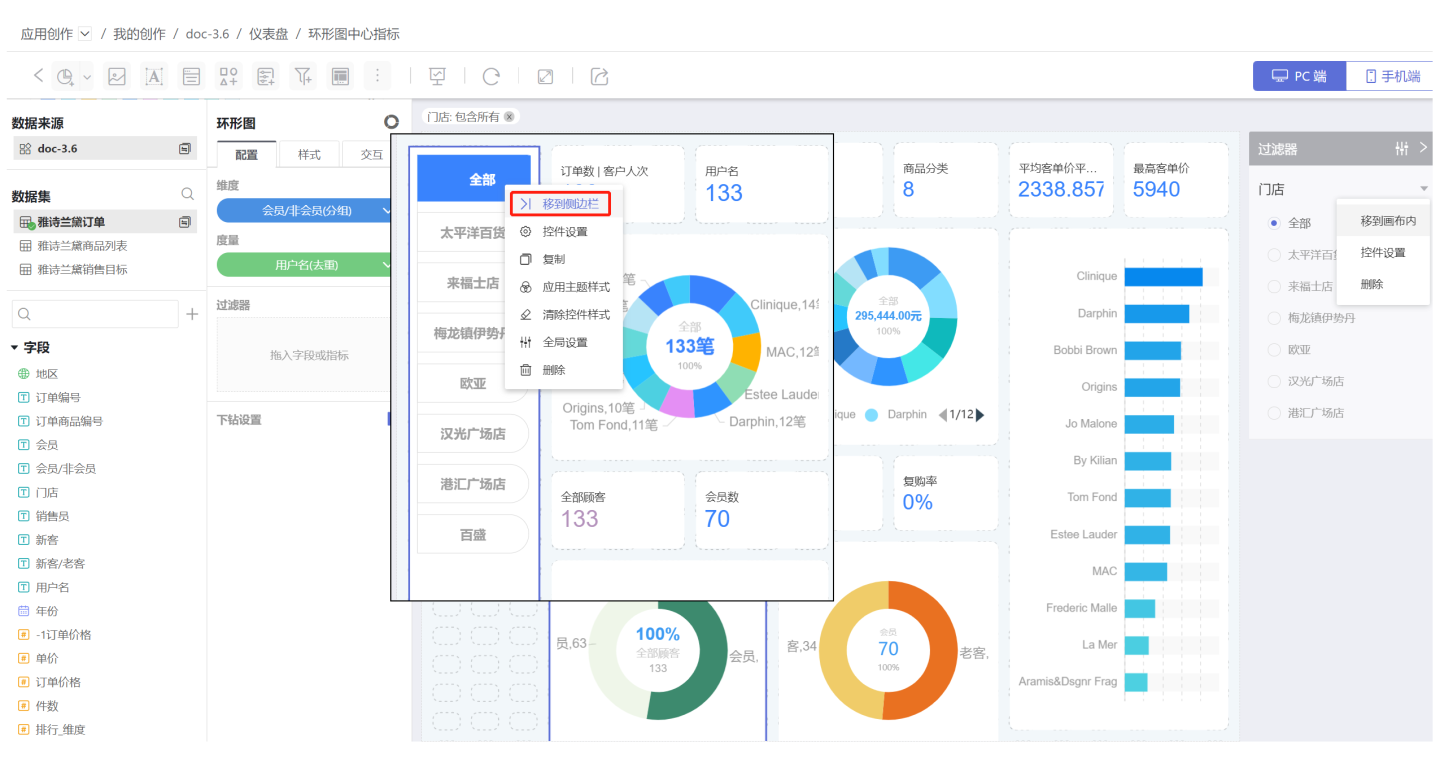
Filters are initially displayed on the canvas and can be moved to the sidebar via the Move to Sidebar option in the three-dot menu. Filters in the sidebar can be moved back to the canvas using the Move to Canvas option.
Filters in the sidebar have a fixed display style and do not support customization.
Notes
- When filters are in the sidebar, controls in the Settings can be configured to select
Show Filter Tags After PublishingandVisible After Publishing. If unchecked, the filters will not be displayed after publishing, meaning the content within the blue and red boxes in the image will not be shown.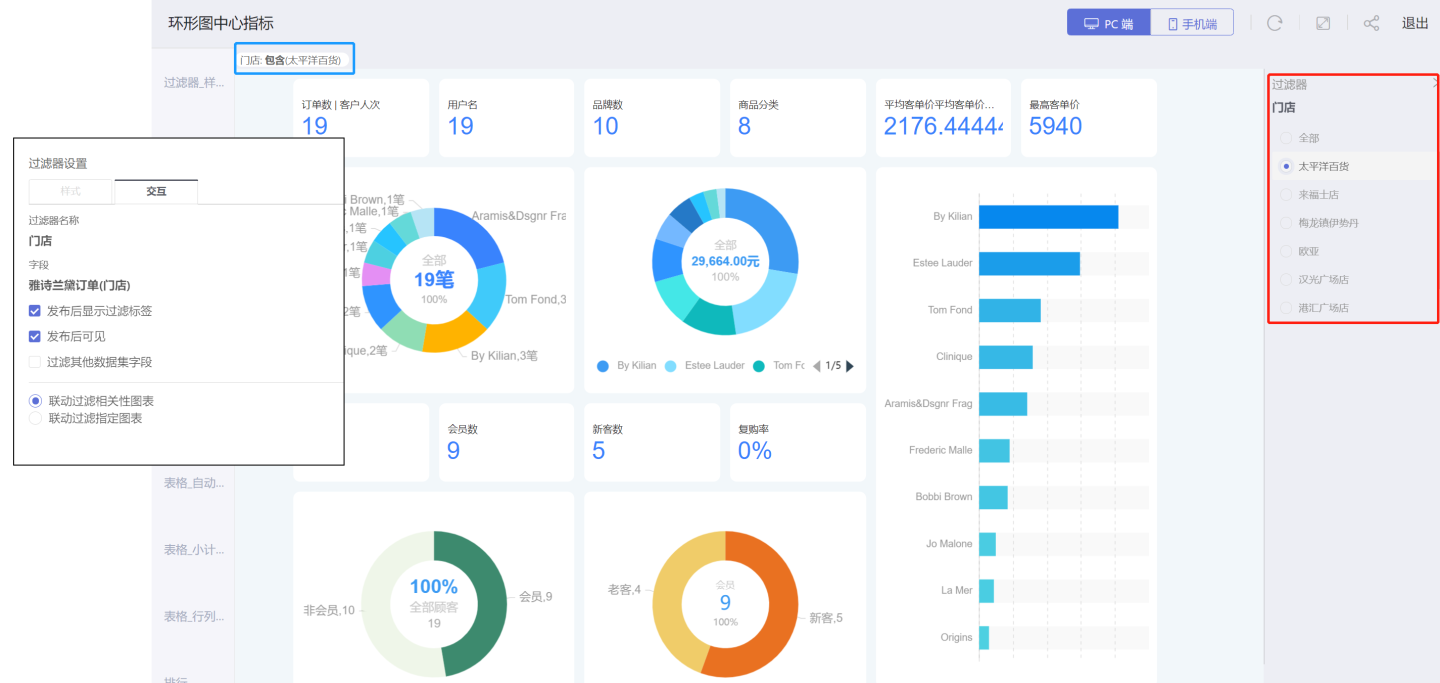
- The sidebar can store not only filter controls but also parameter controls.
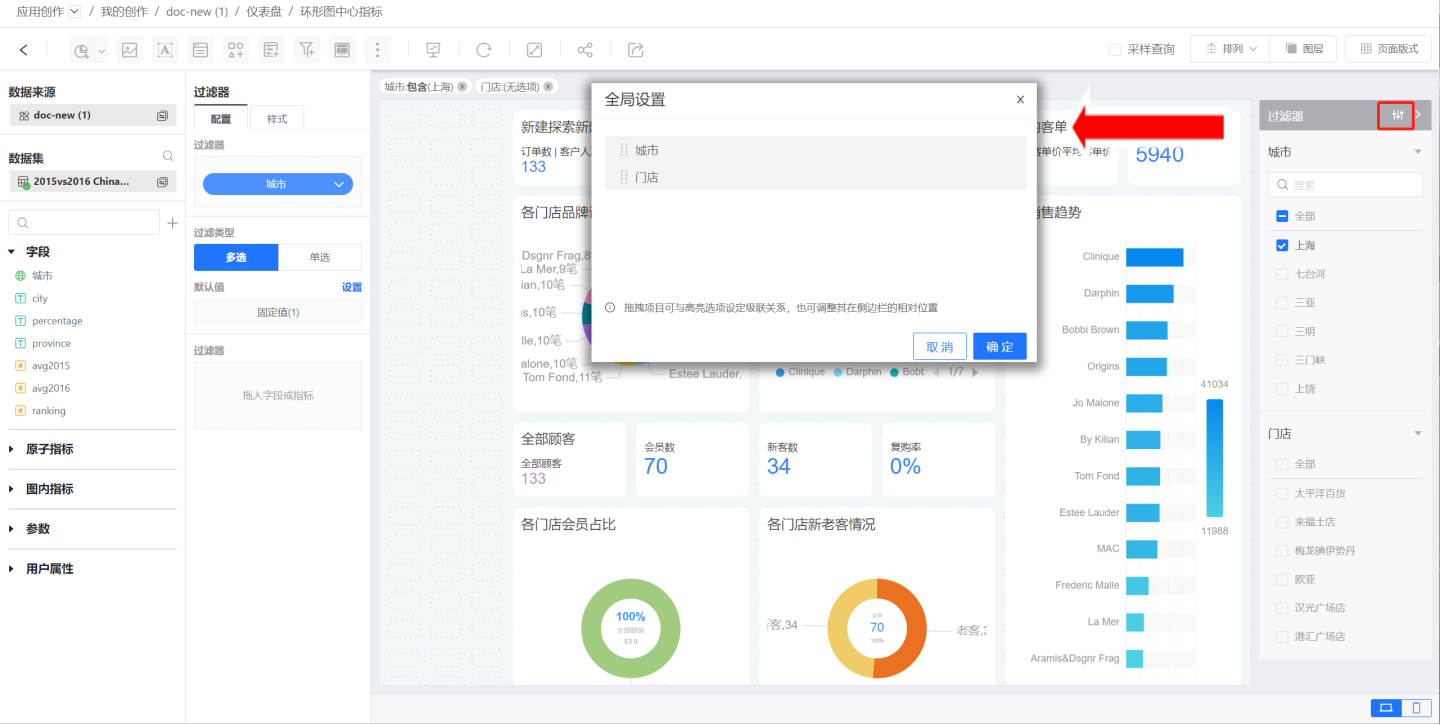
- The order of controls in the sidebar can be adjusted via the Global Settings. The display order in the global settings determines the order of controls in the sidebar.
Mobile Sidebar Display
The sidebar can also be displayed on mobile devices, and in App creation, the mobile sidebar display is no different from the PC version, as shown in the figure below.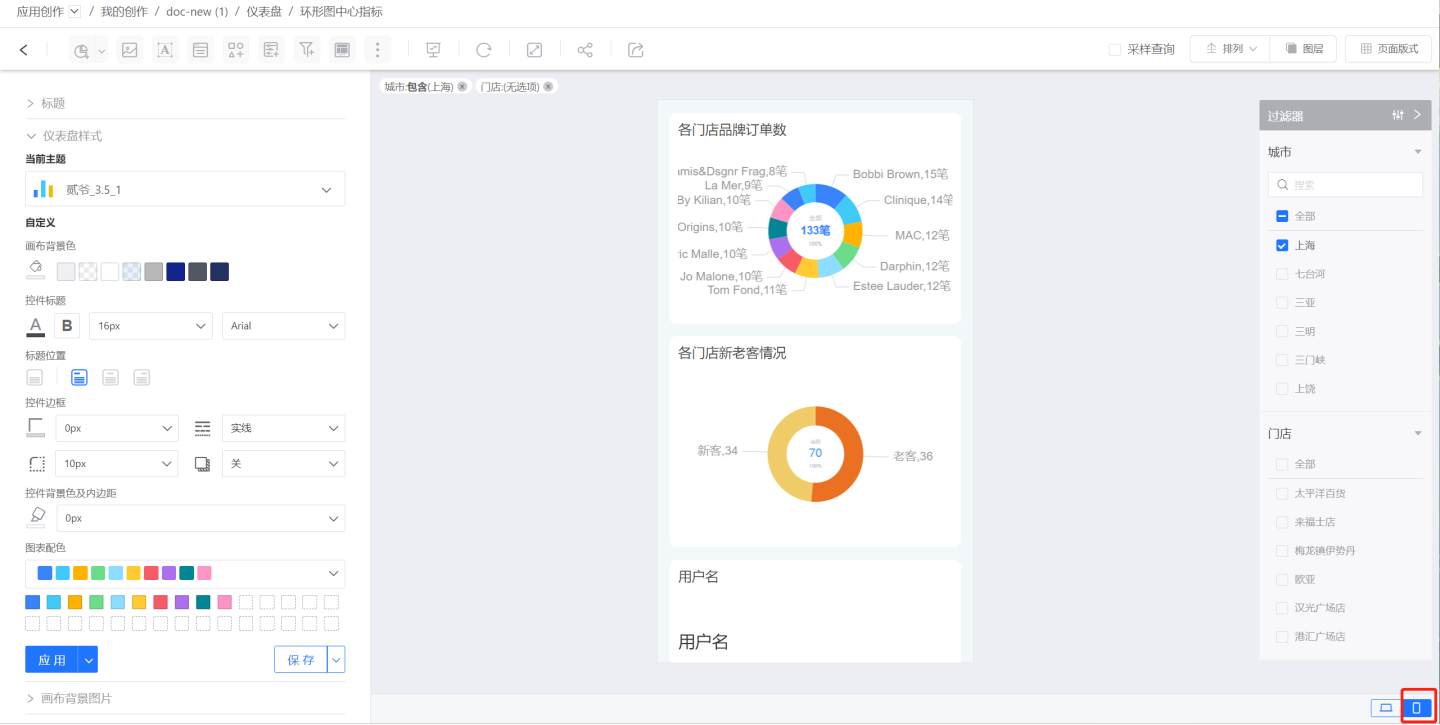
After publishing, the sidebar will appear at the top right of the Dashboard. Clicking the sidebar icon will display all controls in the sidebar (including filter controls and parameter controls). You can filter Dashboard data by selecting filter options, and clicking again will return to the Dashboard page.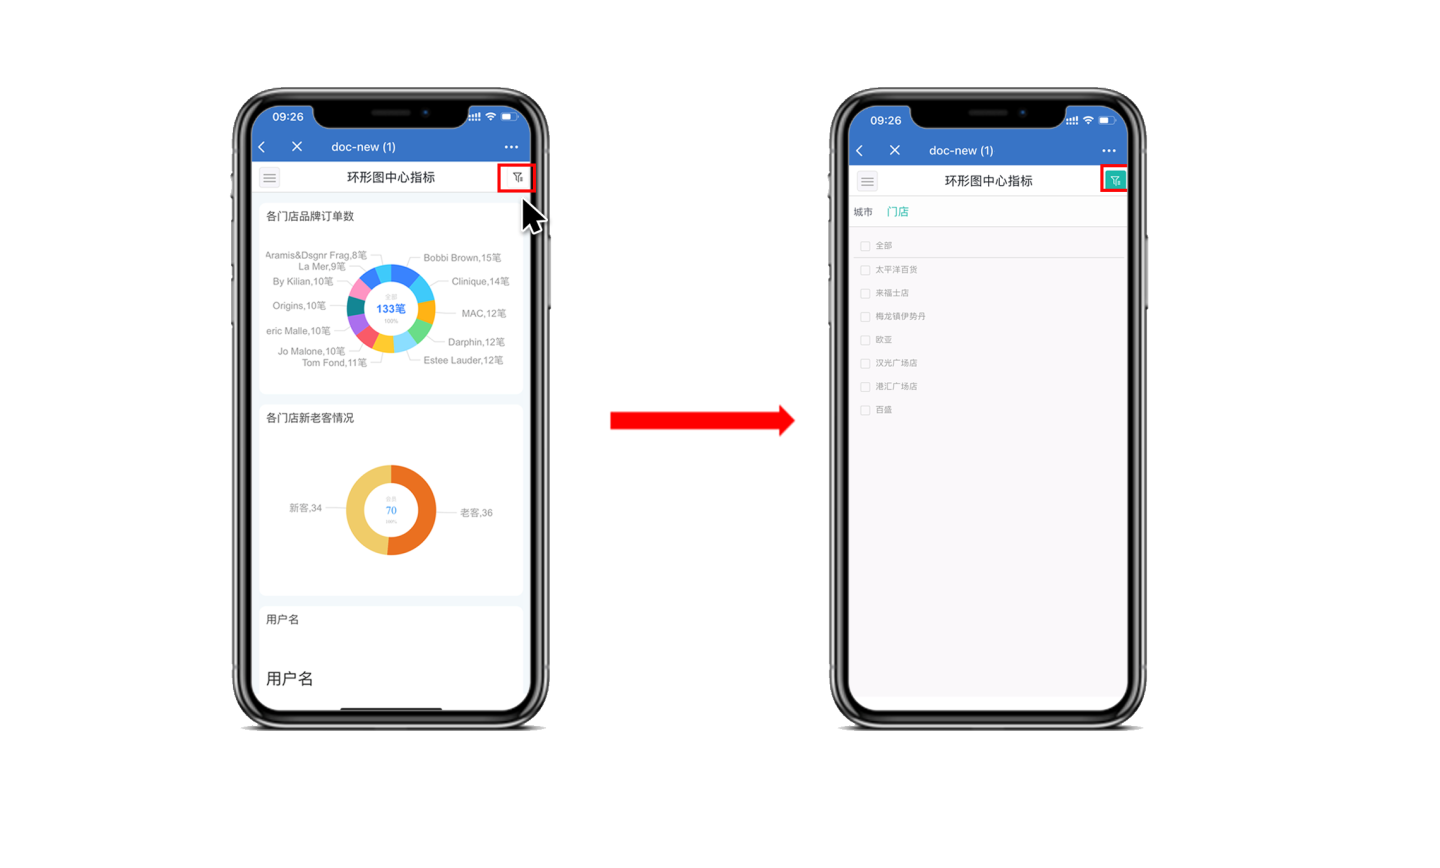
Filter Interaction Operations
In Control Settings -> Interaction, configure interaction operations related to filters. This includes filtering other datasets, linking filters to related charts, linking filters to specific charts, and outer filtering.
Tip
- The filter button has no interaction operations.
- Sidebar filters can be configured in interactions to
Display Filter Tags After PublishingandVisible After Publishing.
Filter Other Dataset Fields
Filtering other dataset fields refers to associating the current filter field values with fields in other datasets. When the filter options change, the charts of the other dataset fields that have been set will also interactively update with the filter options. As shown in the figure, after setting the interaction, the charts within the red box will interact with the filter.
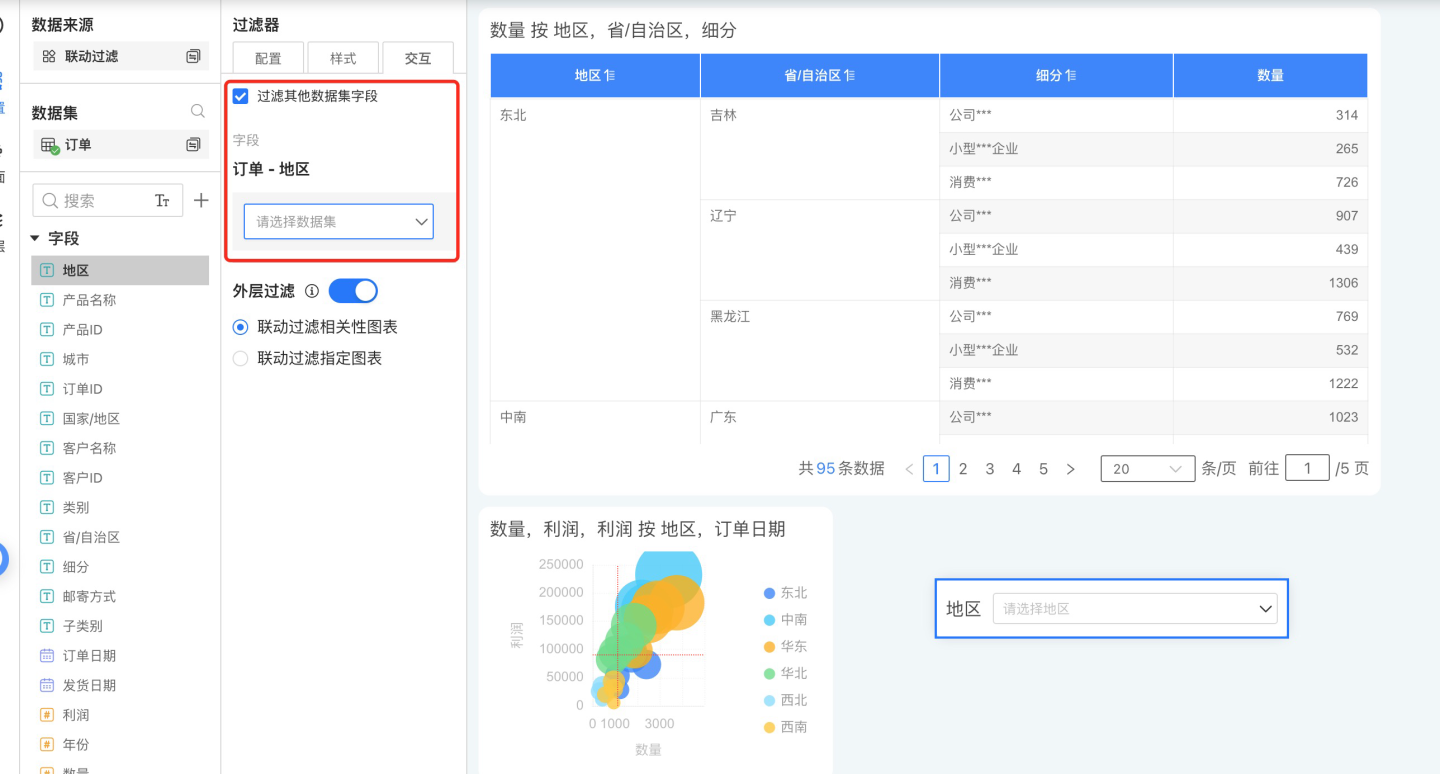
A tree filter contains multiple filter fields, so when setting a tree filter to filter other dataset fields, you need to first select the corresponding filter field.
Linked Filter Correlation Chart
The linked filter correlation chart refers to charts created using the dataset where the filter options are located. This option is selected by default, indicating that when the filter options change, all correlation charts in this dashboard will be linked.
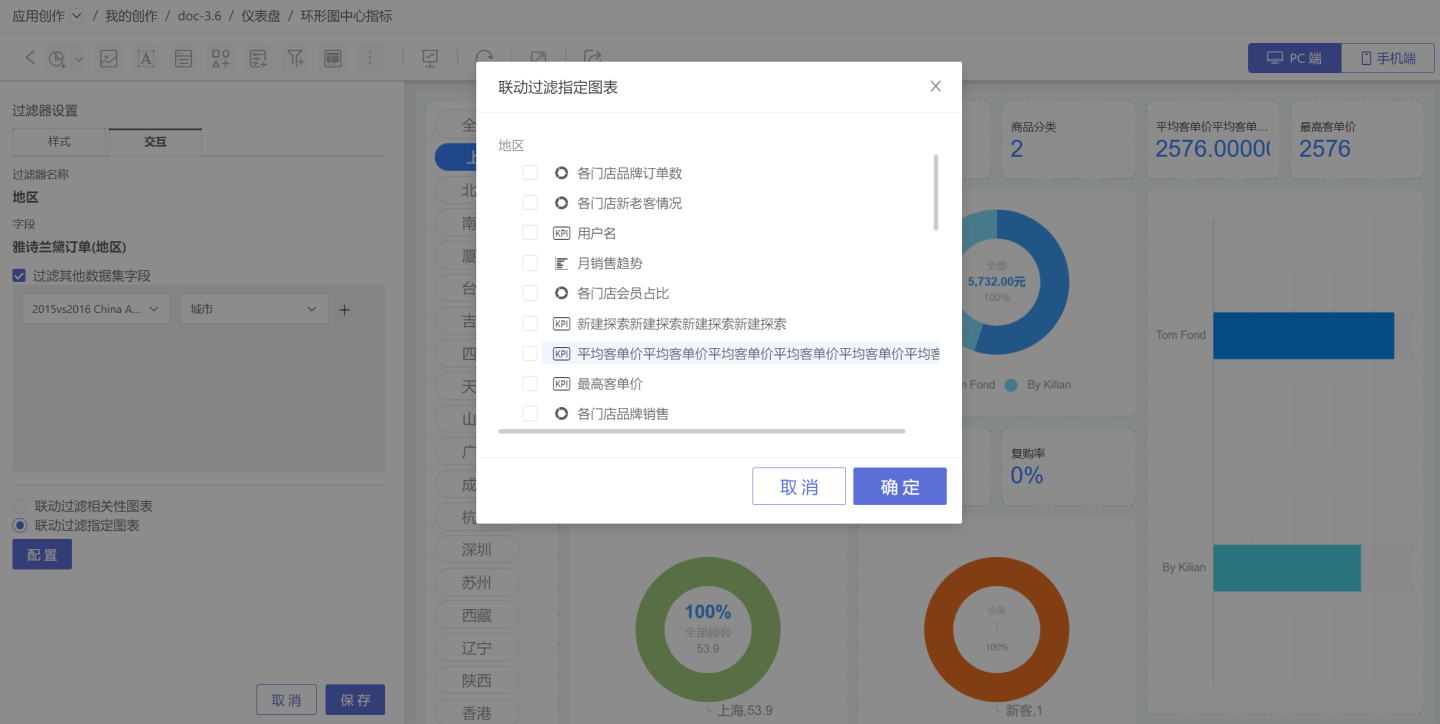
Linkage Filtering for Specific Charts
Linkage filtering for specific charts involves selecting a portion of charts within the related charts for linkage. Unselected related charts will not participate in the linkage.
Note
When configuring linkage filtering for specific charts, all charts in the dashboard will be listed, including related and unrelated charts. Selecting unrelated charts will not enable linkage.
Outer Filtering
By default, filters perform outer filtering, meaning the chart is rendered first, and then the data within the chart is filtered through the filter options. When this feature is disabled, the filter is pushed down to the dataset, meaning the dataset is filtered first before rendering, which can improve query performance.
When the outer filtering feature is disabled, filters are not always pushed down to the dataset in all scenarios.
When Dataset A is used as a child table in the data model:
- If fields from Dataset A are used in the chart, the filters of Dataset A will be pushed down to the dataset.
- If fields from Dataset A are not used in the chart, and Dataset A as a child table has not been renamed, the filters of Dataset A will be pushed down to the dataset.
- If fields from Dataset A are not used in the chart, and Dataset A as a child table has been renamed, the filters of Dataset A will not take effect and will not be pushed down to the dataset.
When Dataset A is used to create an aggregated Dataset B (or other types of derived datasets such as multi-table unions, data aggregations, etc.), and Dataset B is used for charting:
- If aggregated Dataset B has "Inherit Upstream Permissions" enabled, the filters of Dataset A will be pushed down to Dataset B and will affect the related charts.
- If aggregated Dataset B does not have "Inherit Upstream Permissions" enabled, the filters of Dataset A will not be pushed down to Dataset B.
Note
When using a data model for charting and disabling outer filtering, pushing down filters in the model may result in discrepancies between the chart data and the data when outer filtering is enabled. In such cases, please disable the outer filtering feature with caution.
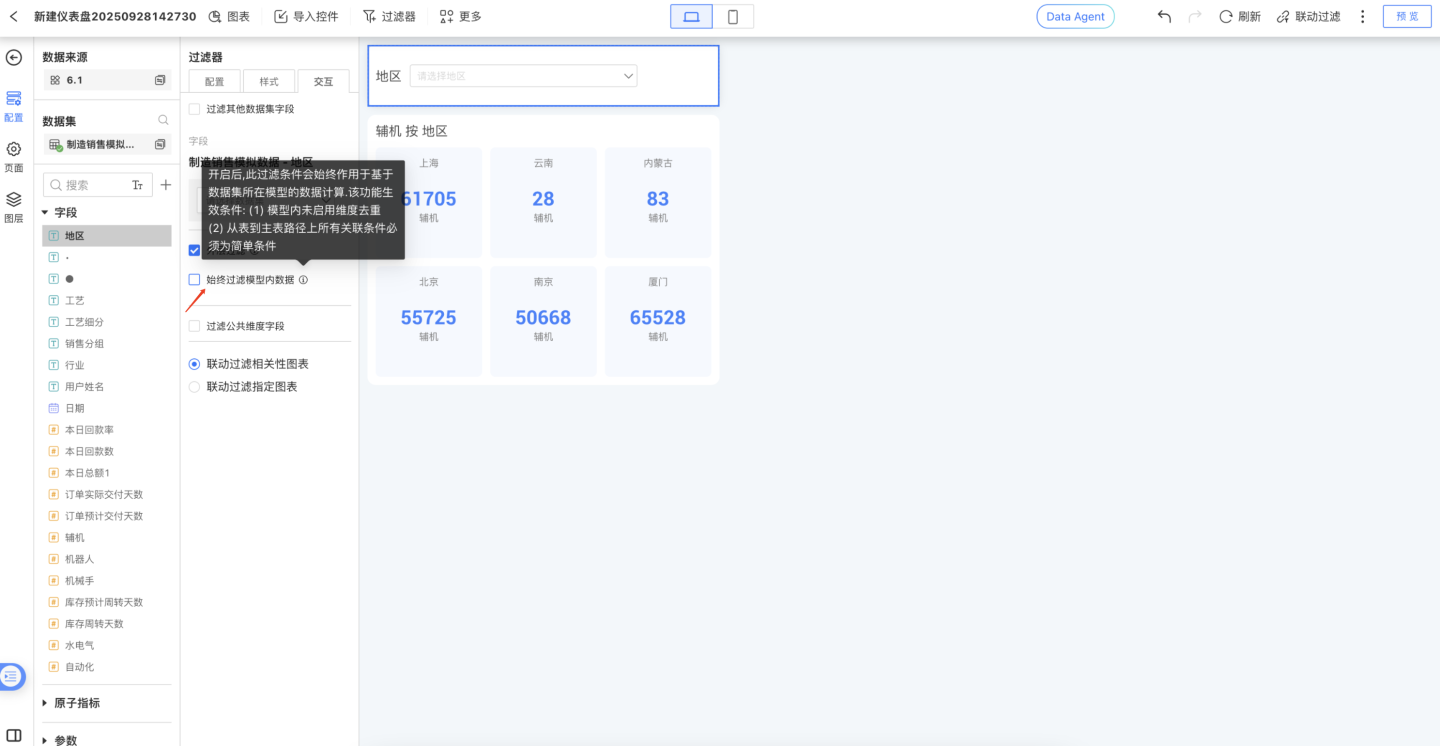
Always Filter Data Within the Model
When data analysts create charts from a data model (as shown in the figure below) and add filters, they may want to use the field values from Branch 1 of the table in the model to filter and affect the related chart data in Branch 2 of the table.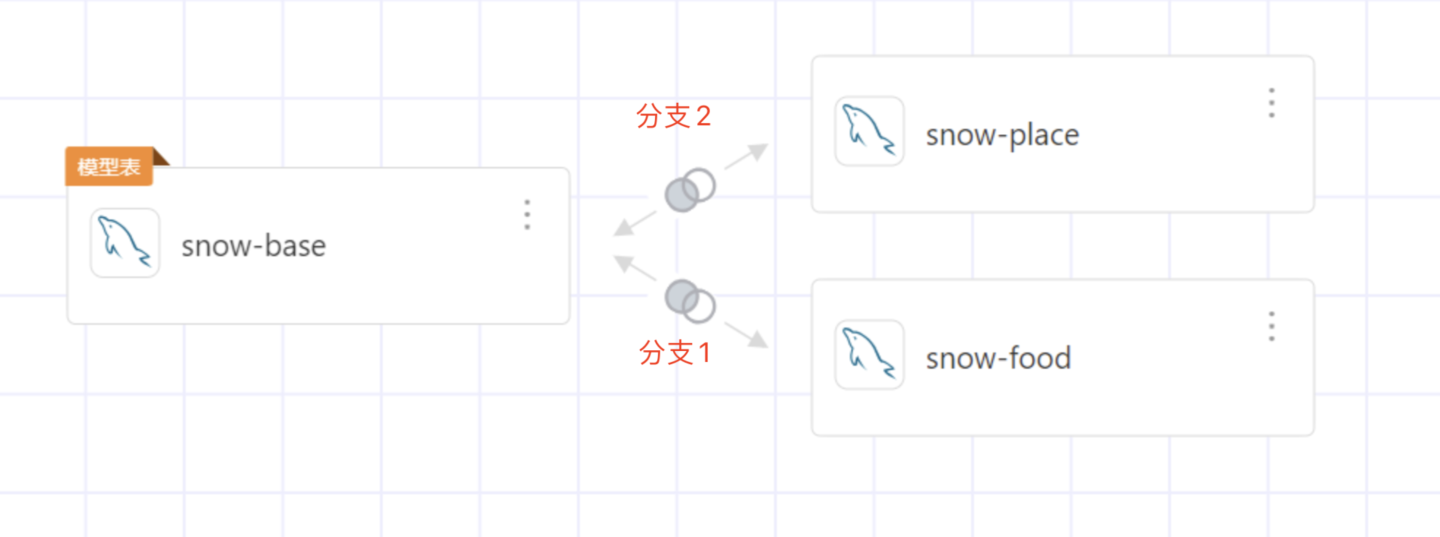
A new checkbox option, Always Filter Data Within the Model, is added to the filter settings. By default, this option is not selected. Tree filters and dynamic tree filters do not support this feature.
Conditions for the feature to take effect:
- The model does not enable dimension deduplication.
- All join conditions on the path from the child table to the main table must be simple conditions.
- There are no filter conditions on the child table.
Global Settings
When there are multiple filters in a dashboard, selecting one filter may require related filters to change accordingly, achieving linkage between filters. For example, when the city "Beijing" is selected, only store information related to Beijing should be displayed in the store filter. 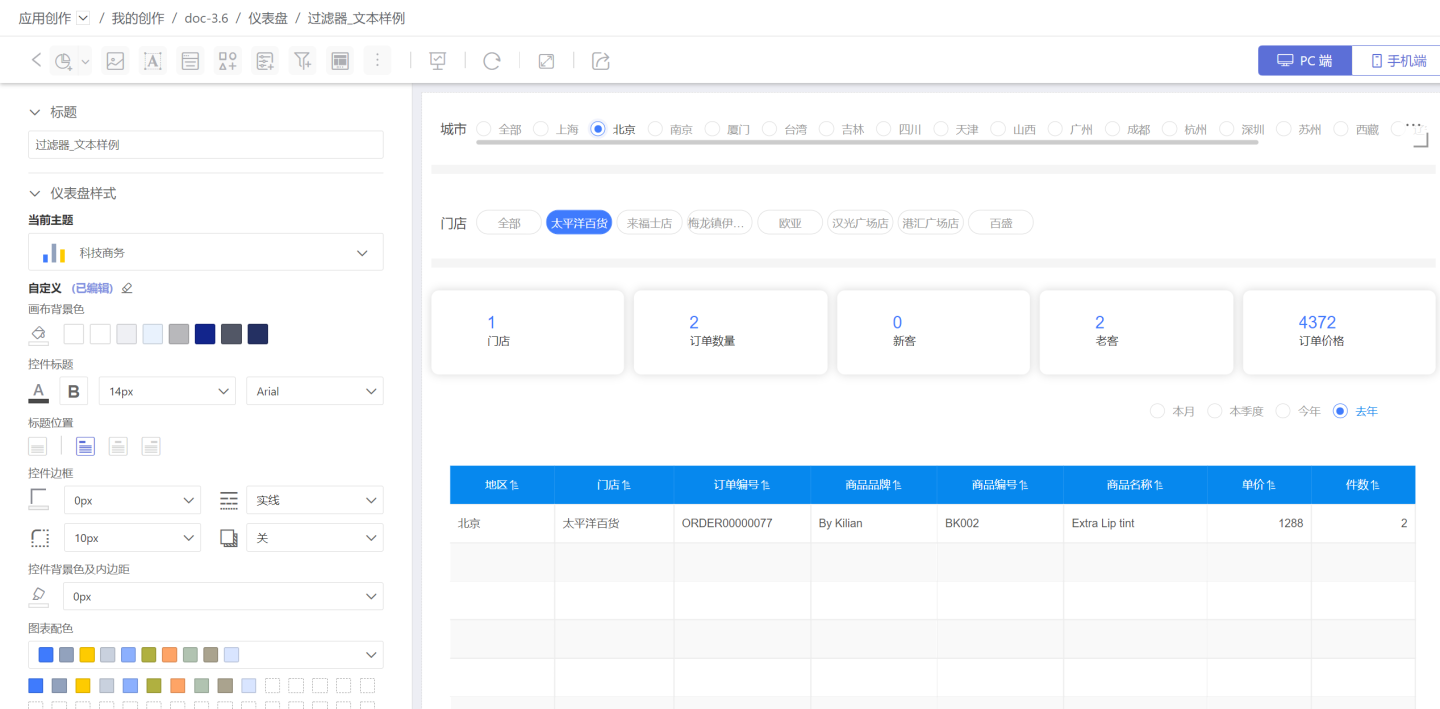
Global settings allow you to adjust the hierarchical relationships between filters to achieve filter association. Click the three-dot menu of a filter and select "Global Settings." A popup will display all filters that can have their hierarchy adjusted. Use the red buttons to move filters up or down, and the blue buttons to adjust their hierarchy. 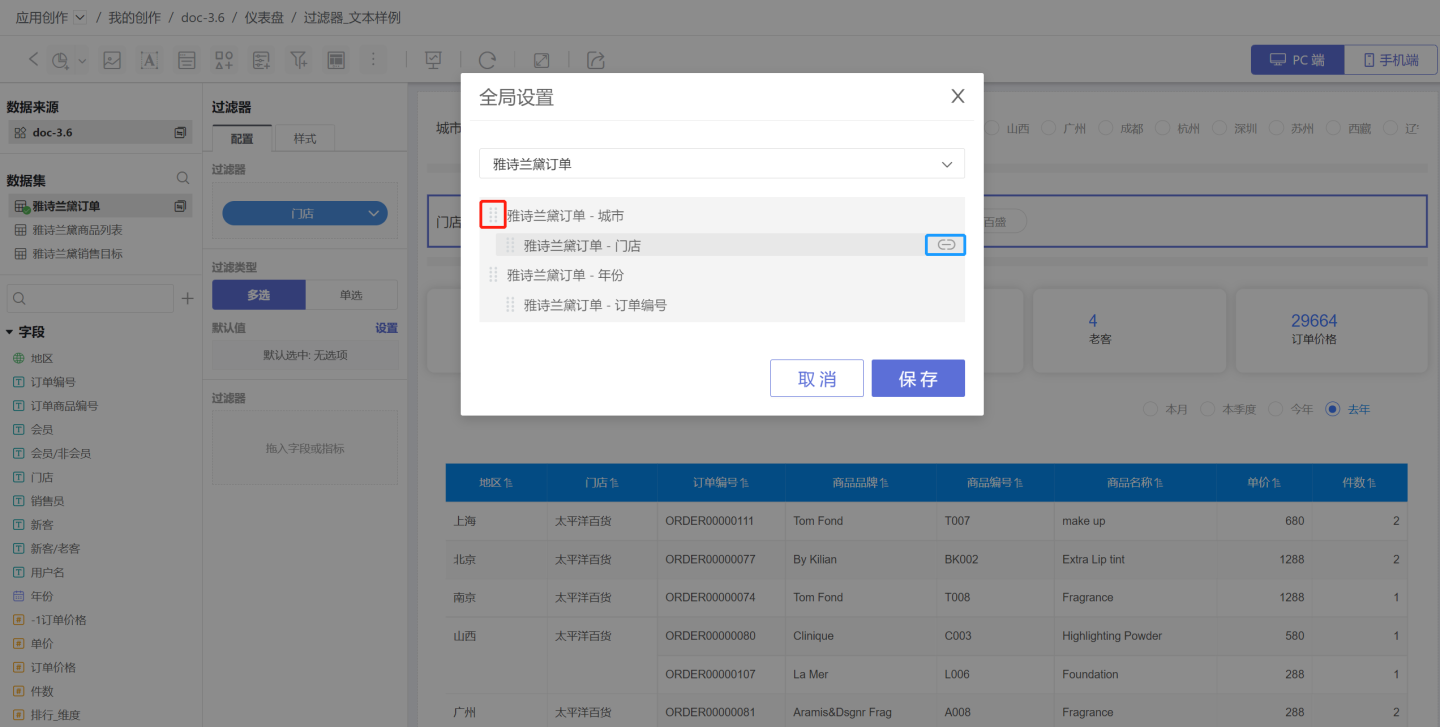 In the example, "City" and "Year" are on the same level and do not affect each other. "City" is the parent of "Store," and "Year" is the parent of "Order." When "City" is set to "Beijing," the store filter will display options related to Beijing, while the "Year" and "Order" filters remain unaffected. Similarly, when "Year" is set to "2019," the order filter will change accordingly, while the "City" and "Store" filters remain unaffected.
Tips
- Global settings change the hierarchical relationships between filters, enabling linkage between filters.
- The default value selection of child filters is influenced by their parent filters. For example, if the default value of "City" is set to "Beijing" and the default value of "Store" is set to "Raffles Store," but "Beijing" does not have a "Raffles Store," the default value will automatically select the first store under "Beijing."
- Hierarchical relationships are merely logical linkage relationships between controls. Even controls from different data sources can have hierarchical relationships set. Parameter controls and filter controls can also have hierarchical relationships set.
- Application-level filter controls or parameter controls are shared across multiple dashboards, so hierarchical relationships are shared across dashboards.
- Filter controls and parameter controls within a dashboard cannot be set as the parent of application-level controls.
Internal Filters
Internal filters refer to adding filters within a filter to control the value range of the filter field.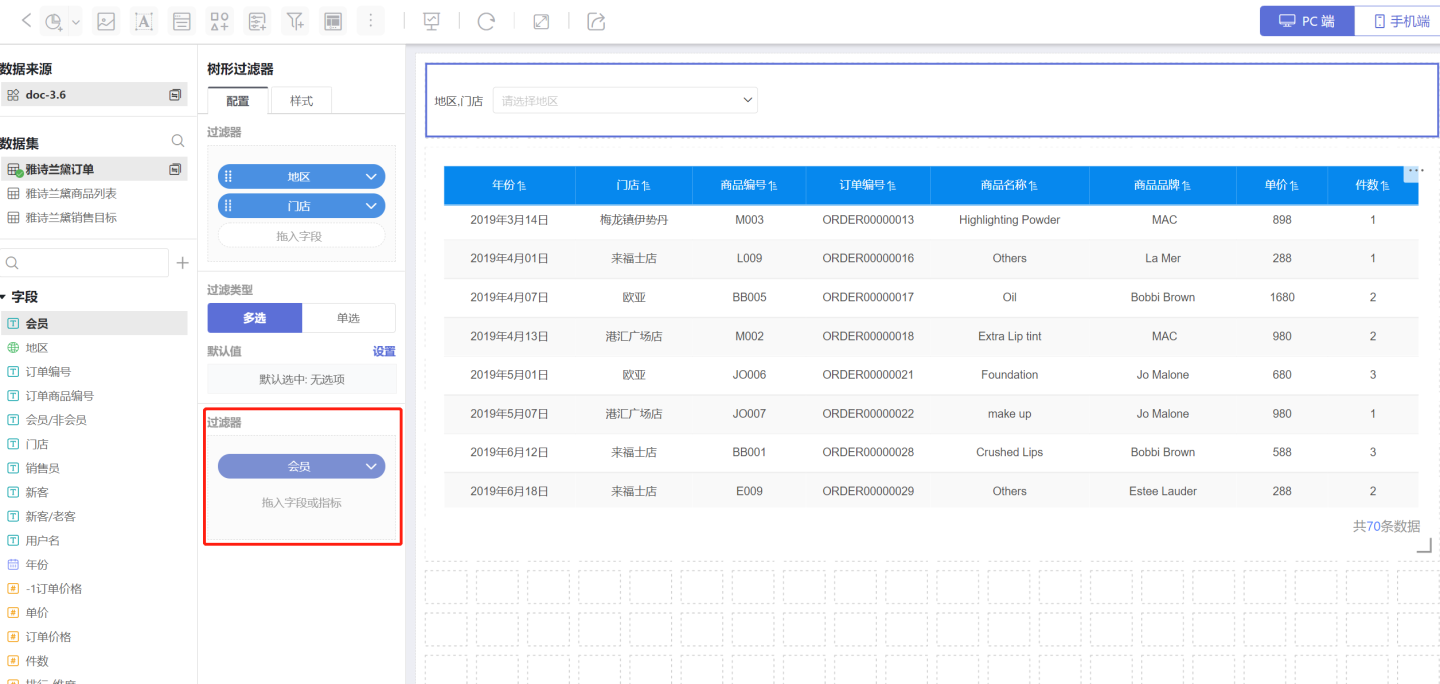
When the filter field is of text type, three methods are supported: Include, Exclude, and Expression.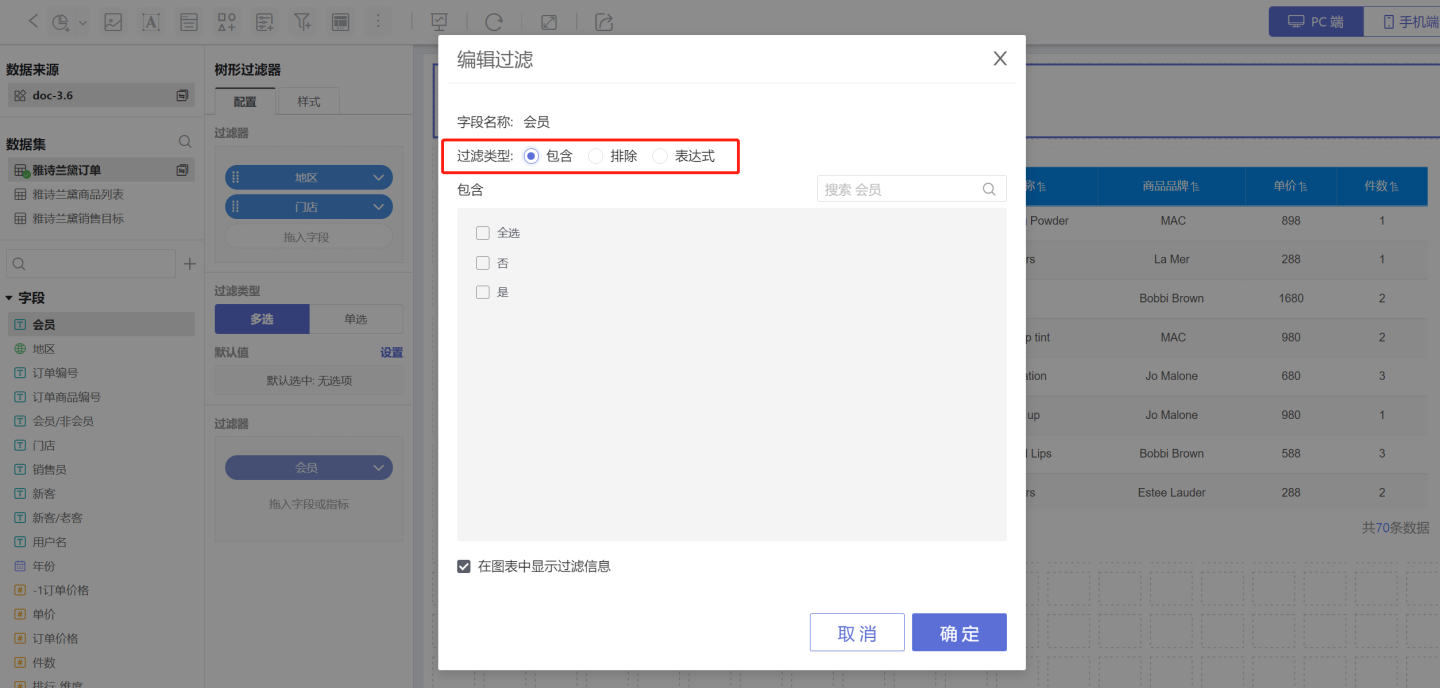
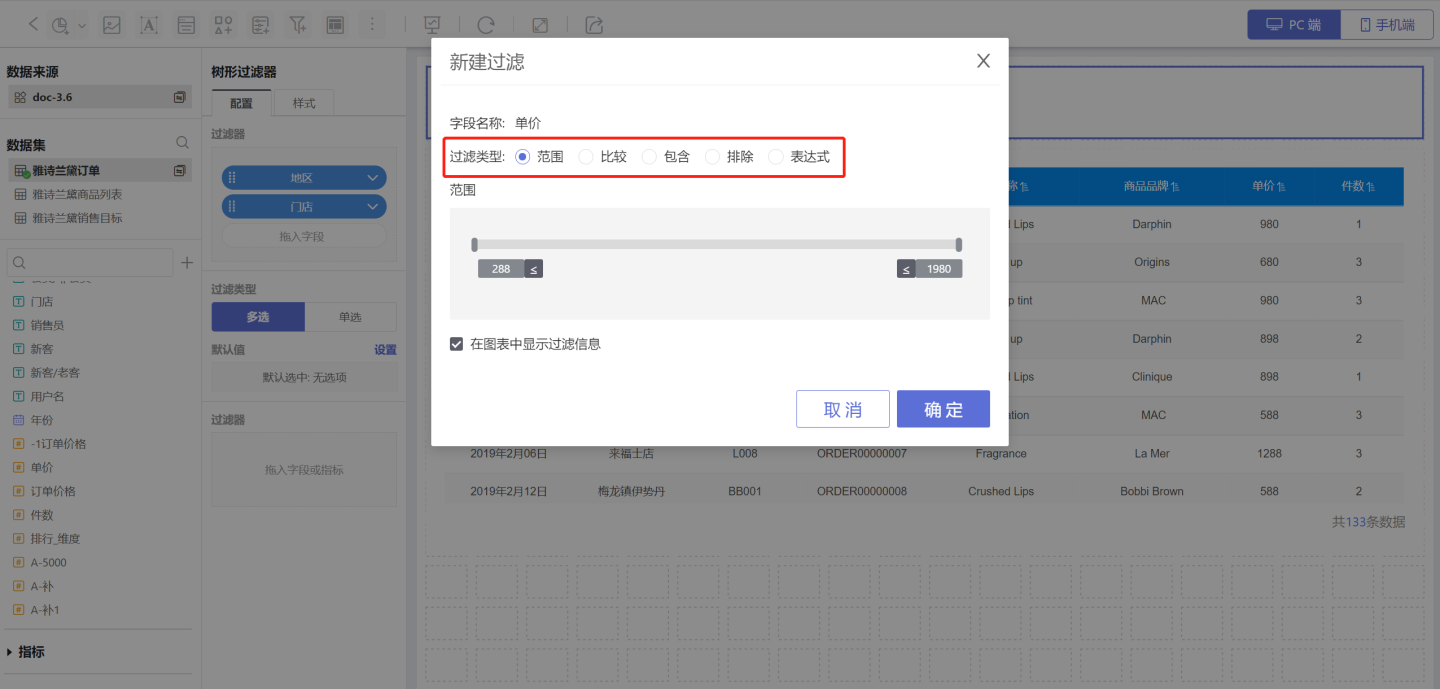
When the filter field is of numeric type, the following filtering methods are supported:
- Range: Set a numeric range. Conditions within the range will be filtered. Boundary values can be included, and manual input is supported.
- Comparison: Set a numeric comparison formula. Conditions that satisfy the formula will be filtered. Comparison types include Not Equal, Equal, Greater Than or Equal, Greater Than, Less Than or Equal, Less Than, Is Null, and Is Not Null.
- Include: Filter conditions based on selected items.
- Exclude: Filter conditions based on unselected items, where selected items are excluded.
- Expression: Use expressions for conditional filtering.
For example, when selecting stores with sales orders where the unit price is greater than 500, different methods can be used for filtering operations: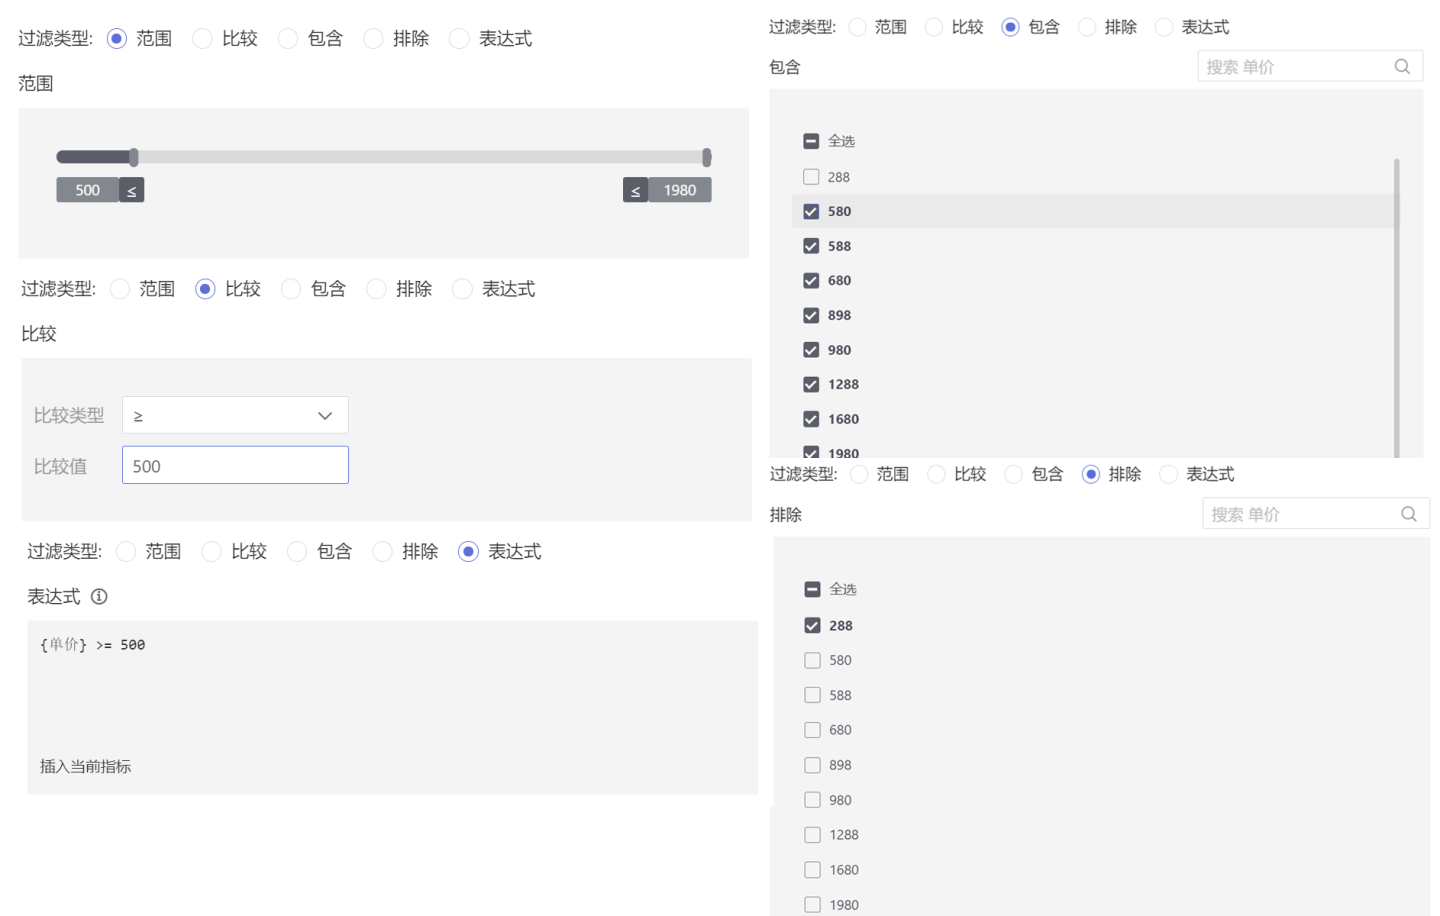
When the filter field is of time type, the following filtering methods are supported:
- Time Period
- By Year
- By Quarter
- By Month
- By Range
- By Expression
Internal filters can be configured to display filter information in the chart. When this option is checked, the information will be displayed when the chart is opened.