Table
Table charts have rich functionalities, capable of displaying complex Chinese-style reports. They support various calculations and statistics on data, allow comparative viewing of metric data, and enable various interactive operations such as linkage and navigation.
Table Creation
Take a product sales order table as an example to introduce the table creation process.
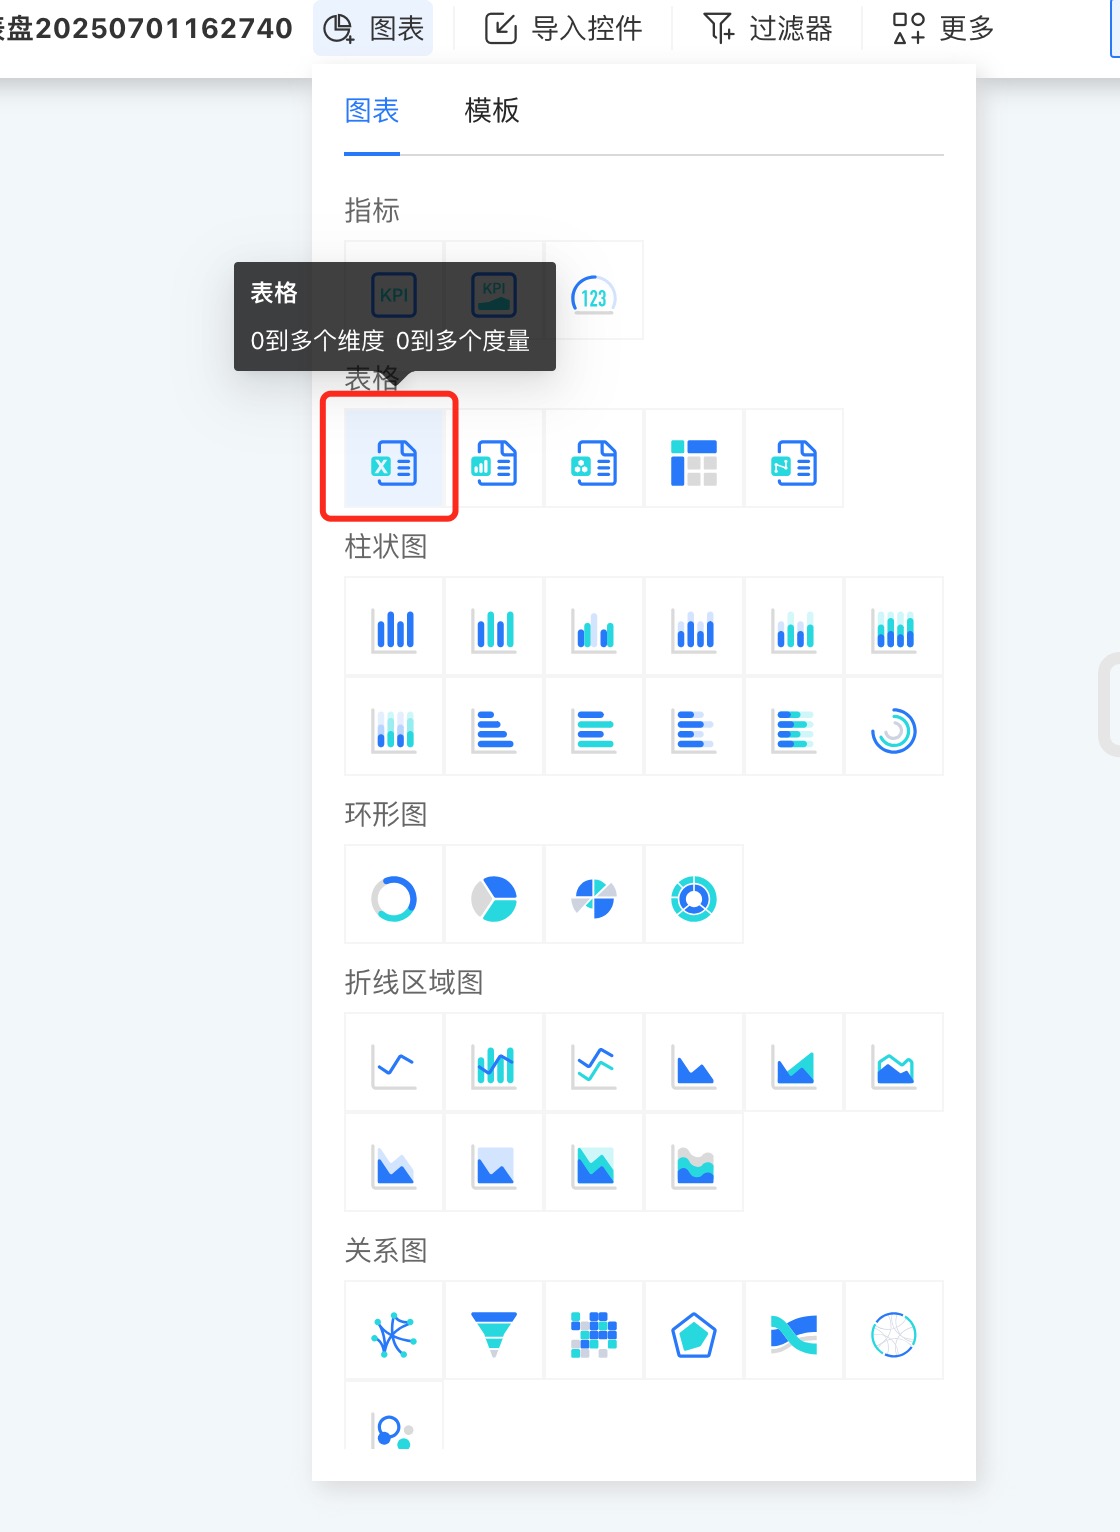
- In the dashboard, click New Chart -> Table, select the data source and dataset, and click Confirm.
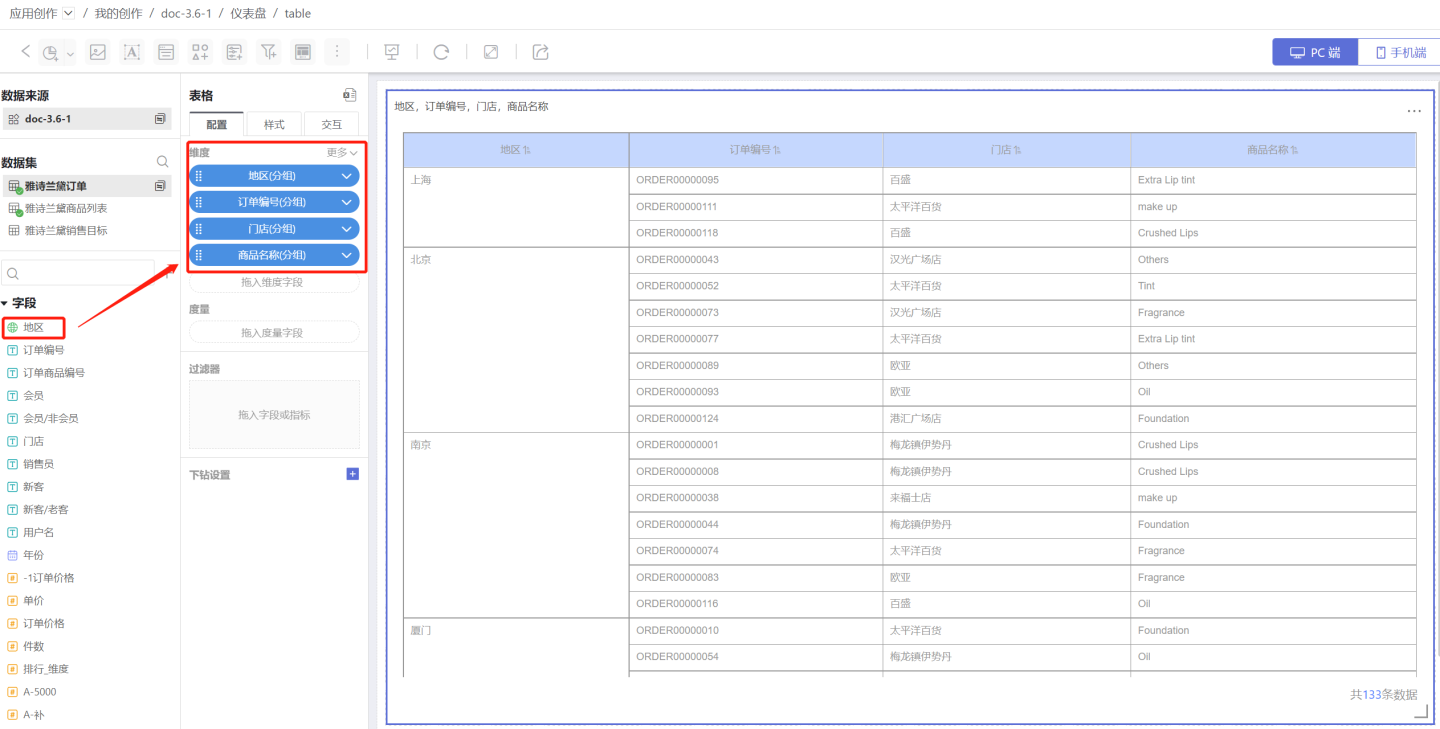
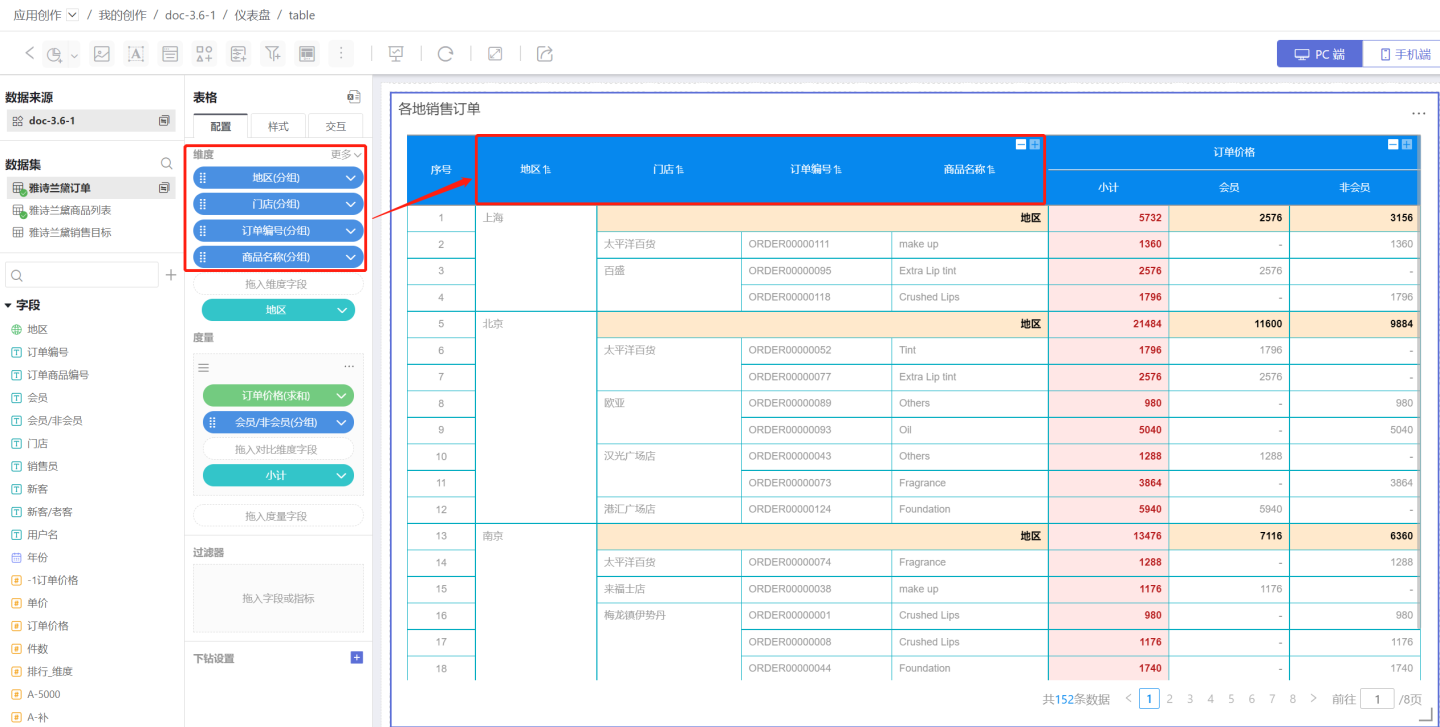
- Drag the fields to be displayed into the dimensions, such as Region, Store, Order Number, and Product Name.
- Drag in the measure fields, such as Order Price, and drag in the comparison dimensions, such as comparing the order prices of members and non-members.
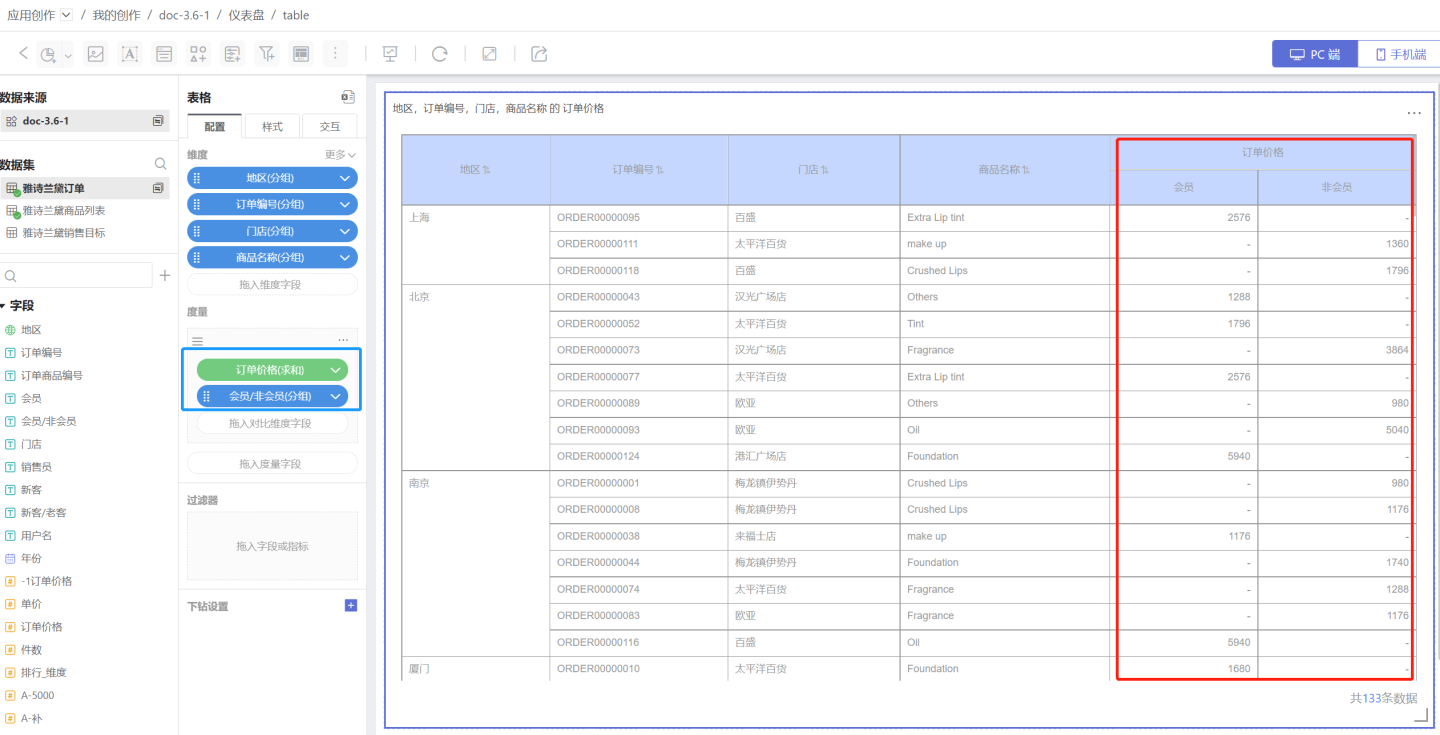
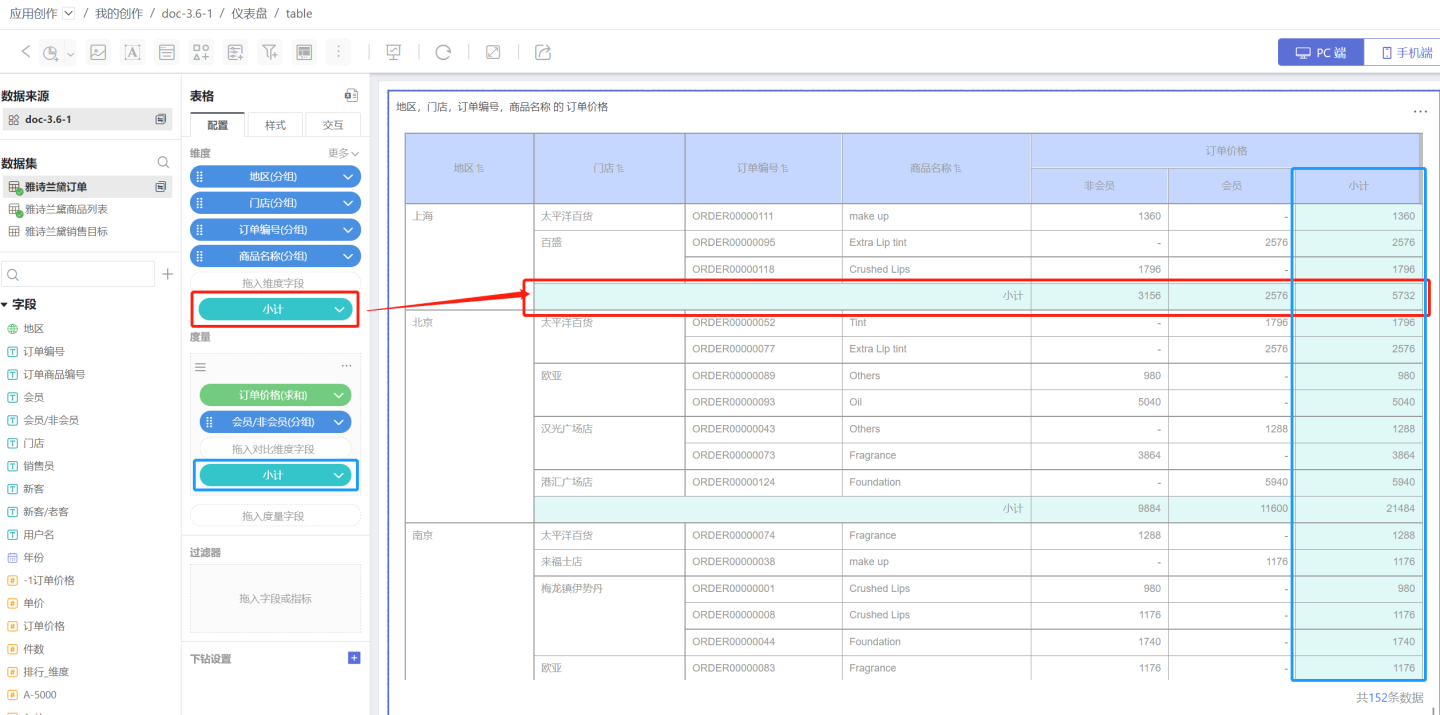
- Add subtotals to display statistical information. Dimension subtotals (red box) calculate the total sales of malls in each region. Comparison dimension measure subtotals (blue box) calculate the sales orders of members and non-members. The basic configuration of the table is now complete.
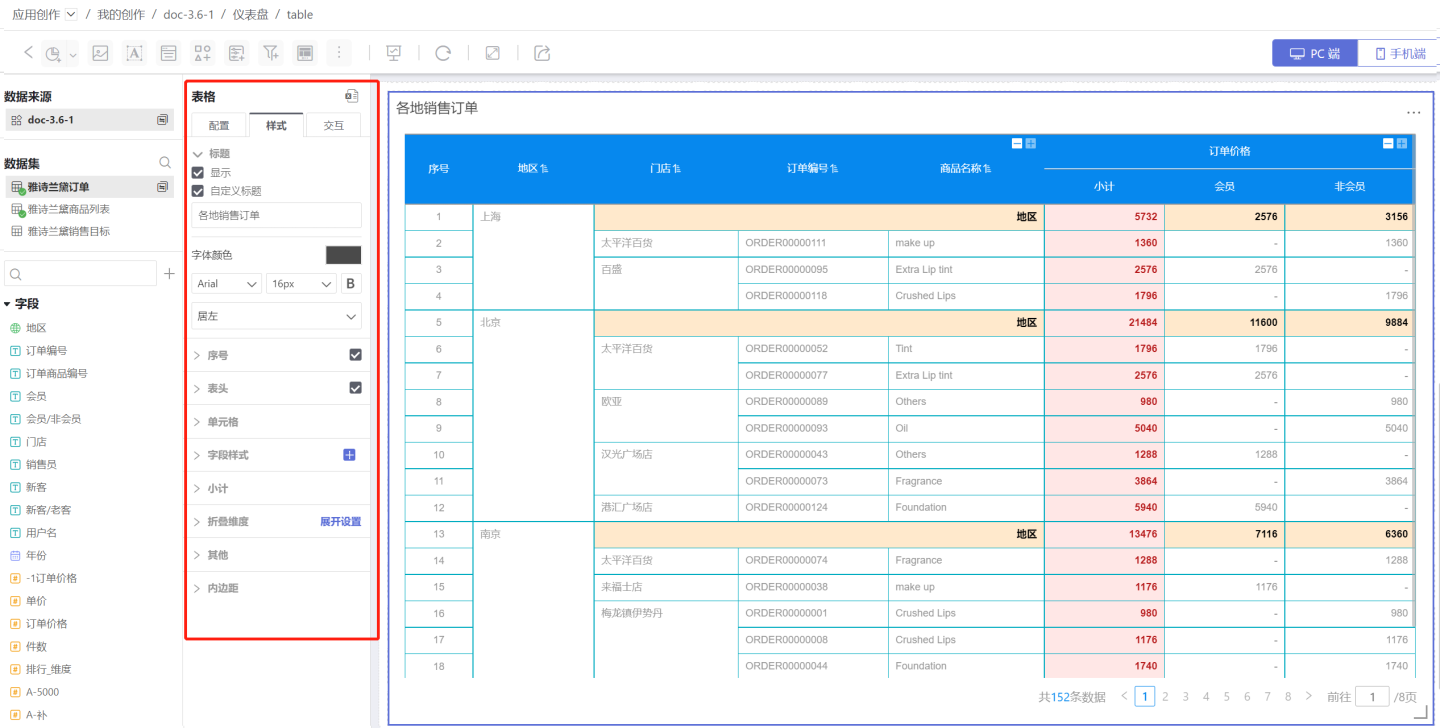
- Configure the Table Style, adding serial numbers, setting the header and cell colors, and adjusting the position and style of the subtotals.
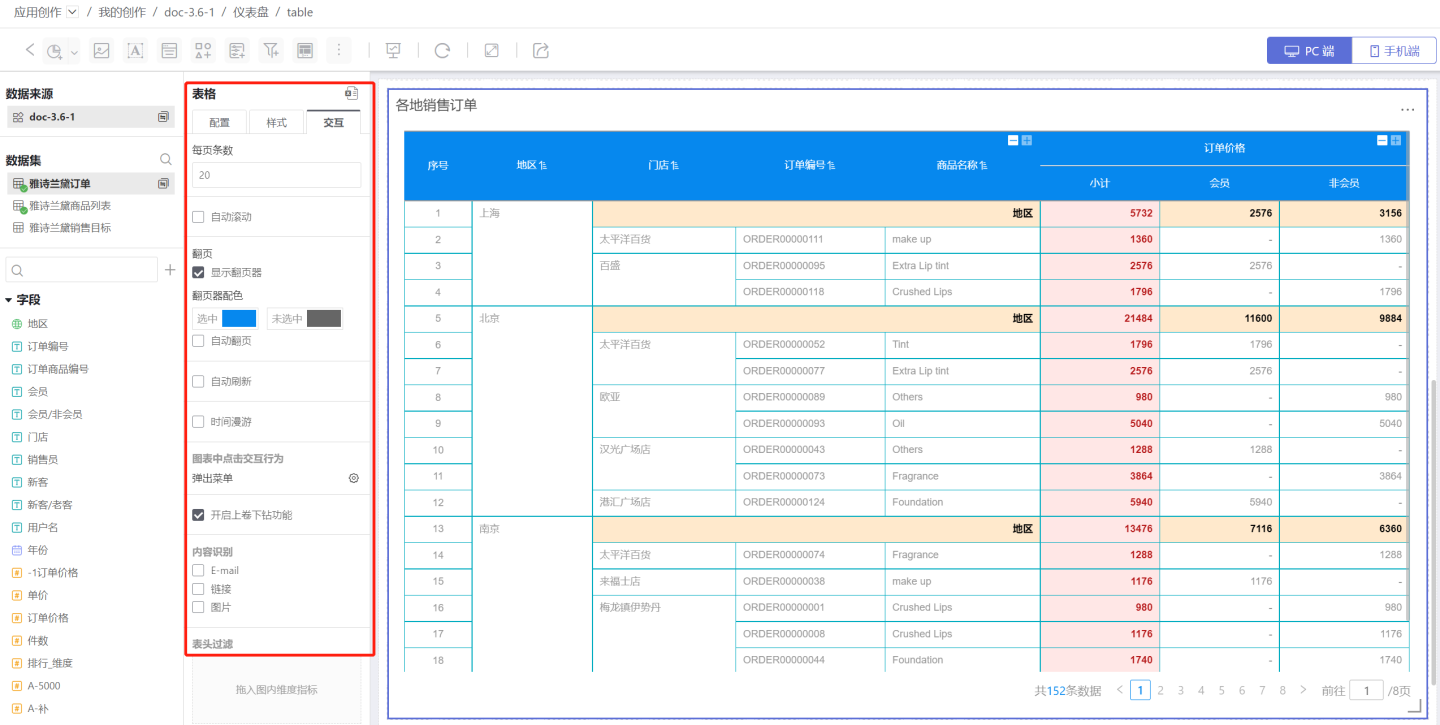
- Configure the table's Interaction Features. In the example, the number of rows displayed per page is set to 20, a pager is added, the roll-up and drill-down features are enabled, and the interaction behavior after opening the table is configured.
- Configure the style of the table controls and their interaction with other charts. In the example, the chart is set to jump to the ranking dashboard.
For details, see Interaction.
Configuration
The above example briefly introduced the table creation process. Below is a detailed introduction to the table configuration options.
Dimension
Add Dimensions
- You can add multiple dimensions in sequence. The first dimension is the primary dimension, and the subsequently added dimensions are secondary dimensions. The order of dimensions can be adjusted.
- All dimensions are arranged from left to right in order at the far left of the table header, following the principle of dimensions first and measures later.
- Users can customize and modify the names of the dimensions.
Dimension Sorting
Dimension sorting includes: sorting by this dimension, sorting by pinyin of this dimension, sorting by specified field, in-chart measure, and manual sorting. When there are multiple dimension sorting methods, the primary dimension is sorted first, and the secondary dimension is sorted based on the sorting result of the primary dimension.
Sorting by This Dimension
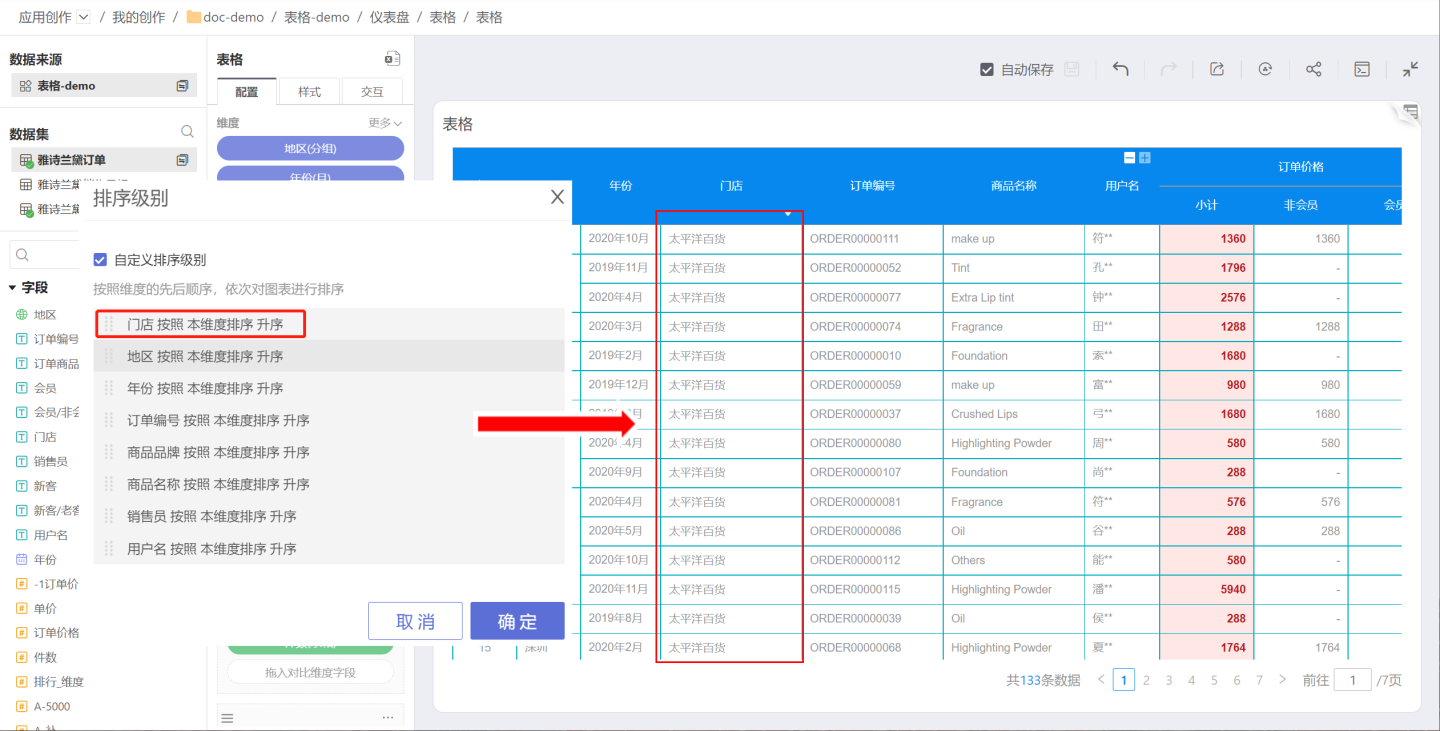
Refers to the order of this column within the dataset. For example, as shown in the figure, the ascending order of the region by this dimension is Shanghai, Beijing, Nanjing, which is the same as the ascending order of this column in the dataset.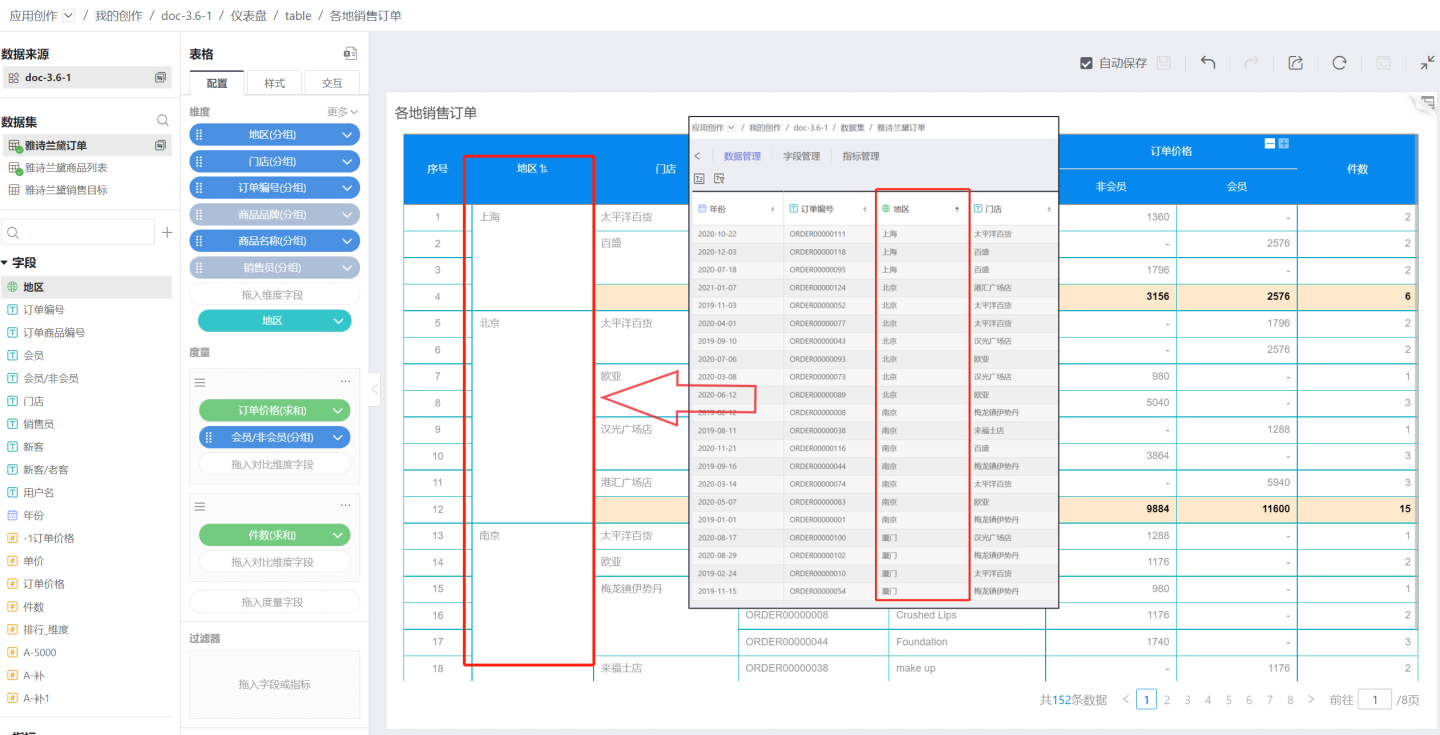
Sorting by Pinyin of This Dimension
Text-type fields are sorted alphabetically (A-Z) by pinyin. Date-type and numeric-type dimension fields do not have alphabetical sorting.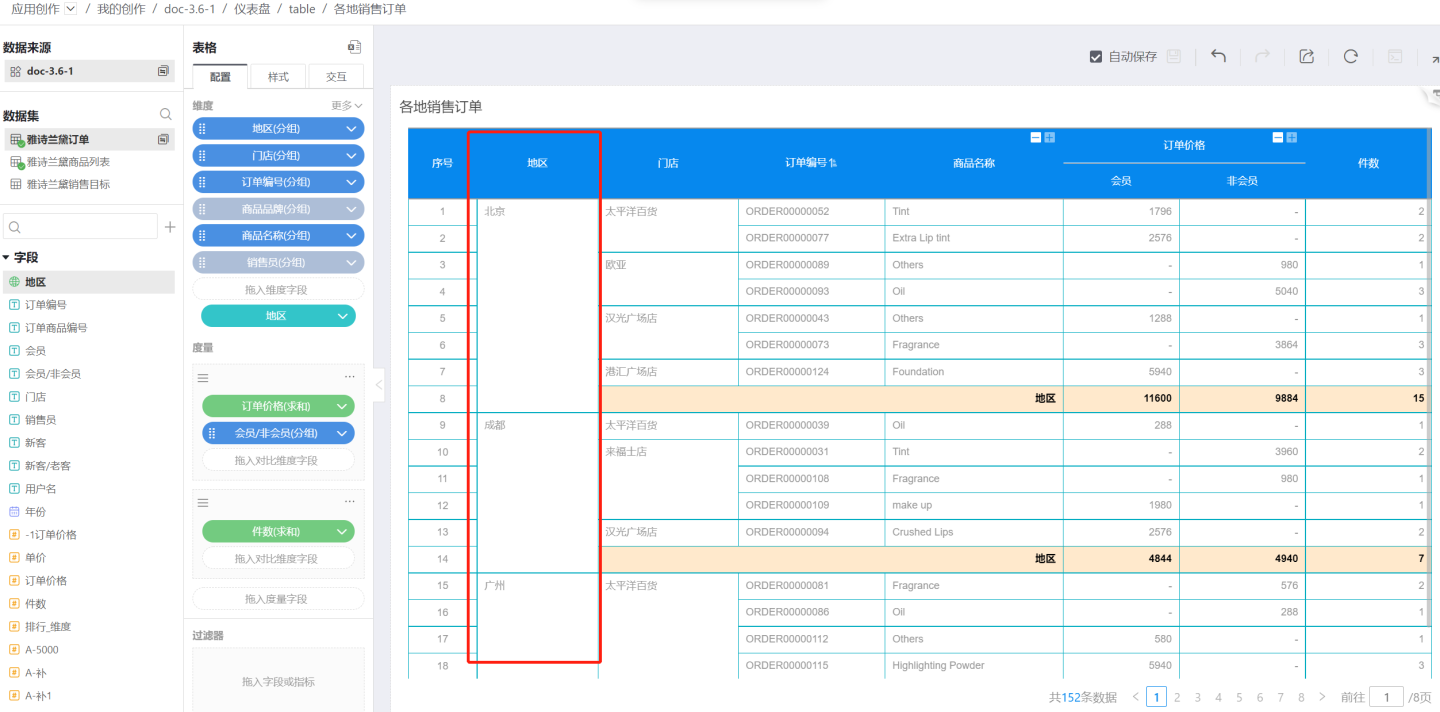
Sorting by Specified Field
You can select a field from the same dataset or a related dataset, specify an aggregation method, and sort the dimension based on the aggregated result.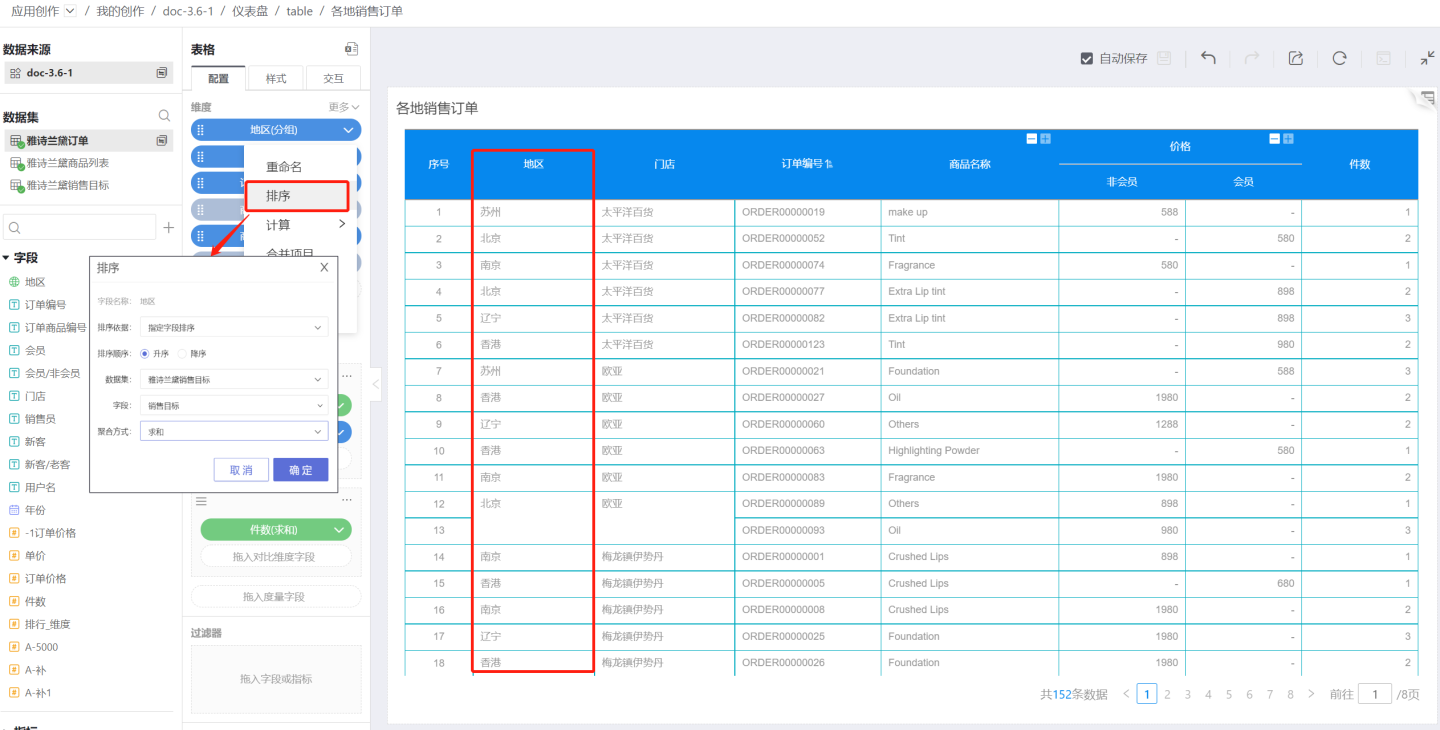
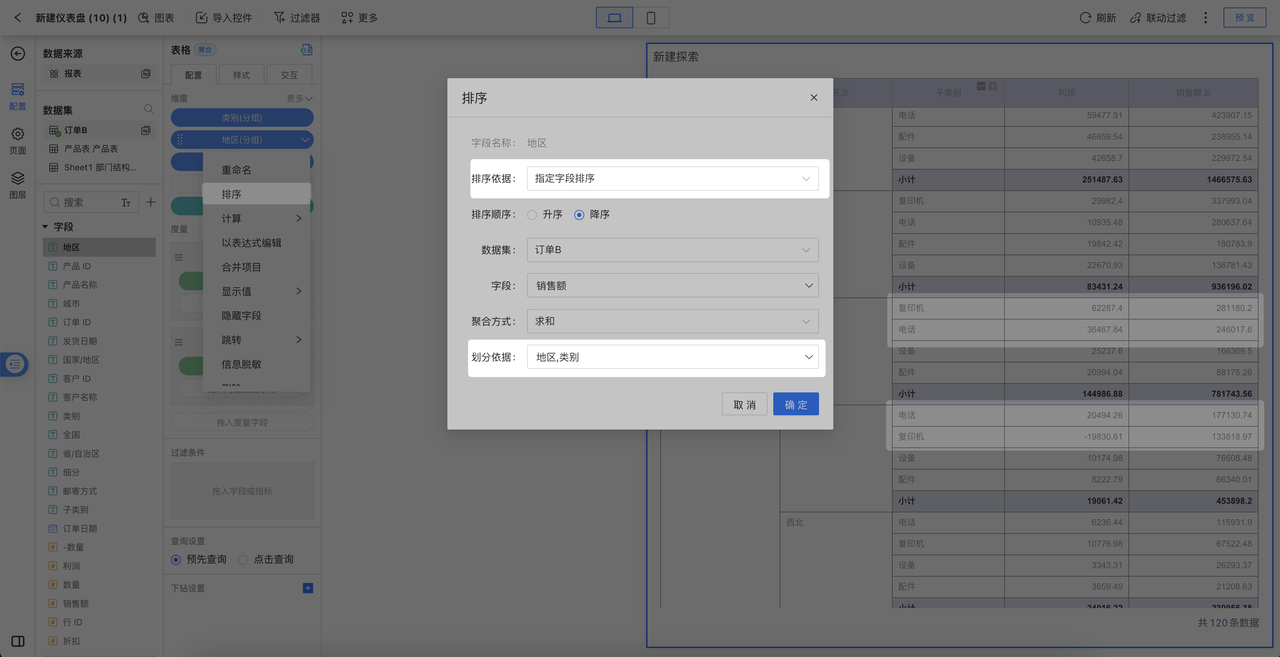
By default, the operation in sorting by specified field is performed globally for the current dimension. If you want to keep subtotals and details sorted together while allowing independent sorting by the specified field within multiple groups, you can use the partition basis setting in sorting by specified field.
In-Chart Measure
Use a measure within the table as the sorting basis. When the measure has a comparison dimension, it cannot be used as a sorting basis. For example, in the figure, the price measure already includes a comparison dimension, so it cannot be used as a sorting basis.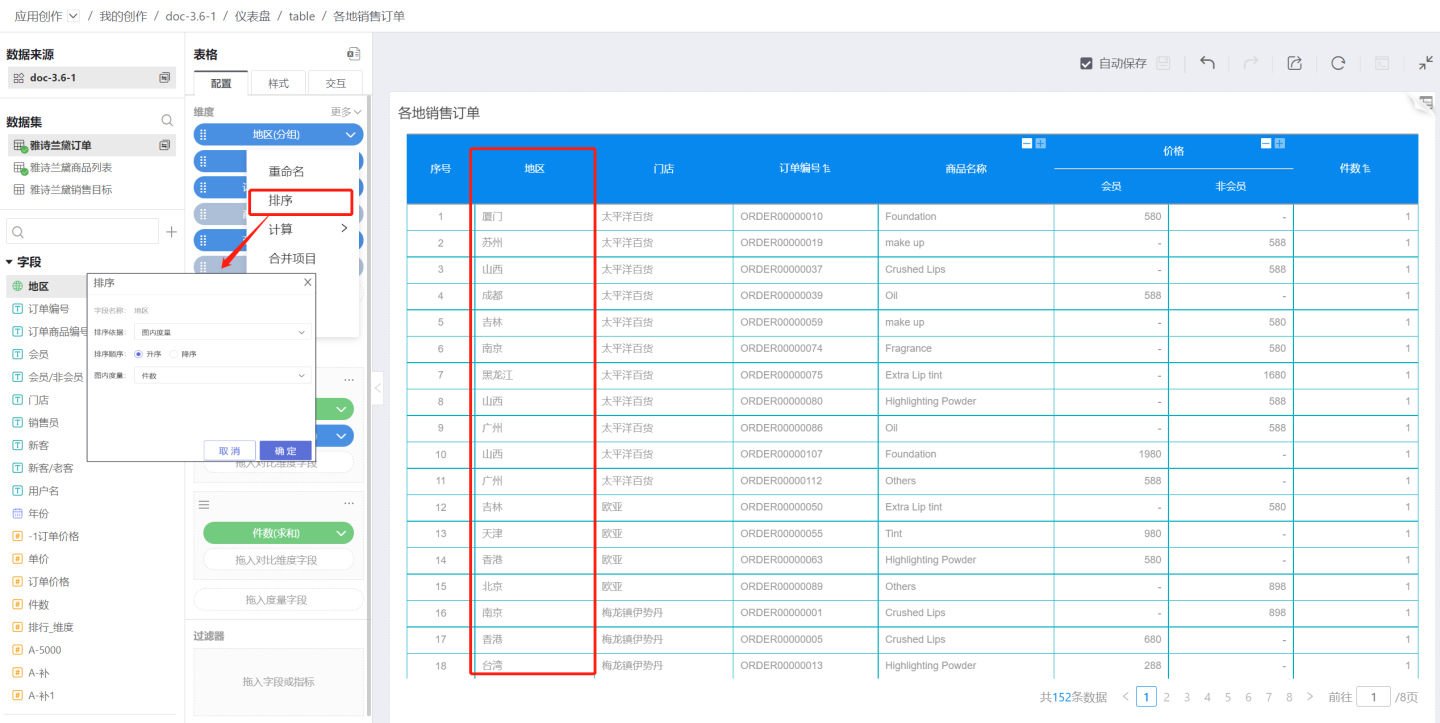
Manual Sorting
You can manually adjust the order of dimension groups.
Tip
When the number of sorting field options is less than 254, the exported table data is consistent with the sorting. When the number of sorting field options exceeds 254, the exported table data is inconsistent with the sorting.
Hidden Fields
Hidden fields refer to fields that are not displayed in the table. In data analysis scenarios, some fields that do not need to be displayed might be passed as parameters to the next report during actions like navigation or drill-down. Such scenarios can be achieved using hidden fields. Once a field is set as hidden, it will be grayed out and removed from the list. However, hidden fields still exist in the detailed data and can be exported from it.
Hiding Dimension Fields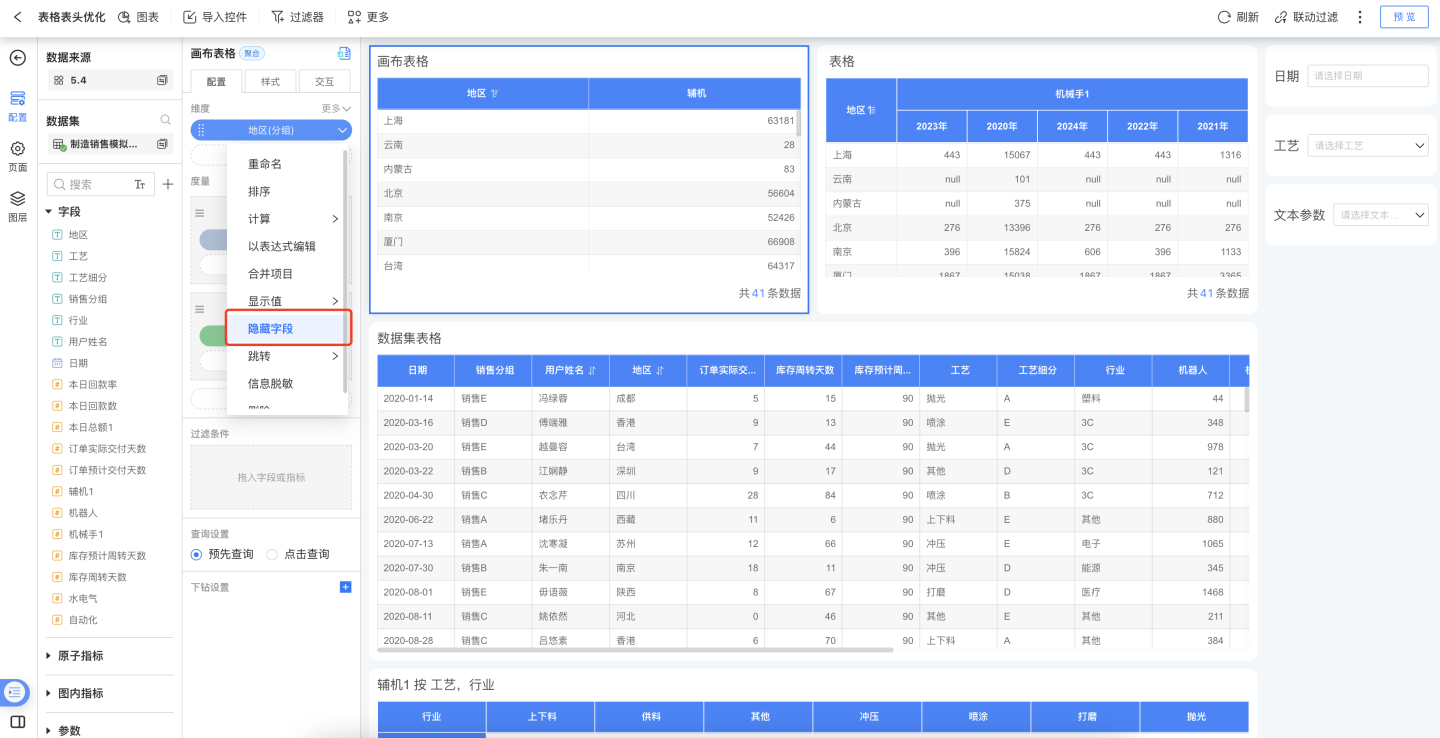
Hiding Measure Fields
When a data analyst creates a table and wants to use a measure field as the basis for conditional formatting but does not want to display the measure field in the table, this can be achieved by hiding the measure field.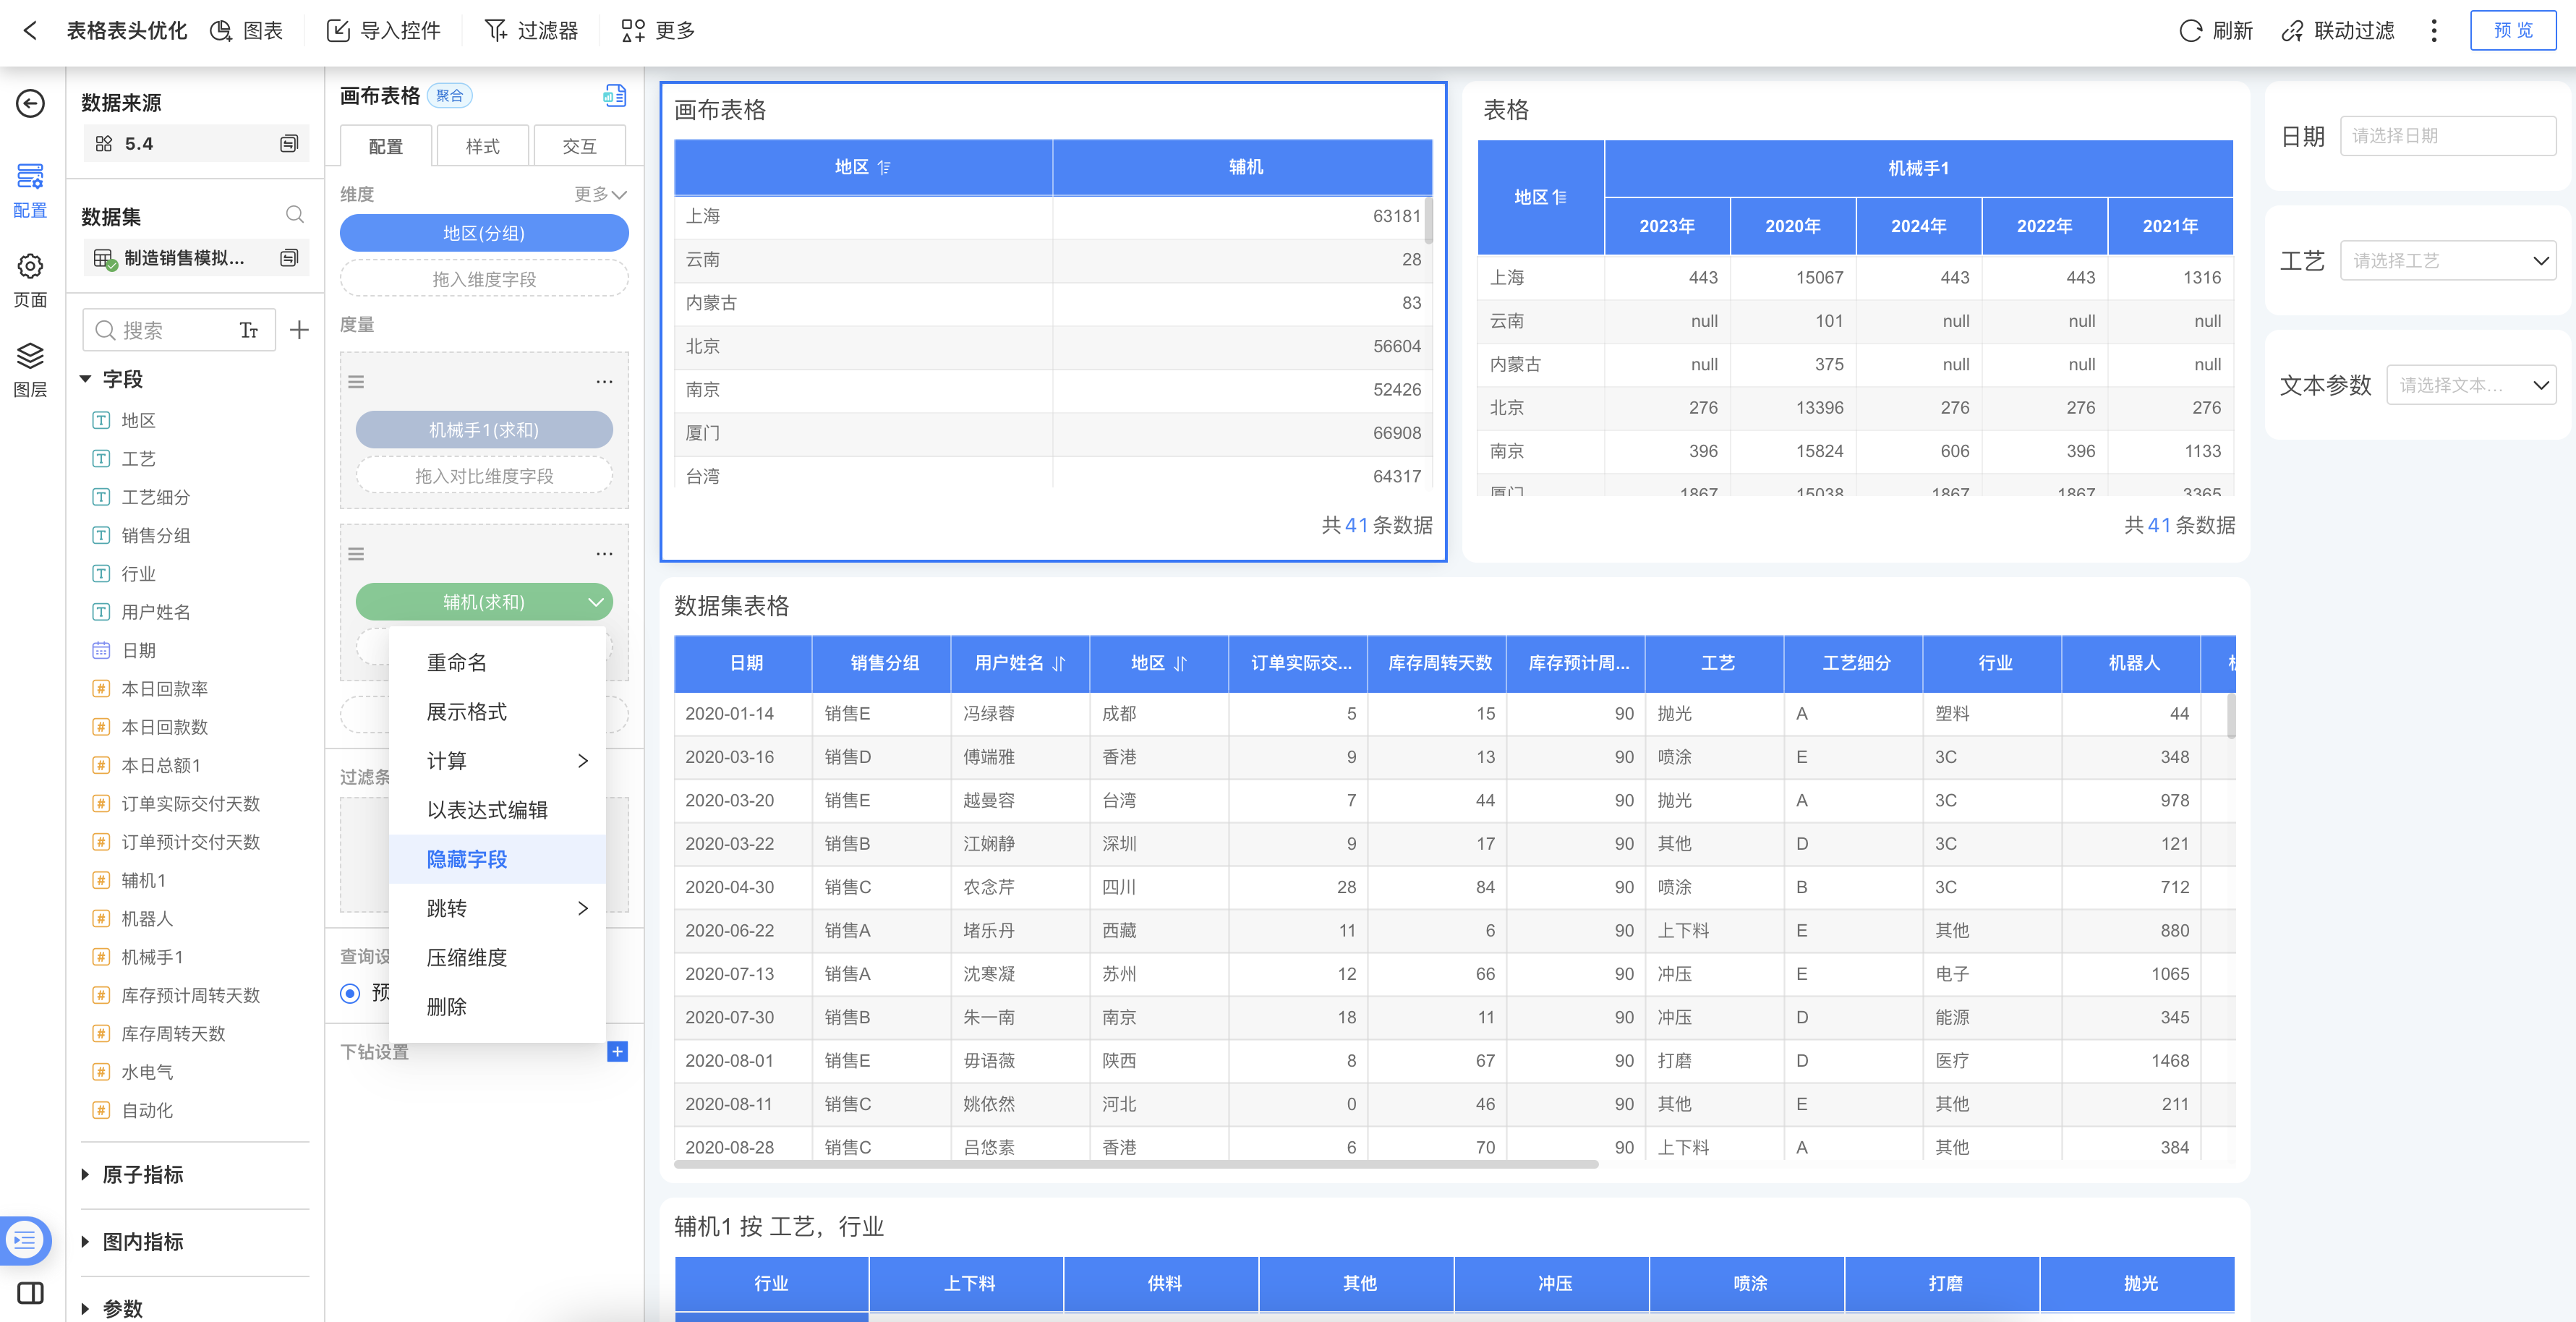
Field Navigation
In a table, different columns may need to navigate to different destinations. For example, clicking the store column in the table below should navigate to the national store summary page, while clicking the product name column should navigate to the product display page. This can be achieved through field navigation.
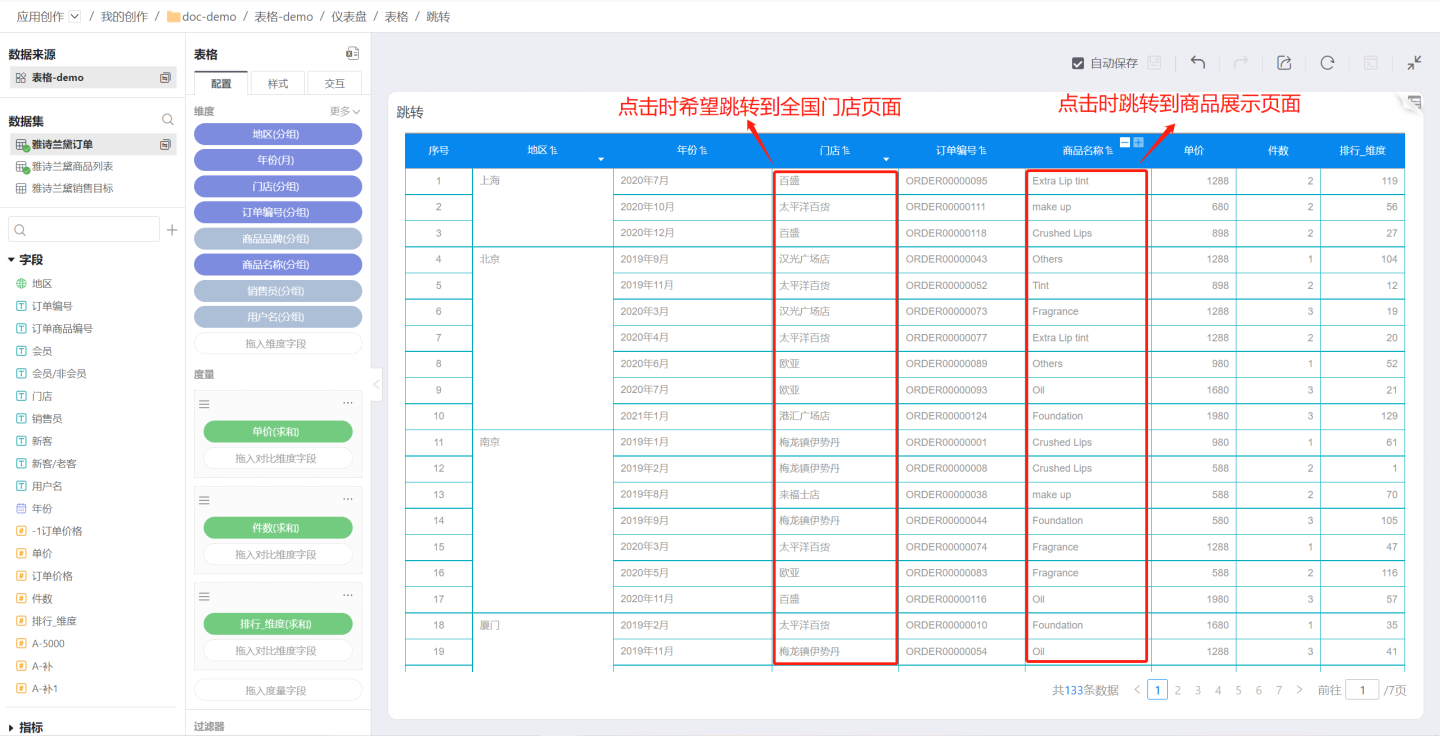
Tables support setting field navigation, control navigation, or both simultaneously.
Set single field navigation.
Click the dropdown arrow on the right side of the field, then click "Navigate" to set the navigation interaction content. In the example, navigation is set for the store and product name fields. Clicking the store navigates to the national store summary page, and clicking the product name navigates to the product display page. After setting field navigation, a navigation indicator will appear on the field.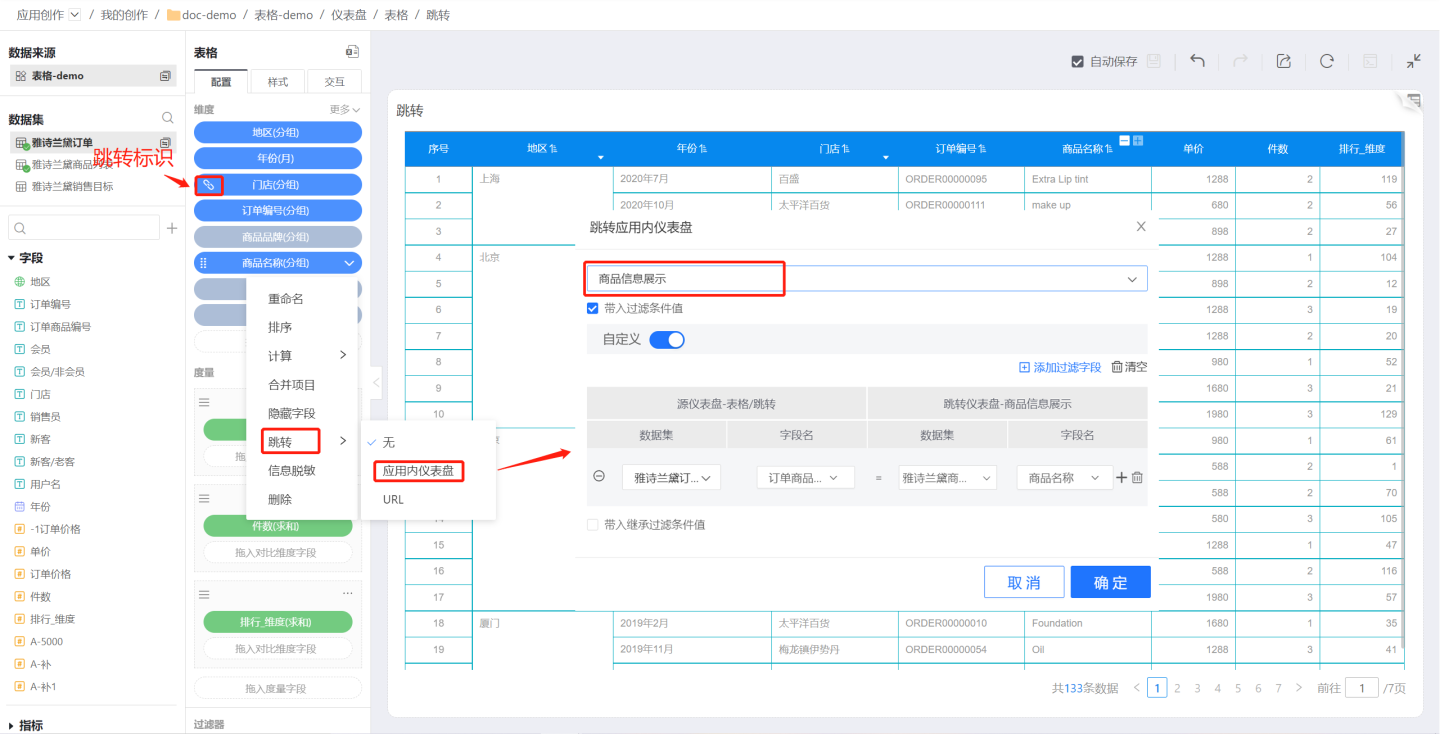
Set table control navigation.
Click the control settings in the three-dot menu of the table, and set the navigation interaction content on the interaction page. In the example, the table is set to navigate to the product information display page. Clicking any cell in the table will navigate to the product information display page.
See Interaction for details.Set both types of navigation simultaneously.
The table can simultaneously set single field navigation and table control navigation. Simply set them separately using the methods described above, with no specific order required. For example, in the case where navigation is set for the store field and table control navigation is set, clicking the store field navigates to the national store summary page, while clicking other columns in the table navigates to the product information display page.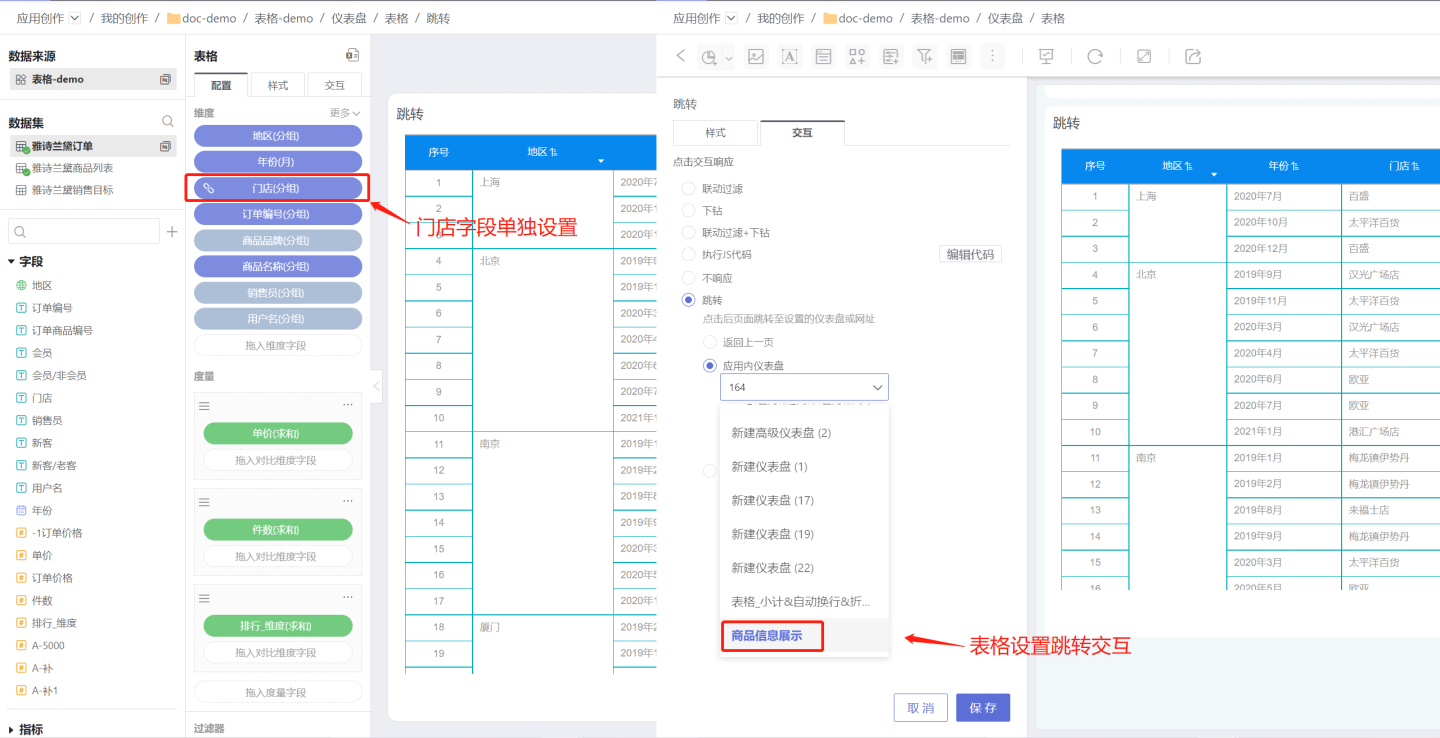
Tips
- The navigation content settings for field navigation and table control navigation are the same. For detailed settings, please refer to the Control Settings -> Navigation section.
- Navigation settings only apply to cells. Clicking a cell triggers the navigation operation, while clicking the table header does not.
- Table control navigation applies to all fields in the table. When a specific field is set for navigation, that field will no longer be affected by table control navigation.
- Comparative dimensions in measures do not support field navigation settings.
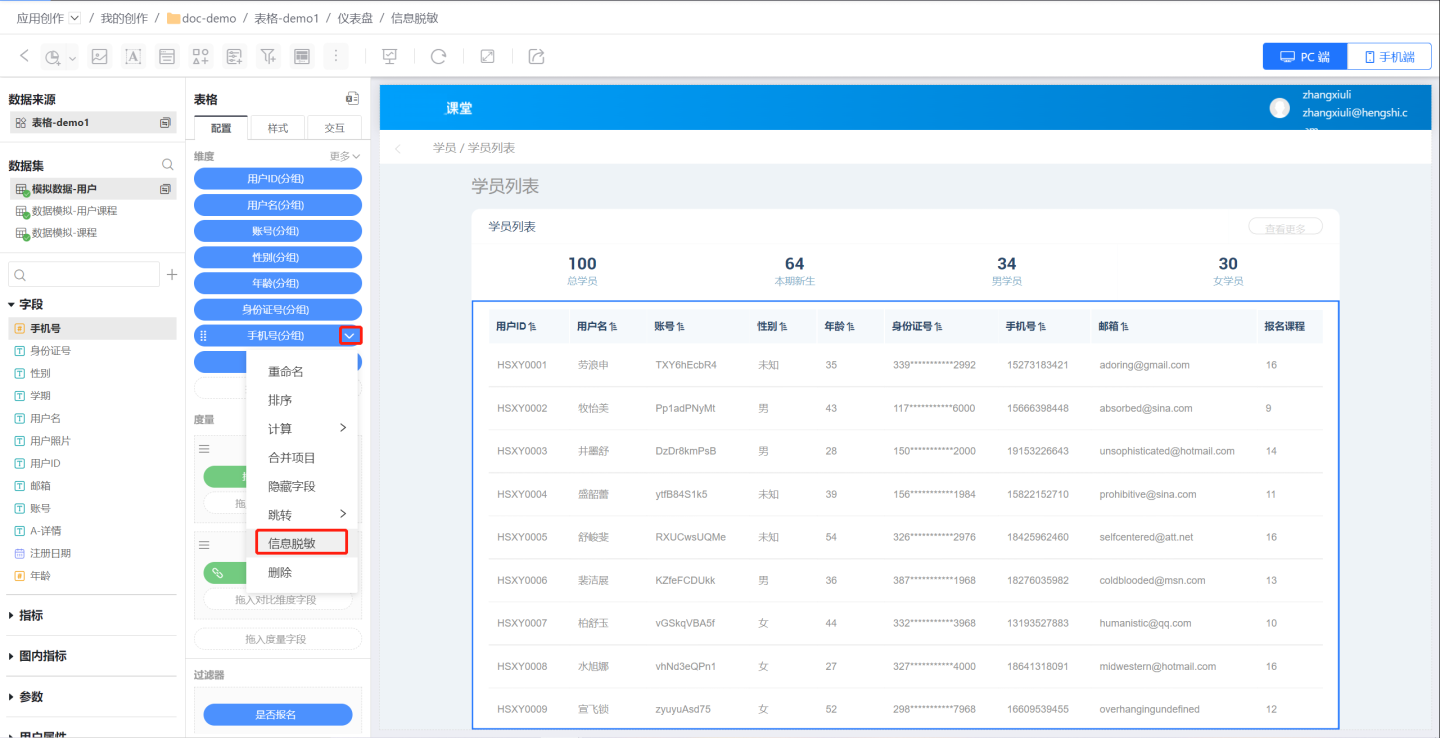
Information Masking
Tables often contain sensitive information such as card numbers, phone numbers, and ID numbers. To protect user privacy, these pieces of information need to be masked when displayed. The system supports masking table content, allowing users to configure masking settings as needed. Various masking methods are supported, including custom masking configurations.
Below is a guide on how to set up information masking.
Select the field that requires information masking, click the dropdown menu on the right, and enter the information masking settings interface.
Configure information masking.
First, set the masking content.
The "Preserve" setting specifies which parts of the field content will not be masked, while the rest will be masked. In the example, the first 3 characters and the last 4 characters are preserved, while the middle content is masked.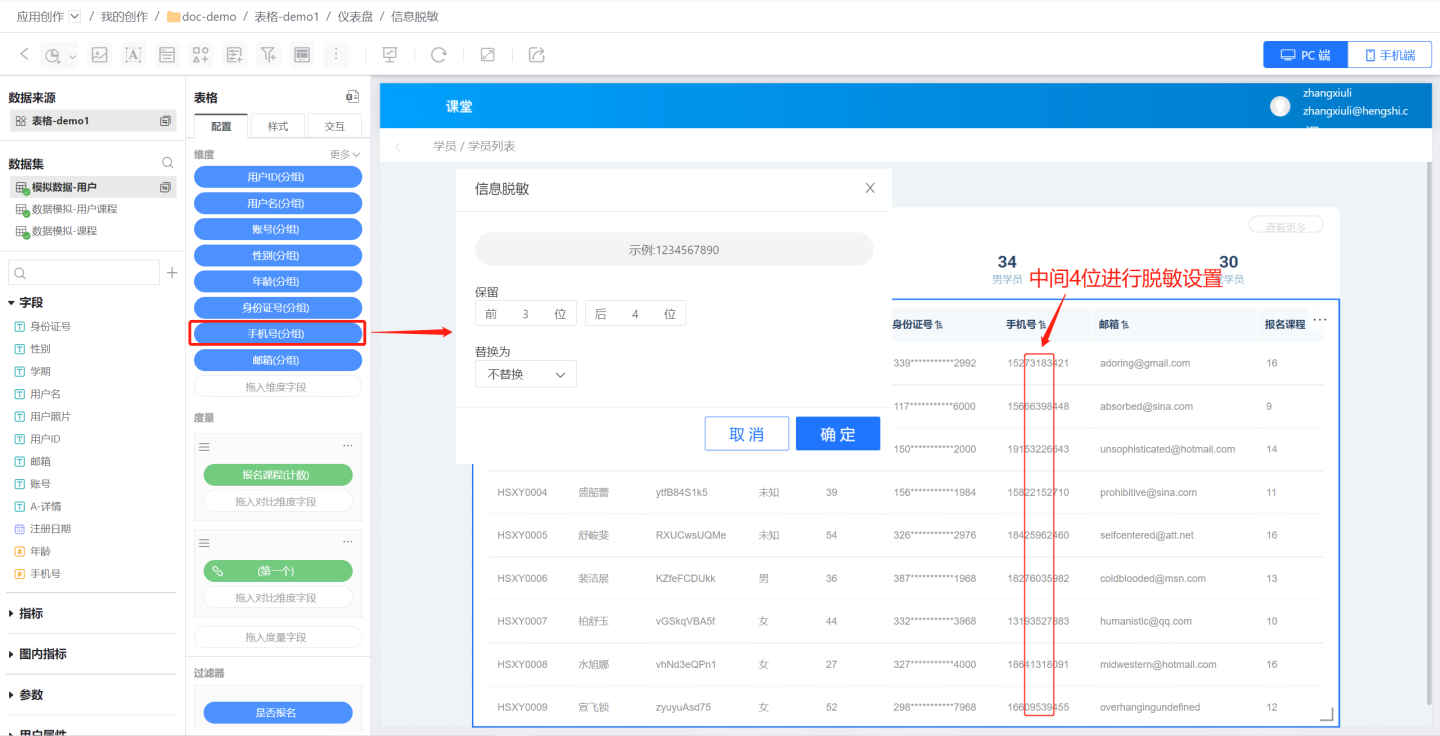
Replace sensitive information.
Masked content can be replaced using three operations: single replacement, full replacement, or no replacement.- Full Replacement: Replaces the entire masked content. For example, using
***to replace masked content will substitute the 4 masked characters in a phone number with***, and the 11 masked characters in an ID number with***.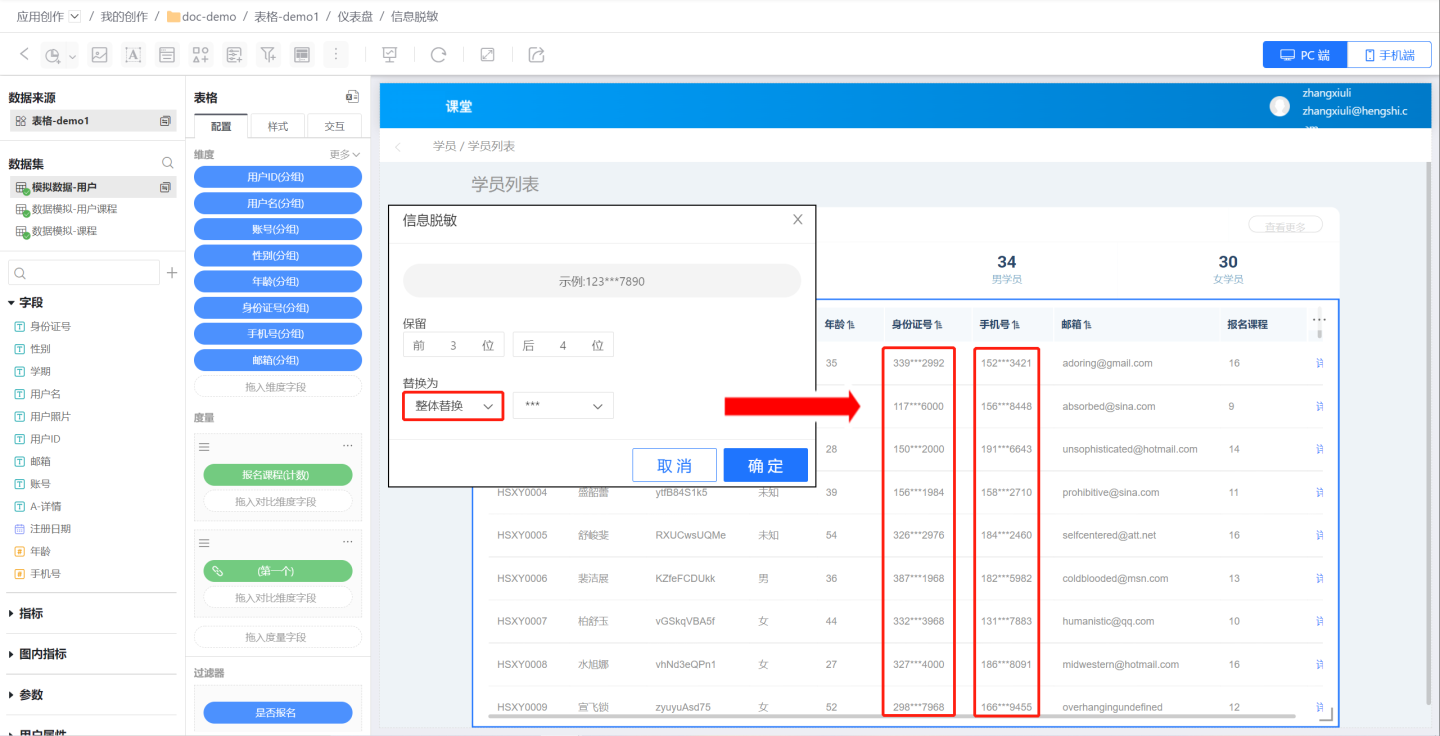
- Single Replacement: Replaces each masked character individually. For example, using
*to replace masked content will substitute the 4 masked characters in a phone number with 4*characters, and the 11 masked characters in an ID number with 11*characters.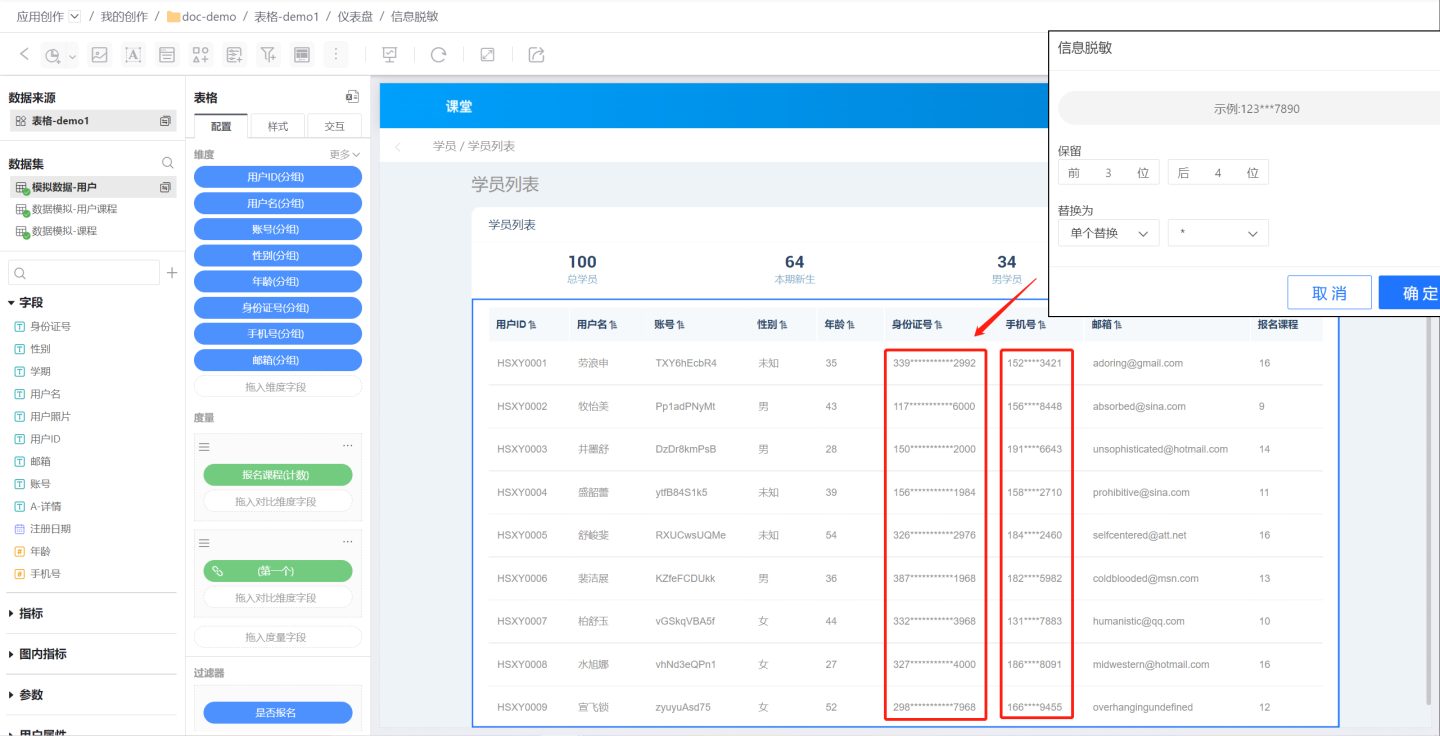
- No Replacement: Leaves the masked content unchanged, often used in scenarios where masking settings are being removed.
- Full Replacement: Replaces the entire masked content. For example, using
Replacement Content: Supports replacing masked information with characters such as
*orX, as well as custom replacement content.
- Additional Scenarios.
When the length of field content varies, some cells may not meet the preservation conditions. For example, if the first 4 characters are to be preserved but a cell contains only 1 character, which is less than the preservation requirement, the entire content of the cell will be preserved, and an additional masking character will be added to indicate that the cell has undergone masking. The example demonstrates scenarios where the first 4 characters and the last 4 characters are preserved, and how information is replaced when cell lengths do not meet the preservation conditions.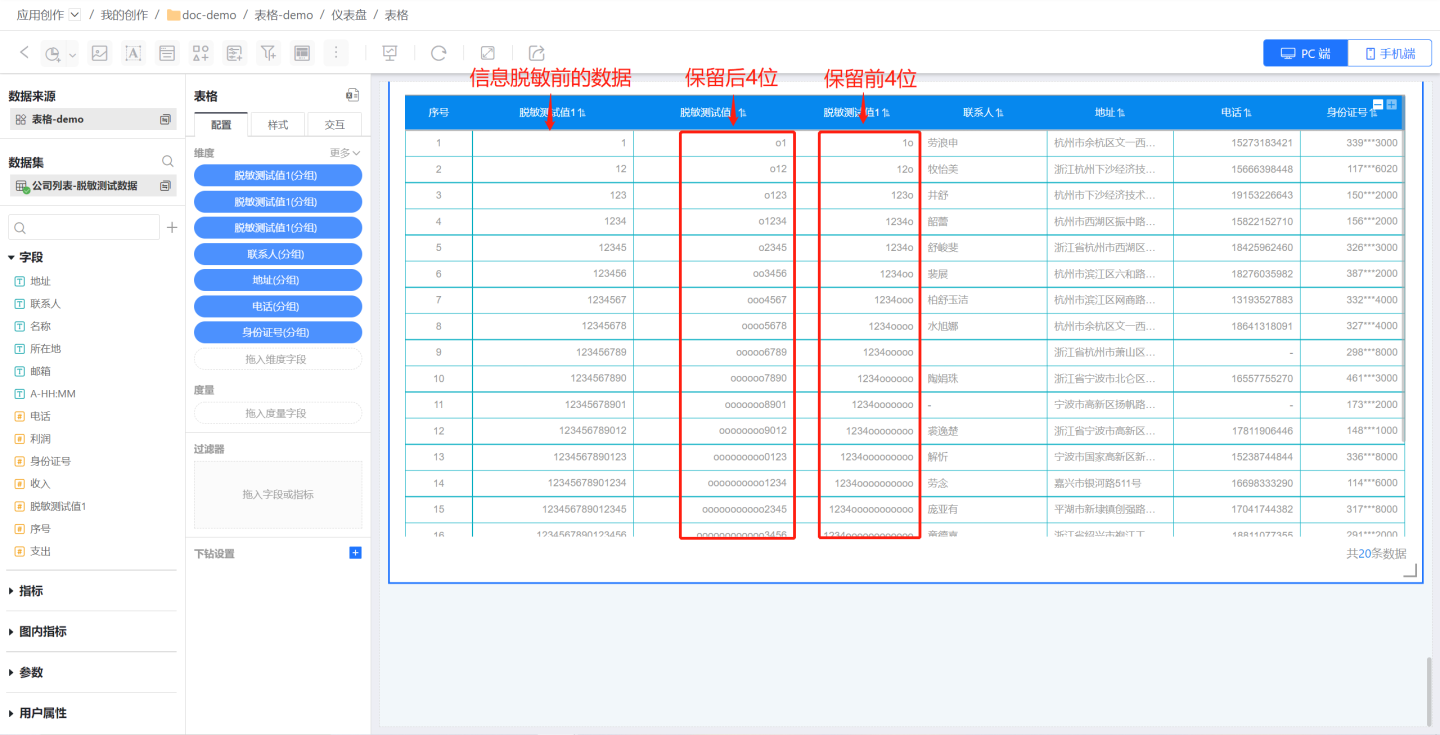
Row and Column Transposition
The table supports row and column transposition functionality. Click the "+" on the right side of the dimension to select row and column transposition. After transposition, except for collapsed dimensions, other styles and animations remain mostly unchanged.
Dimension Subtotals
The table supports the dimension subtotal feature. Click the "+" on the right side of the dimension to add a subtotal.
You can select a dimension field to add a subtotal, which calculates the subtotal for the current dimension group. The subtotal for the primary dimension is displayed at the bottom of the dimension values in the table, while the subtotal for the secondary dimension is calculated based on the grouping cells of its upper-level dimension.
It supports selecting multiple dimension fields to add combined subtotals.
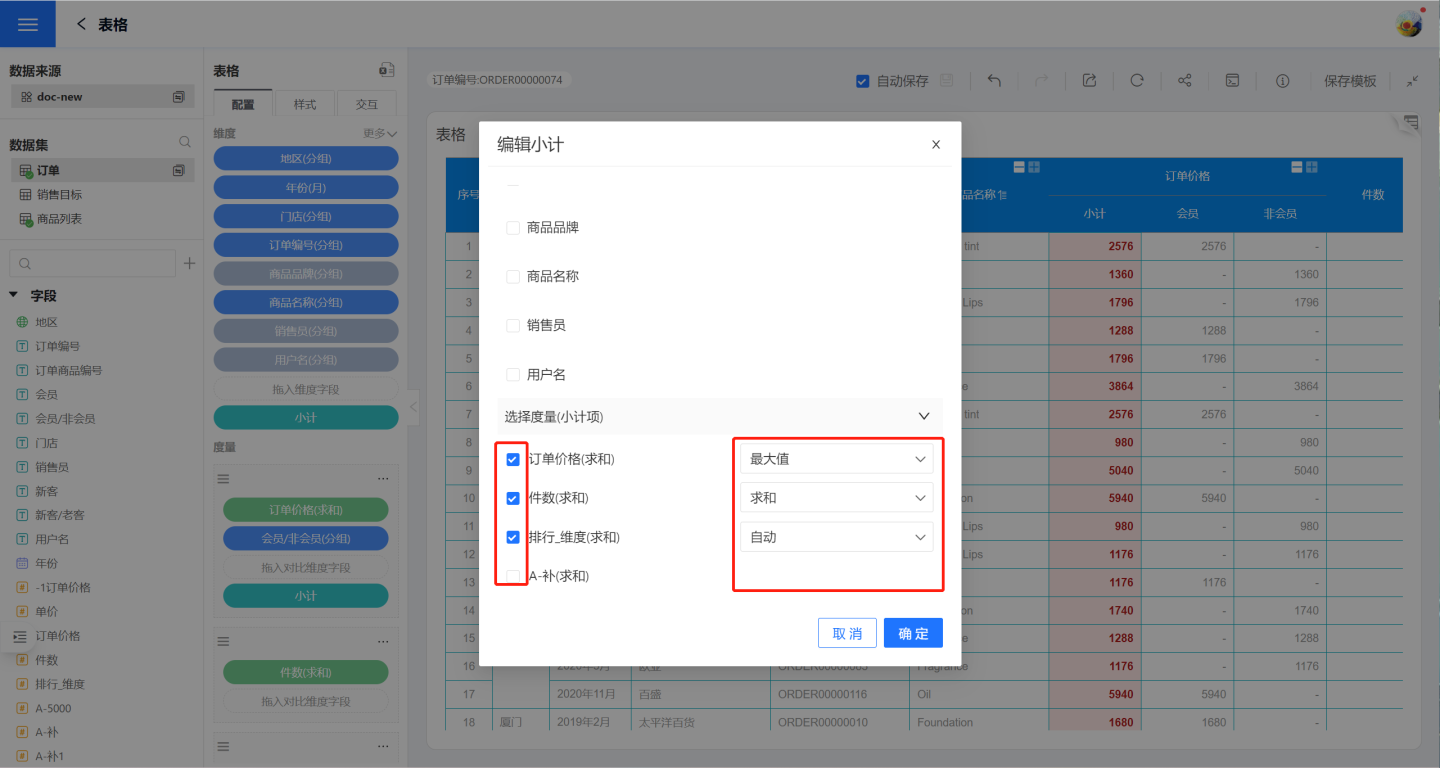
Choose the calculation method for the subtotal. The calculation method for the subtotal can be independent of the calculation method for the measure. In the example, the subtotal for order price is set to the maximum value, while the subtotal for quantity is set to sum. The default calculation method for subtotals is automatic, which follows the calculation method of its measure. If a measure does not need to display a subtotal, simply uncheck it.
Tip
Dimension subtotals support style settings, allowing you to adjust the position, color, background, etc., of the subtotals. For detailed operations, please refer to Subtotal Style Adjustment.
Sorting Levels
When sorting a table, the primary dimension is sorted first, followed by the secondary dimension based on the primary dimension's sorting. Therefore, table sorting is related to the order of dimensions. If users want to change the table sorting without altering the dimension order, they can enable custom sorting levels to achieve this. Custom sorting levels sort the table according to the customized dimension order without affecting the original dimension display of the table.
Measures
- Multiple measures can be added to the measures area.
- Measures added to the table are arranged sequentially after dimensions, following the principle of dimensions first and measures afterward.
- Users can customize and modify the names of measures.
Comparison Dimension Fields
Each measure supports adding one or more comparison dimensions to display data, as shown in the figure where the order price is displayed based on the comparison dimensions of members and non-members.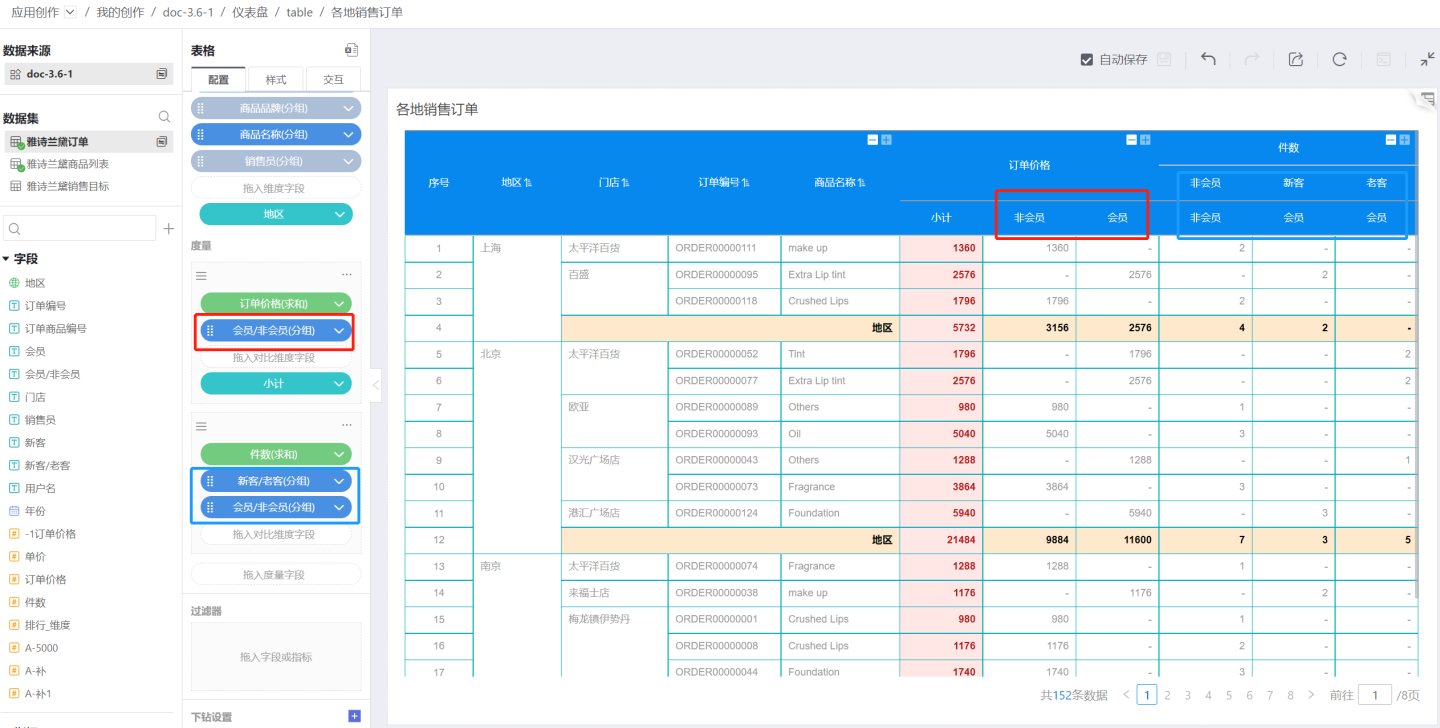
The number of columns displayed in the measure depends on how many groups exist in the comparison dimension. For example, the comparison dimension of order price is divided into two groups: members and non-members. The number of columns in the comparison dimension cannot exceed 512.
Comparison dimensions support sorting. Click the downward triangle on the right side of the comparison dimension to open the menu, then click "Sort." The sorting method is the same as the dimension sorting method, and you can refer to dimension sorting for configuration.
Create a Copy
Creating a copy means creating another metric with the same content as the current metric. You can quickly create a new metric by replacing the metric or comparison dimension. As shown in the figure, the ranking is created by making a copy, only replacing the metric field.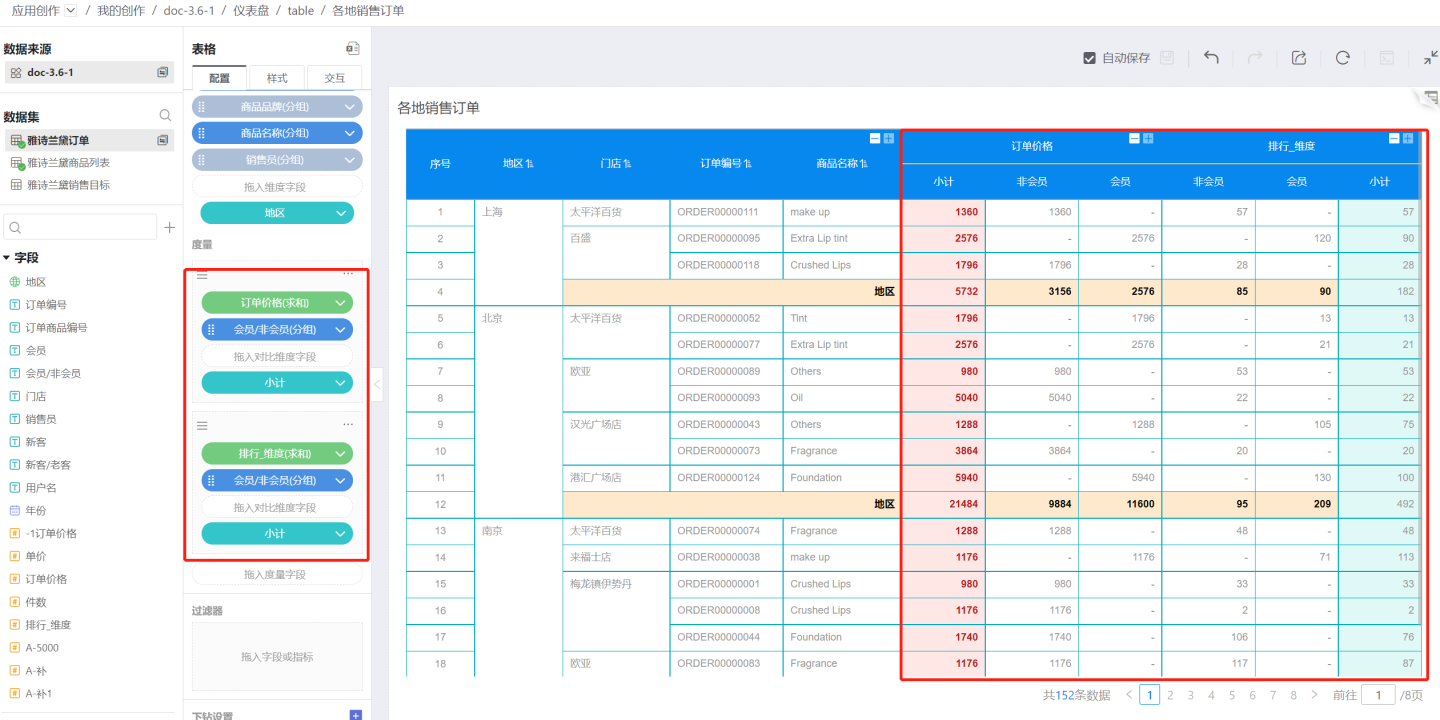
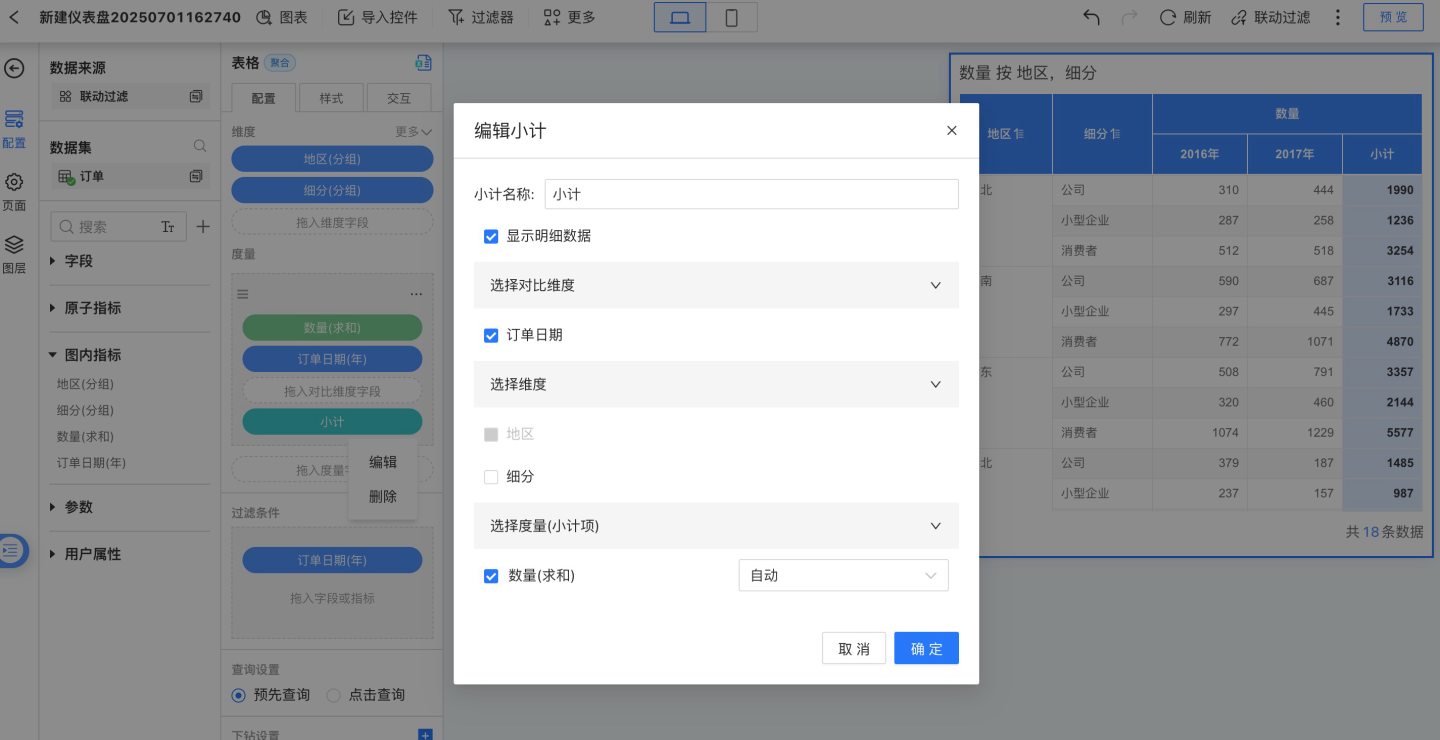
Measure Subtotal
Click "+" on the right side of each measure to add a subtotal. Subtotals support multiple options.
Select only the comparison dimension field to add a subtotal, calculating the subtotal for the current row, as shown in the figure below.
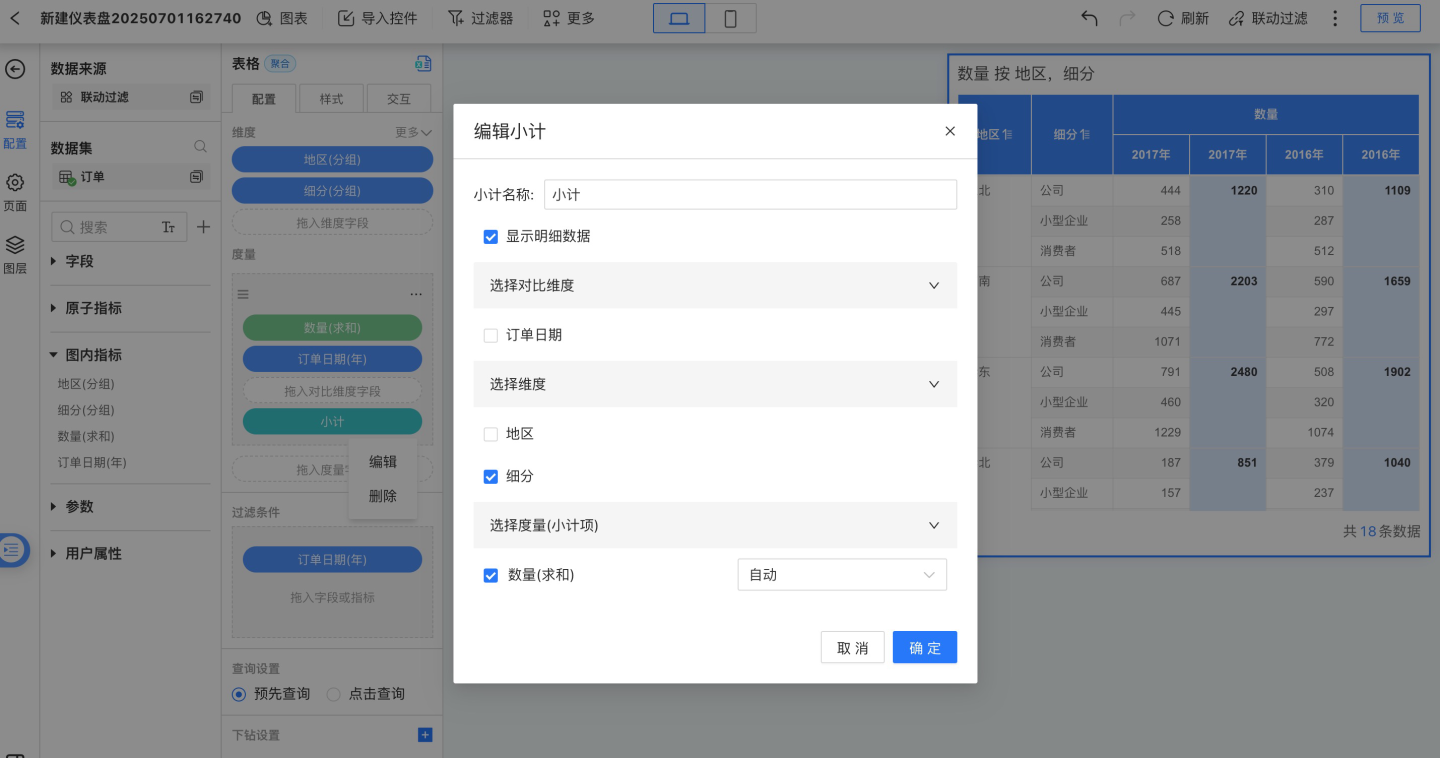
Select only the dimension field to add a subtotal, calculating the subtotal for the current comparison dimension group column, and the header is named after the comparison dimension.
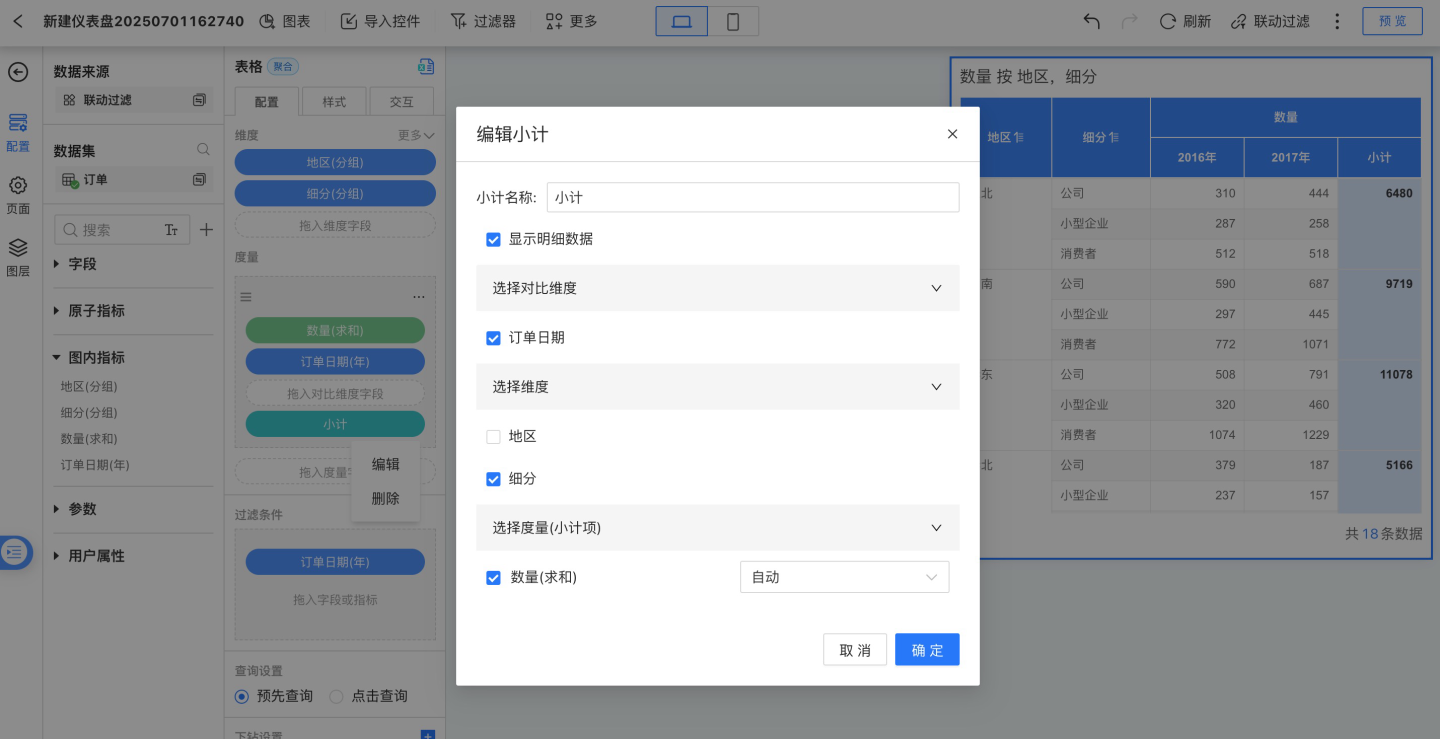
Select both the dimension field and the comparison dimension field to add a combined subtotal, calculating the total for all rows. The added combined subtotal is displayed on the far right of the table.
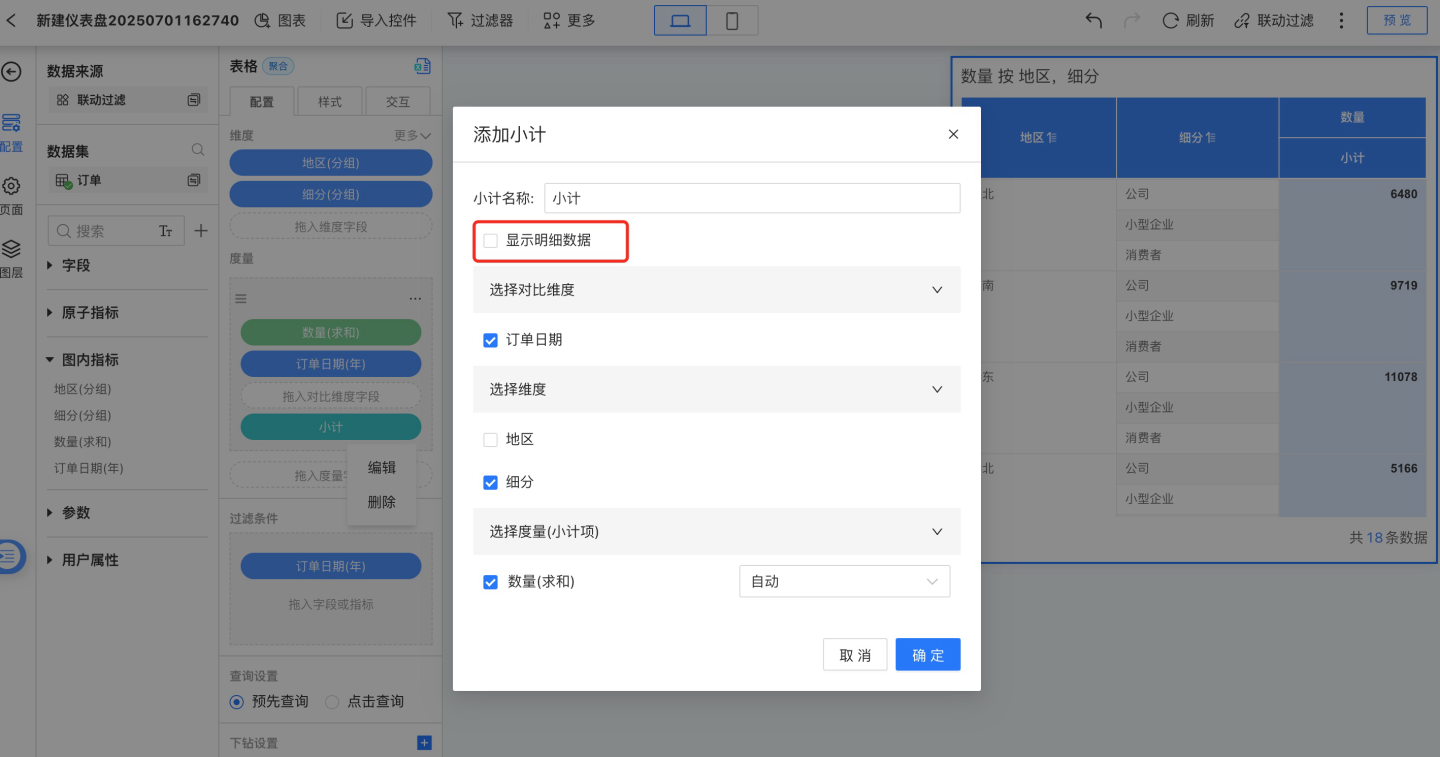
When "Show Detail Data" is checked, detailed data is displayed in the table. If unchecked, detailed data will not be displayed in the table. The example below shows the table when "Show Detail Data" is unchecked.
Please Note
When selecting dimension fields for measure subtotals, you need to start from the bottom-most dimension, i.e., select from the last sub-dimension upwards.
Convert to Group
Convert this measure into a measure group. The header of the measure group will appear above the current measure, and users can customize the name of the measure group.
A measure group can use the same measure with different filter conditions. It is mainly used to display comparisons of the same set of calculated metrics under different environments (filter conditions).
Multiple groups can be merged for display, as shown in the figure below.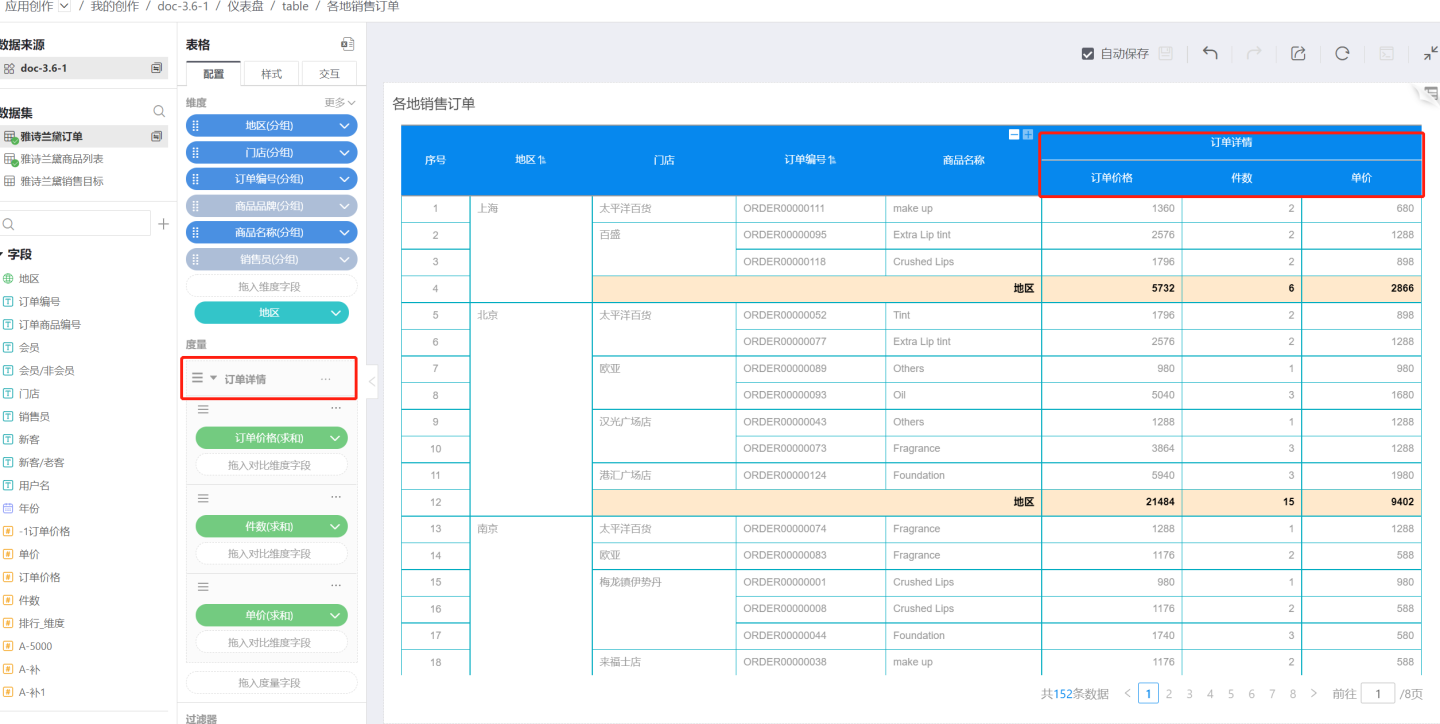
Add Filter
Add filter conditions for this measure to determine which data should be displayed in the details based on the filter conditions.
Compress Dimensions
In the table control, the toolbar for measures includes the Compress Dimensions menu. The Compress Dimensions function is used to control the values of dimensions. If Compress Dimensions is set on Measure A, all dimension values introduced during the calculation of Measure A will appear in the final result set of the chart.Compress Dimensions is related to the data model. It only takes effect when a table includes an associated model with relationships such as "1:Many," "Many:1," or "Many:Many" from a related table while creating a chart. For more details, see Compress Dimensions in Data Models within Charts.
Table Related Settings
Filters
Please refer to the Filters section in the Chart documentation.
Tip
Currently, filtering on raw fields affects subtotals, while filtering on calculated metrics and in-chart metrics does not affect subtotals.
Drill Settings
The table supports setting drill layers. Please refer to Chart Drill for instructions.
Table Styles
The table supports a variety of style settings. Please refer to Table Styles for configuration.
Table Interaction Operations
The table can be configured with various interaction operations such as scrolling, pagination, click pop-ups, etc. It also supports interaction with other charts in the dashboard, such as linking with other charts, navigation, etc. Please refer to the corresponding sections for configuration.
Table Operations
Table Data Export
When exporting table data, the data types are preserved to facilitate secondary calculations. Date-type data supports processing using date functions, and prefixes or suffixes of numeric-type data do not affect calculation results.
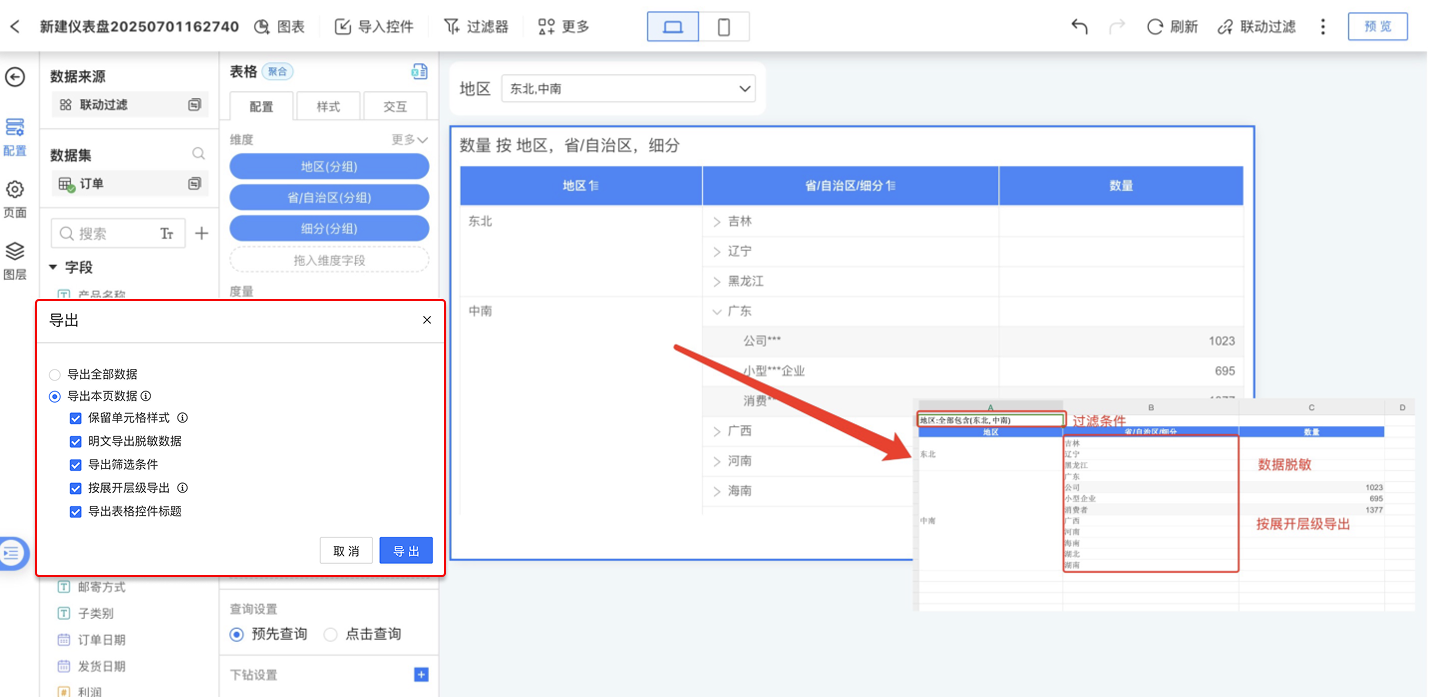
The following settings are supported during data export:
- Export cell styles to ensure the exported data matches the displayed table.
- Export desensitized data in plaintext, allowing users with data permissions to view the full desensitized data.
- Export data filtering conditions to provide viewers with a clearer understanding of the data's context.
- Export by expanded hierarchy, exporting data based on the current state of folded dimensions.
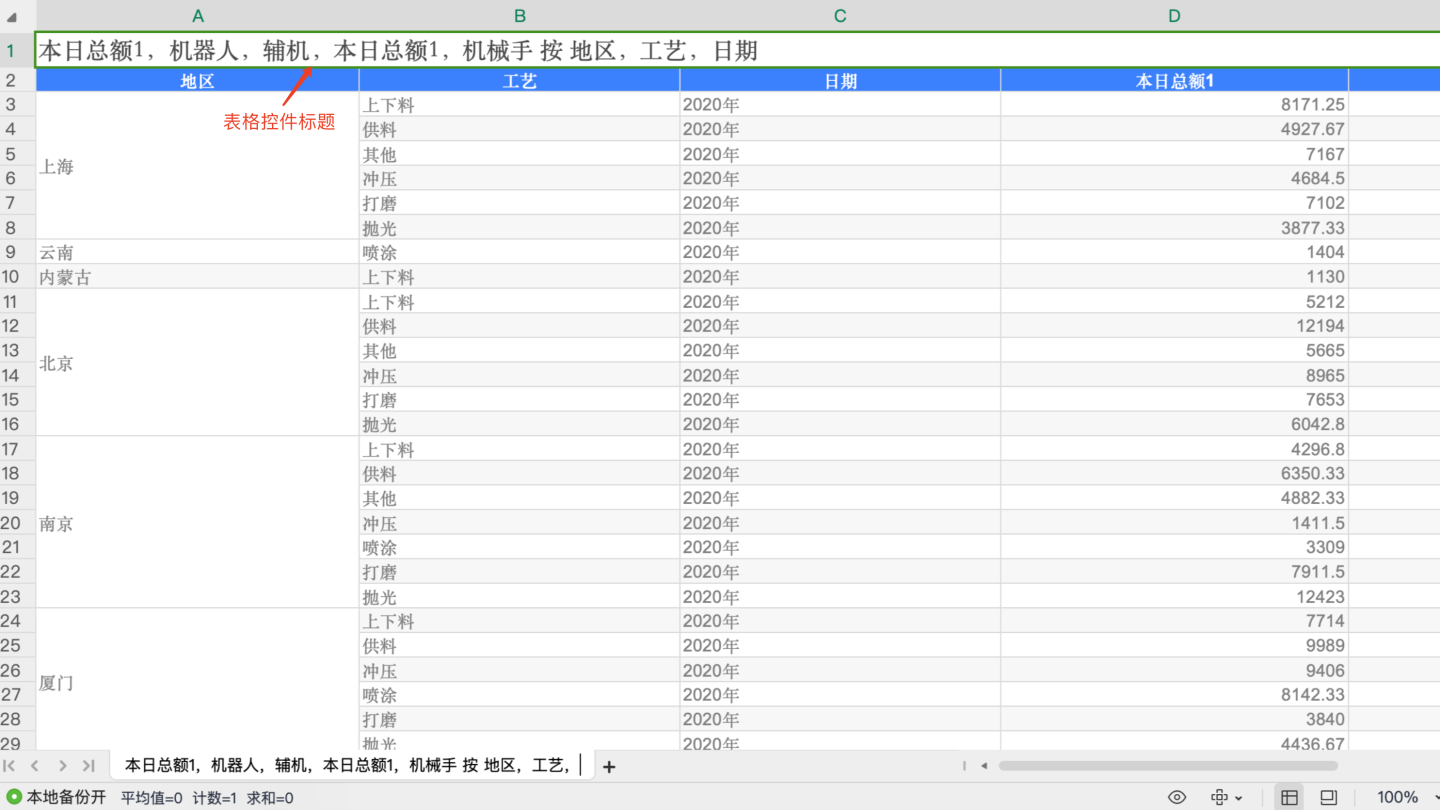
- Export table control titles to include the title of the current table in the export.
Please Note
Tables can only export cell styles, plaintext, filtering conditions, expanded hierarchy, and control titles when exporting the current page. Exporting all data does not support exporting styles, plaintext, filtering conditions, expanded hierarchy, or control titles.
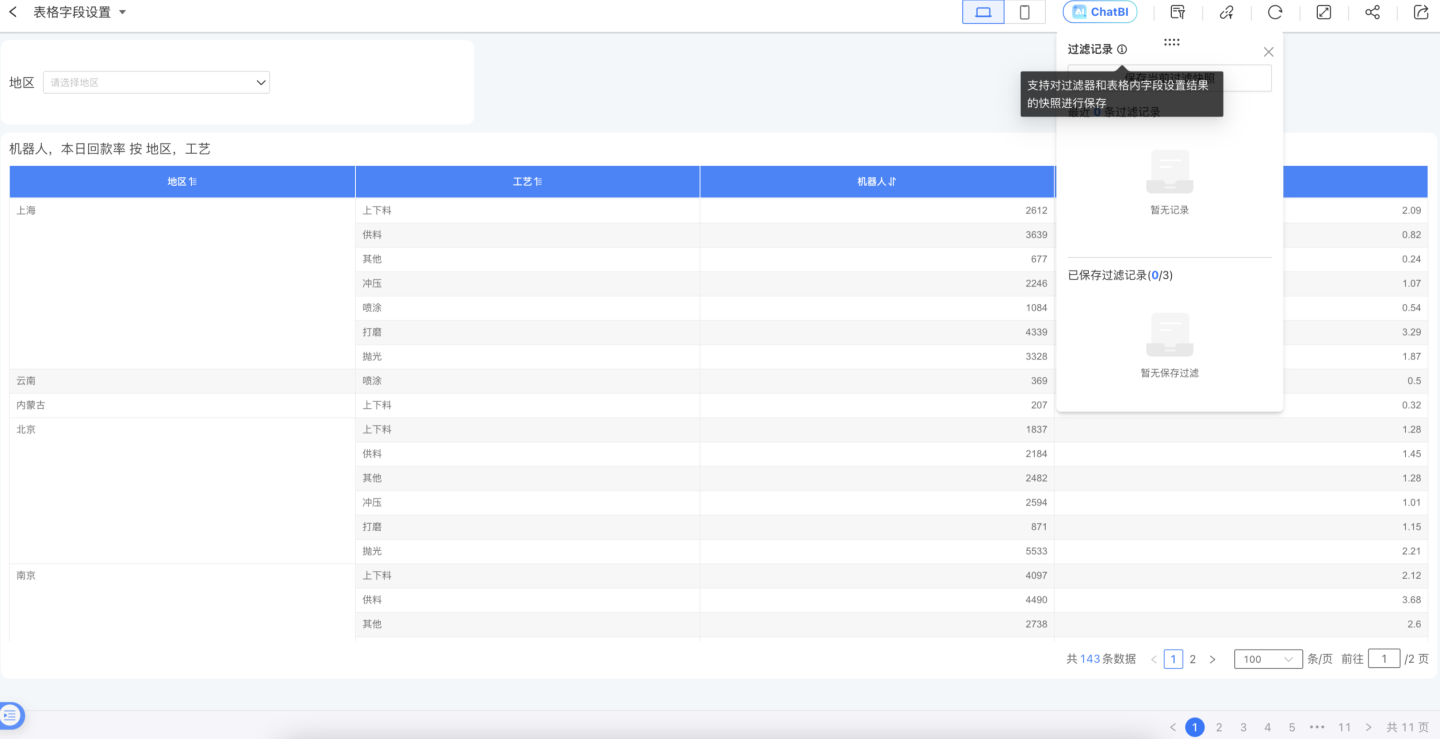
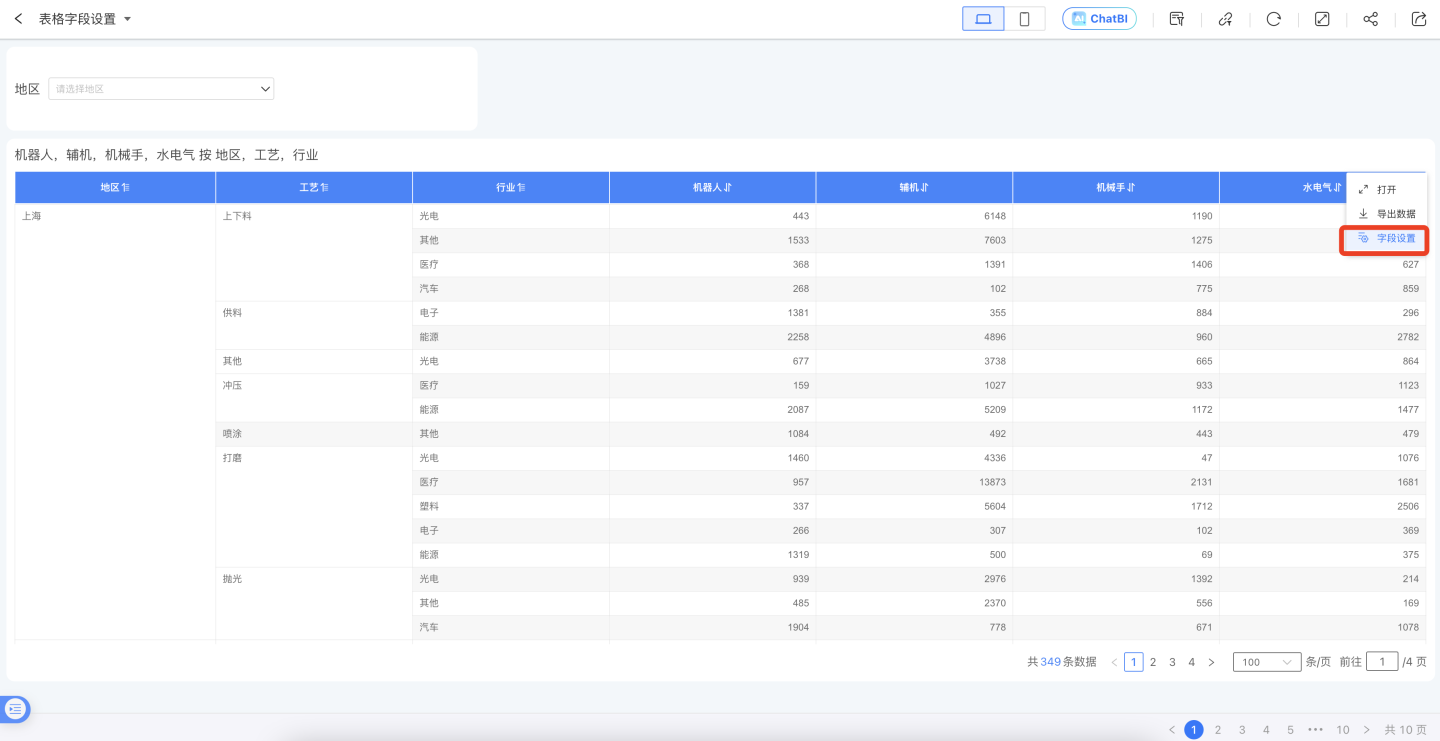
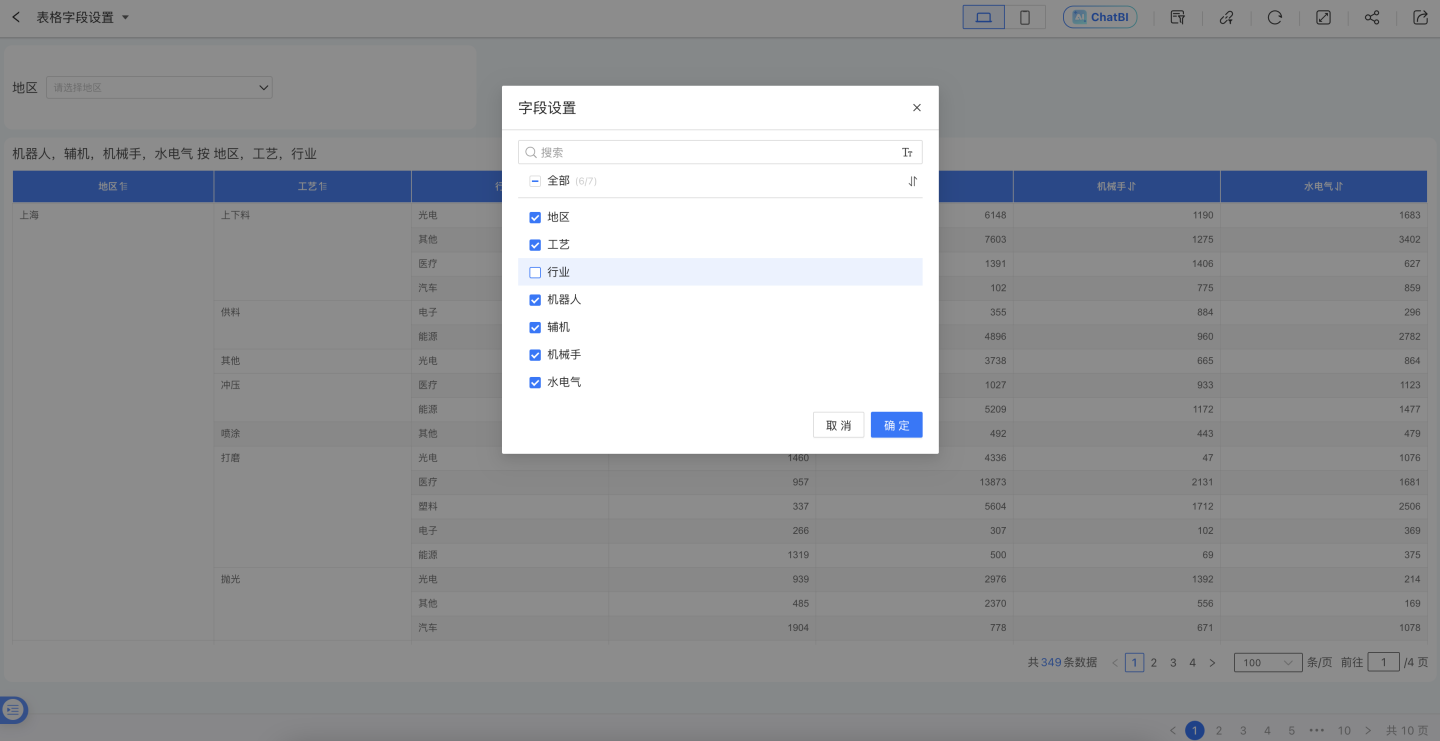
Table Field Settings
When viewers view reports, they can hide unwanted fields in the table through field settings based on their viewing preferences. Additionally, they can adjust the field order.
If viewers want to save the configurations made in the table field settings, the field settings will remain configured the next time the report is opened. This can be achieved through Save Current Filter Snapshot. After configuring the table field settings, use the save filter snapshot feature to save the table snapshot.
Save Scope: Table in App Market, Canvas Table, Dataset Table. Both the fields and sorting results in the field settings are saved, excluding the cross table.