Complex Reports
Complex reports integrate Excel's native editing capabilities and formula configuration capabilities, supporting multi-data source integration. Through visual drag-and-drop and configuration, users can quickly create complex, layout-intensive, and calculation-heavy Chinese-style reports within the Excel interface. At the same time, complex reports are deeply integrated with the platform's original analytical capabilities, supporting data update synchronization, data filtering linkage, row and column data permission control, and embedded scenario analysis.
Compared to ordinary tables, complex reports have the following advantages:
- Multi-Data Sources: Complex reports can analyze and display data from multiple data sources. The data can come from a single database or multiple databases.
- Diverse Styles: The headers of complex reports support dynamic expansion, slanted headers, and other styles. Fields can be grouped and expanded by rows or columns, enabling various report forms such as grouped reports and detailed reports.
- Complex Calculations: Row and column fields in reports can utilize advanced calculations provided by HENGSHI SENSE or Excel formula functions for computation.
Create Complex Reports
In the dashboard, click on New Chart -> Complex Report, select the data source and dataset, and click OK to create a new blank complex report.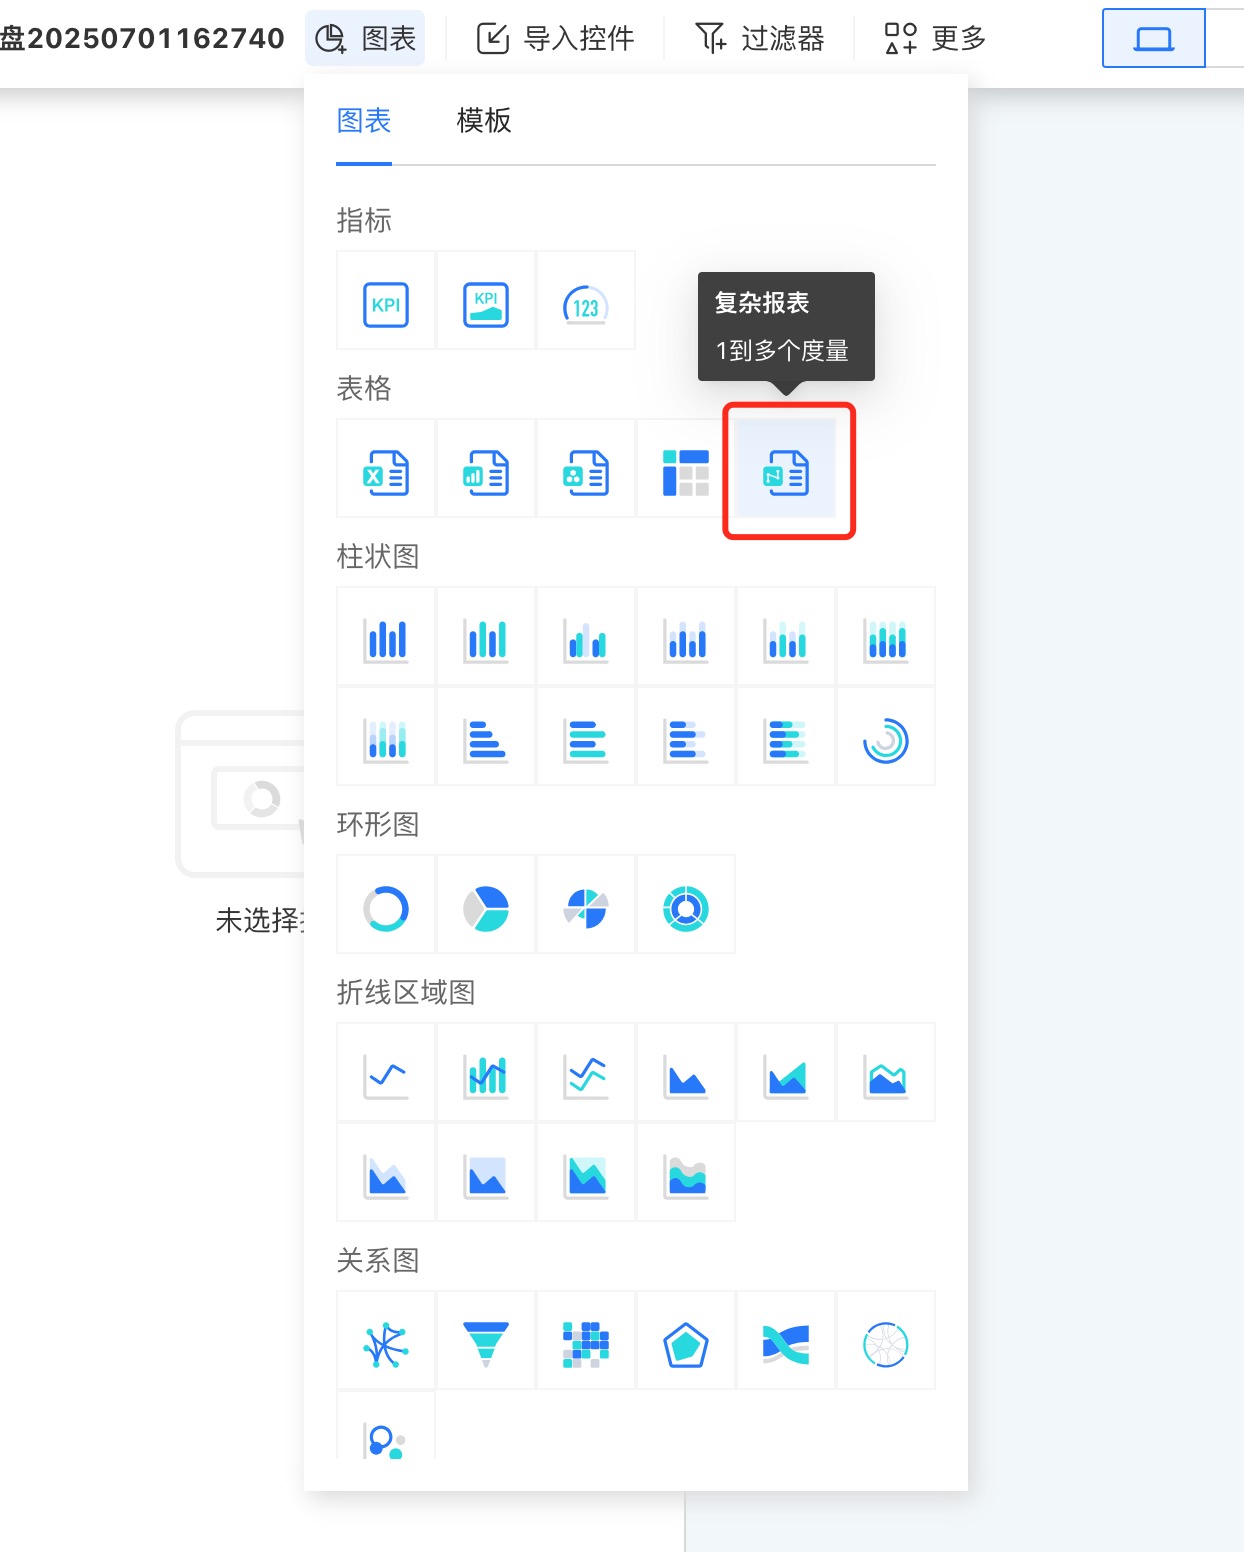
The newly created complex report does not contain any data. Unlike other reports, complex reports need to be opened for editing. Click on the three-dot menu in the upper right corner to open the complex report and enter the editing page.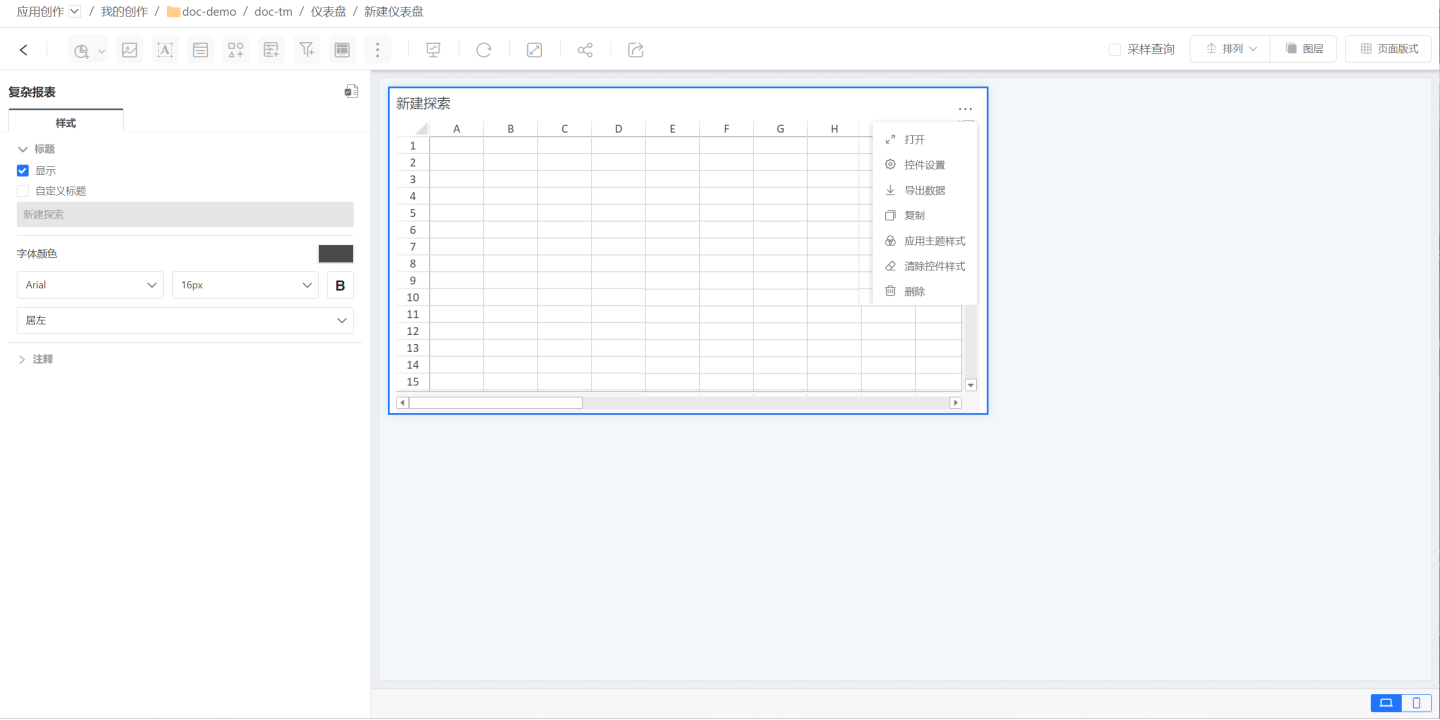
Edit Complex Reports
The complex report editing page is divided into three sections. The leftmost section (red box) is the data area, displaying the data used in the complex report. The middle section (blue box) is the configuration area, primarily used for configuring report-related data and data presentation formats. The right section is the cell area, where you can set cell properties and cell styles. After editing the complex report, click the preview button in the upper right corner to view the report's display style.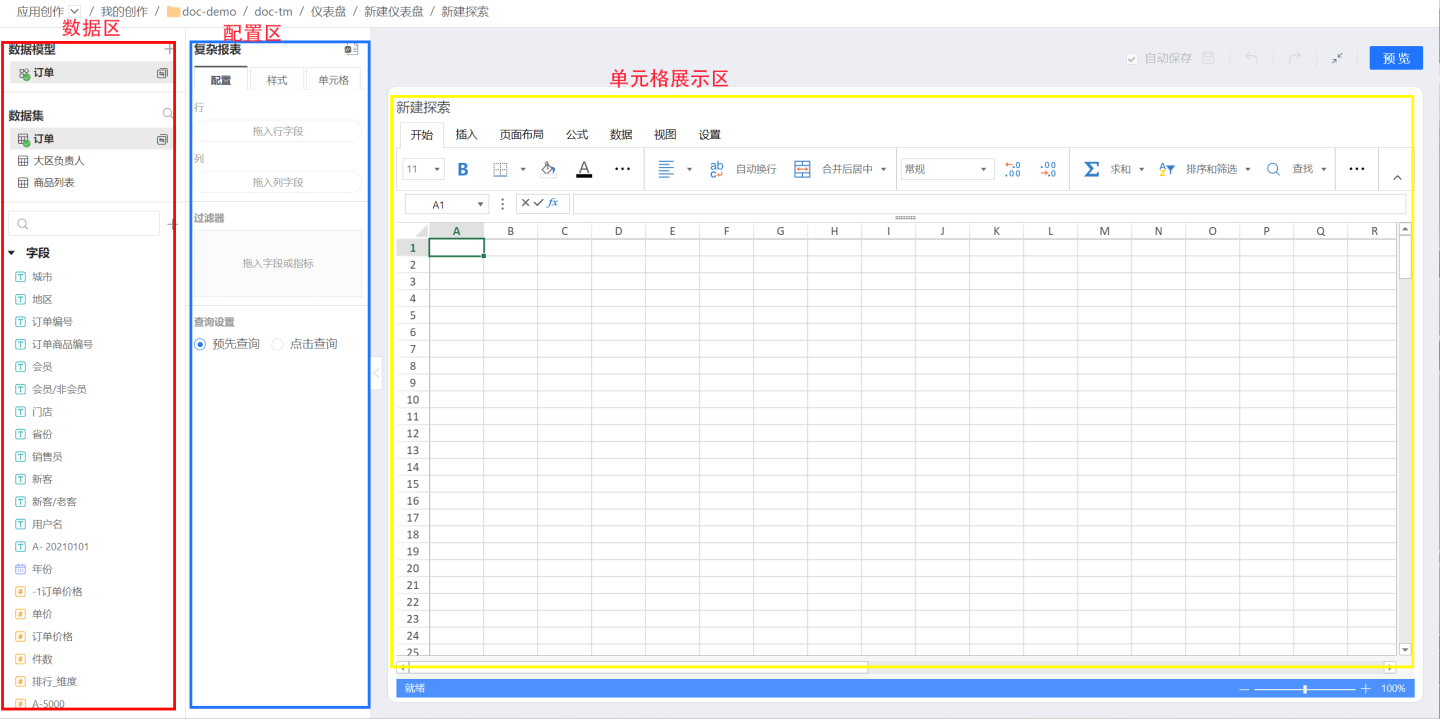
Row and Column Data Display
When displaying data in cells, it is divided into two steps. First, select the display position of the data in the table, such as selecting a specific cell, and then drag the desired field to the row or column display area.
In the example, first select cell A3, then drag the City field as a row field. The field will be displayed in rows. 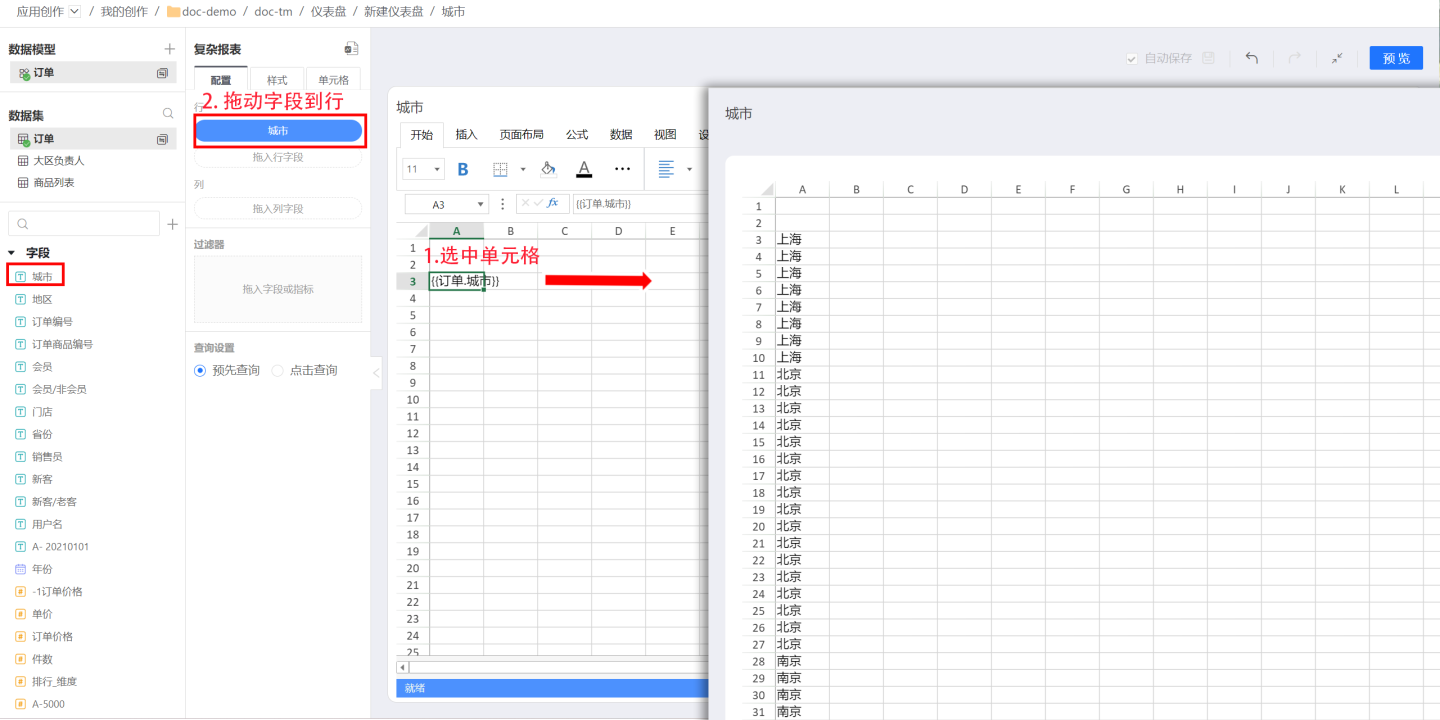 When dragging the
 City field as a column field, the field will be displayed in columns. 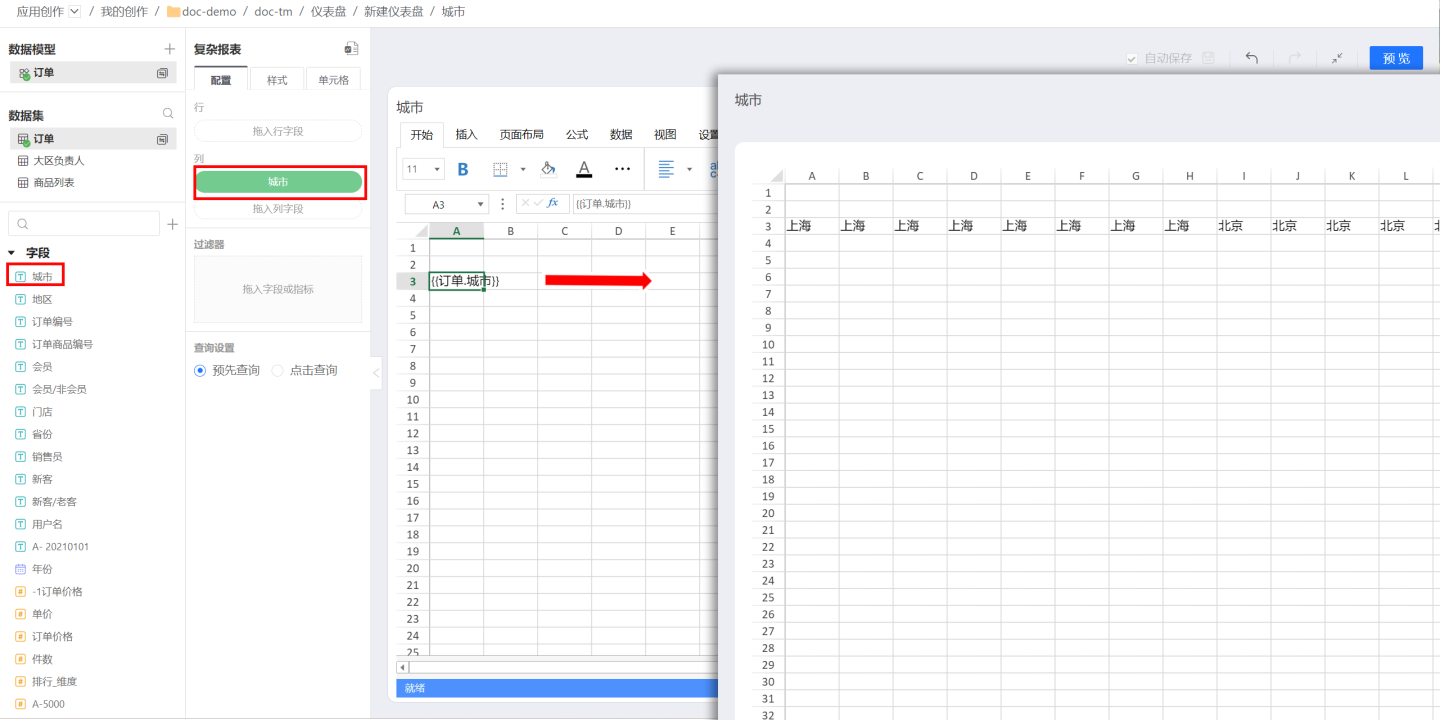
Detailed Data
When fields are directly dragged into rows or columns, detailed data information is displayed. Detailed data refers to the granular data in the dataset. If you want to display aggregated data, you can set grouping for the fields.Aggregated Data
After dragging fields into rows or columns, selecting grouping in calculations enables aggregated data display. For example, grouping the city field will display results as shown below.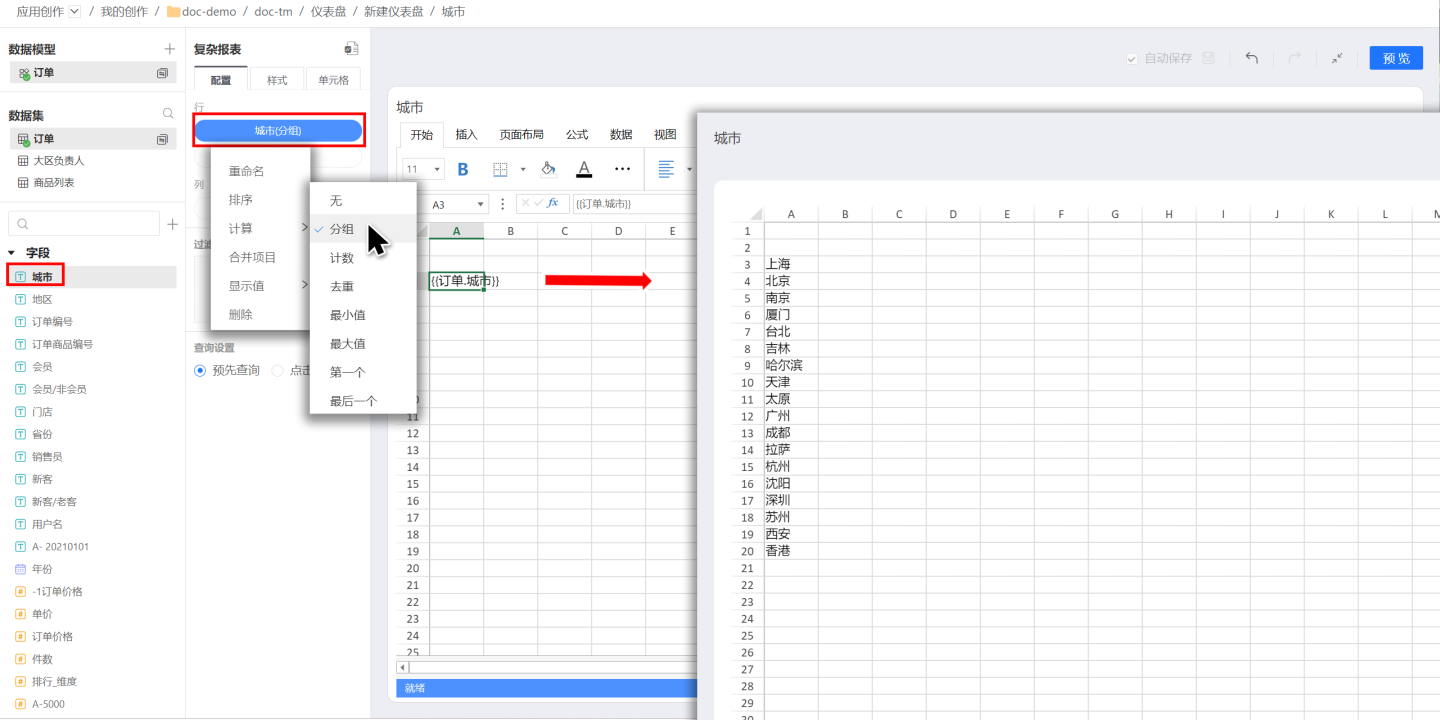
Tips
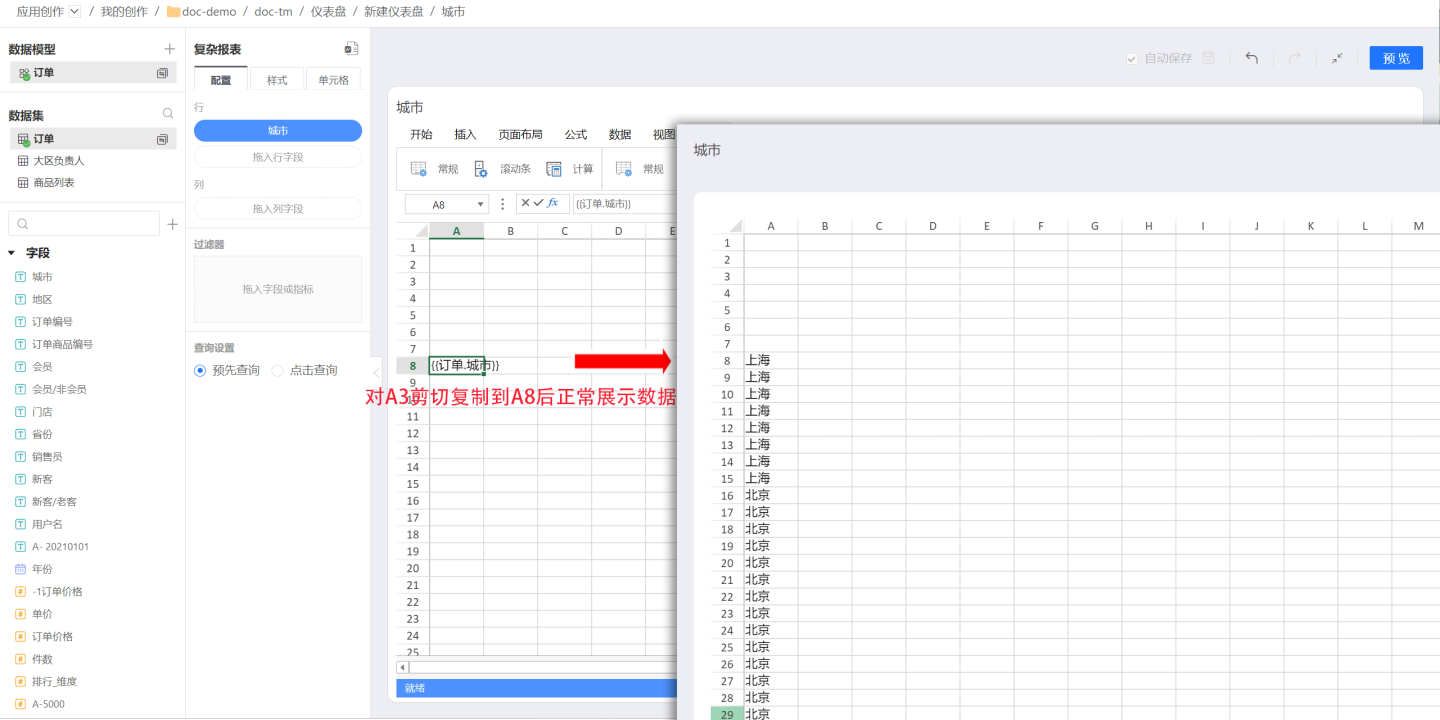
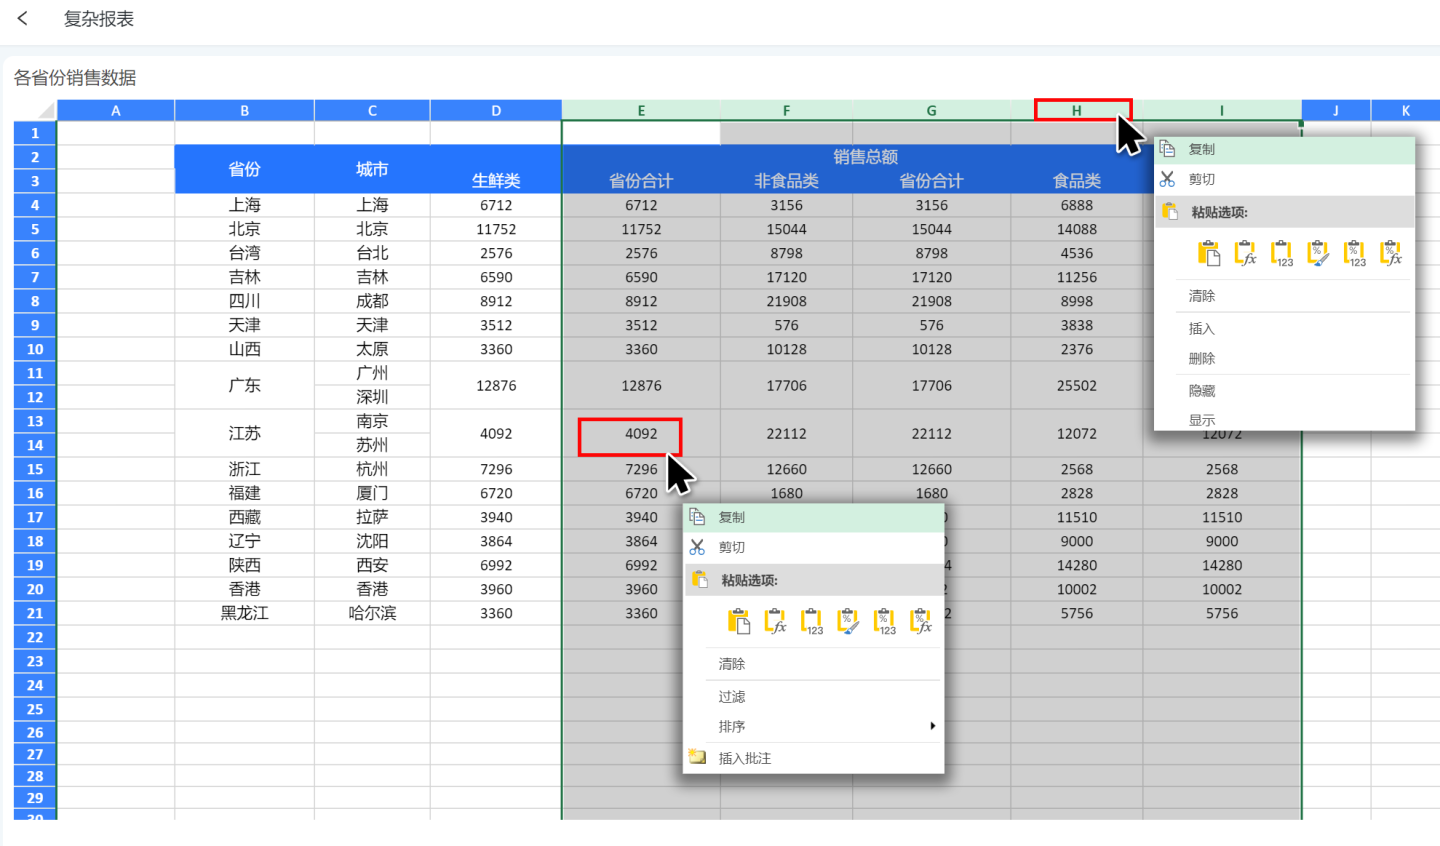
- When performing "cut-copy" operations on configured data cells in the cell area, the configured data and other dependencies are carried along. For example, cutting cell A3 and copying it to cell A8 will display the corresponding configured data in cell A8.
- There is a one-to-one mapping relationship between fields and their bound cells, allowing for quick association between the two. When clicking a field, the bound cell is highlighted, and vice versa.
Group By
Field Grouping Basis
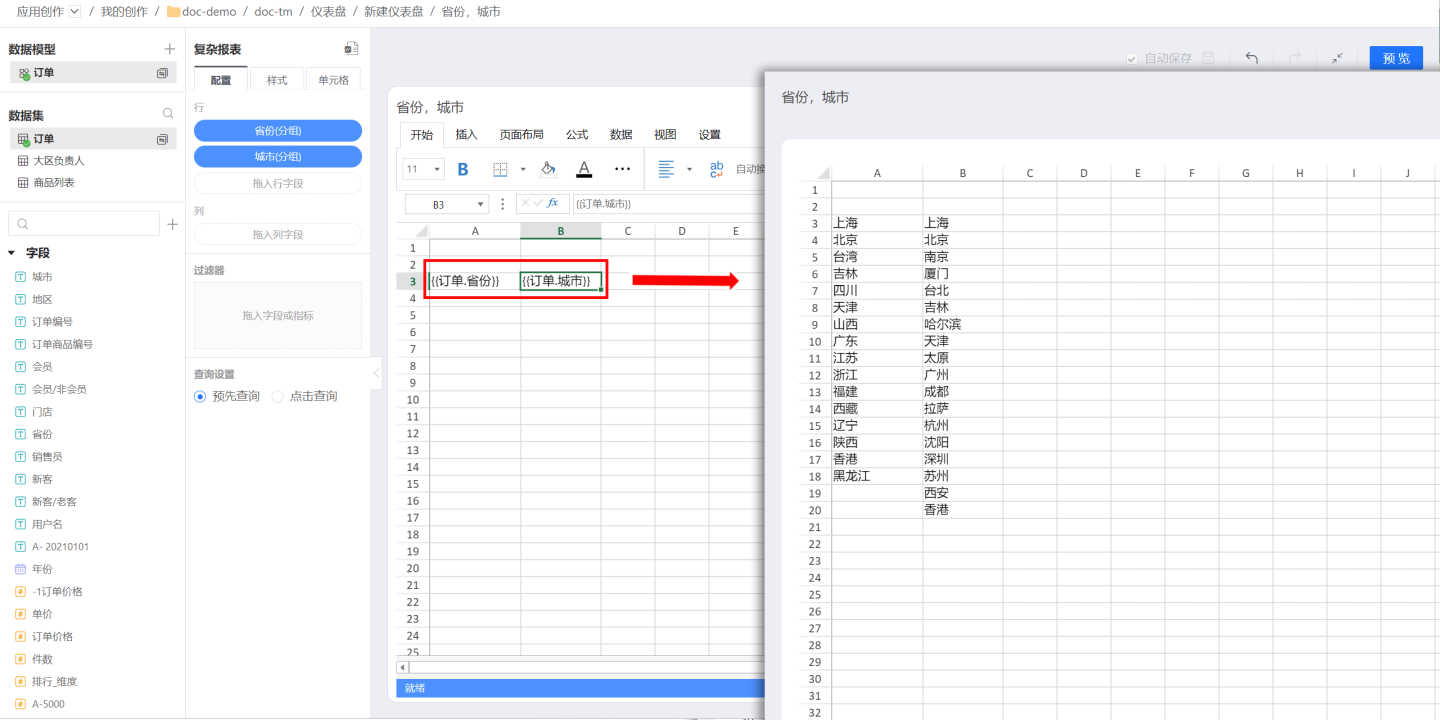
When fields are dragged into a complex report for row and column data display, they are not associated with other fields. Multiple fields from the same dataset or data model are independently displayed without bringing in the corresponding relationships from the dataset. As shown in the figure, dragging in the fields "Province" and "City" results in no connection between them, and they are displayed randomly. In reality, cities and provinces have corresponding relationships, such as Hangzhou belonging to Zhejiang Province and Guangzhou belonging to Guangdong Province. To display them correctly, their relationships need to be established.
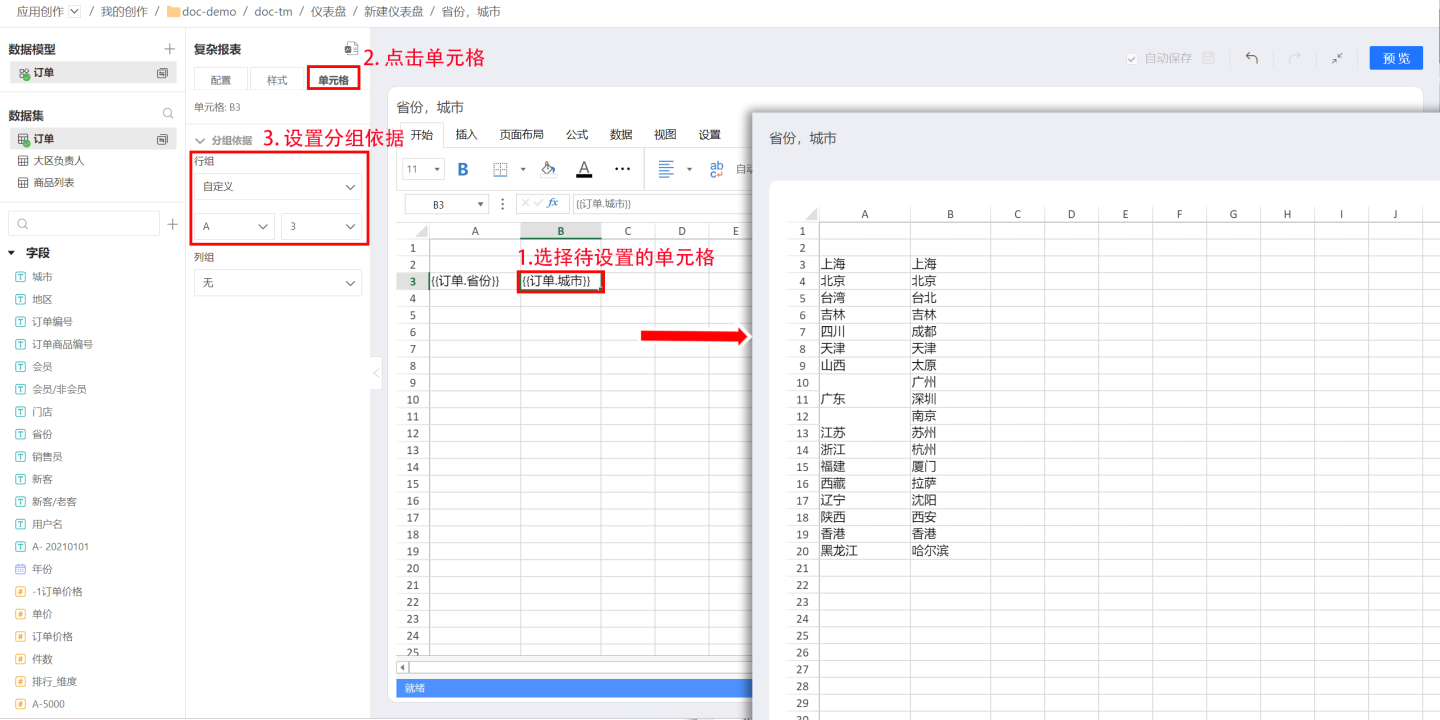
In complex reports, grouping basis is used to establish relationships between two fields. First, select the cell to be configured, then set the grouping field for the selected field in the cell configuration area on the left. Once successfully set, the field in the cell will be displayed based on the grouping field. For example, to display cities grouped by provinces, first click the cell containing the "City" field, then click the cell in the configuration area on the left. In the grouping basis, select to group by row group A3 (A3 is the cell containing the "Province" field). When the data is displayed, the "City" field will be grouped by "Province."
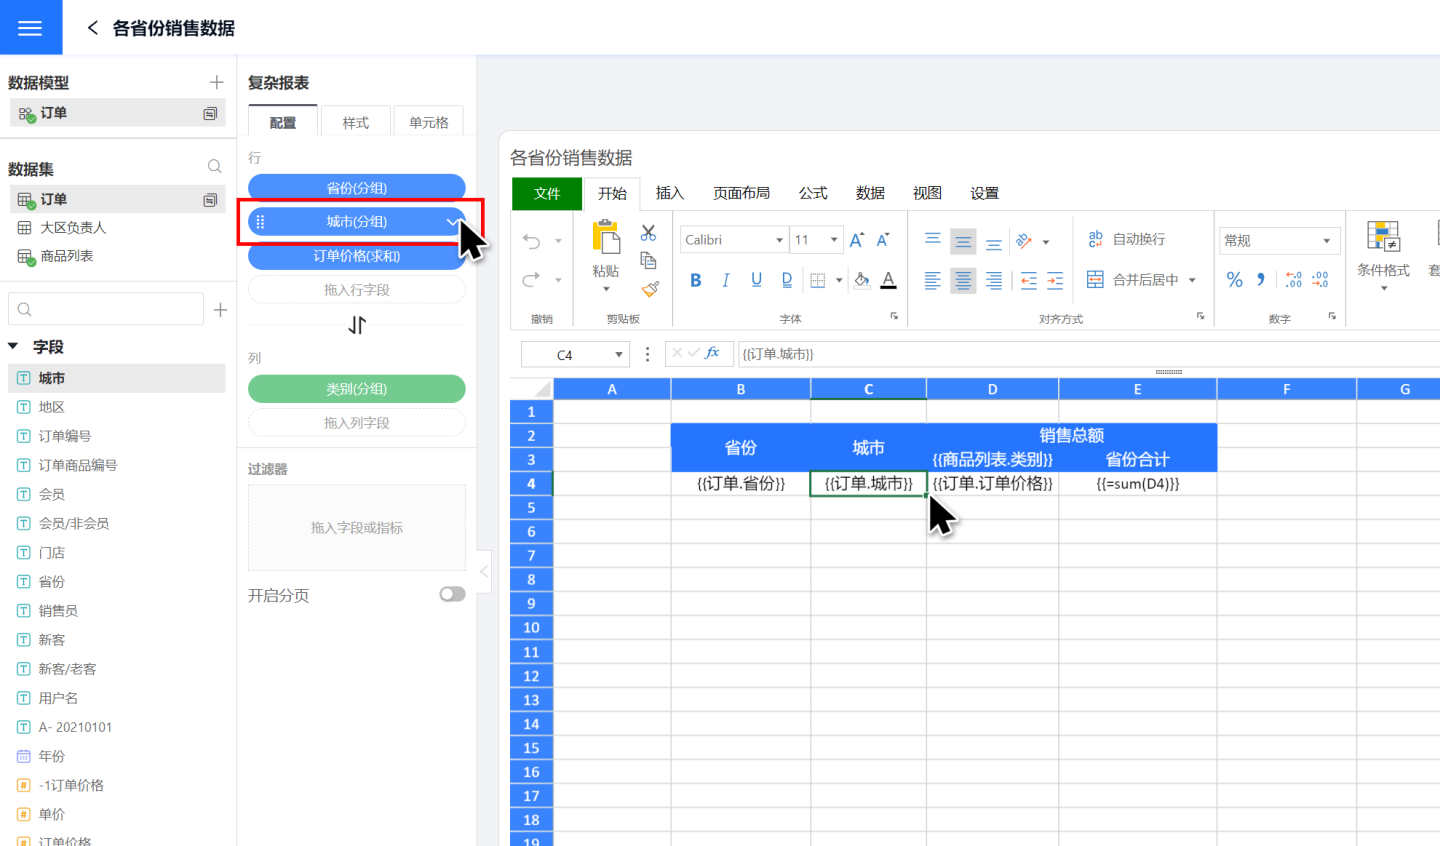
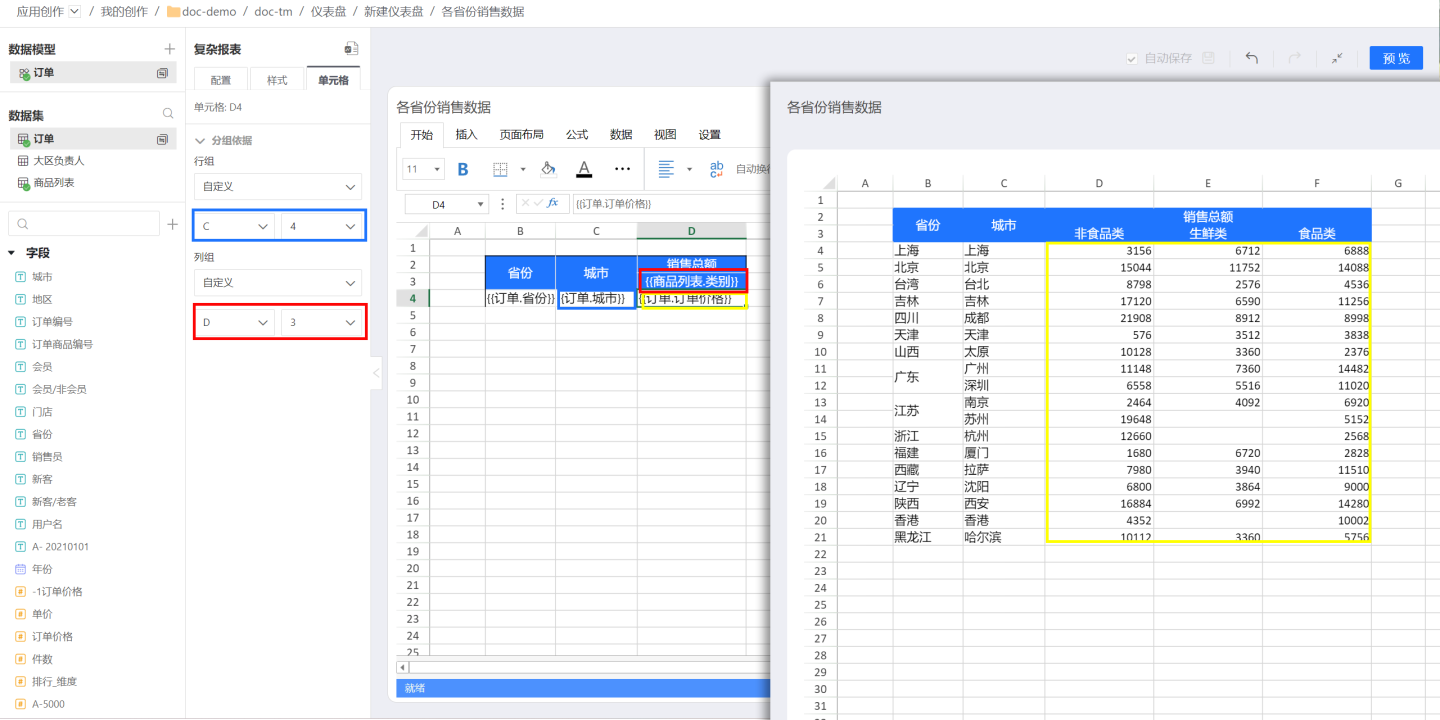
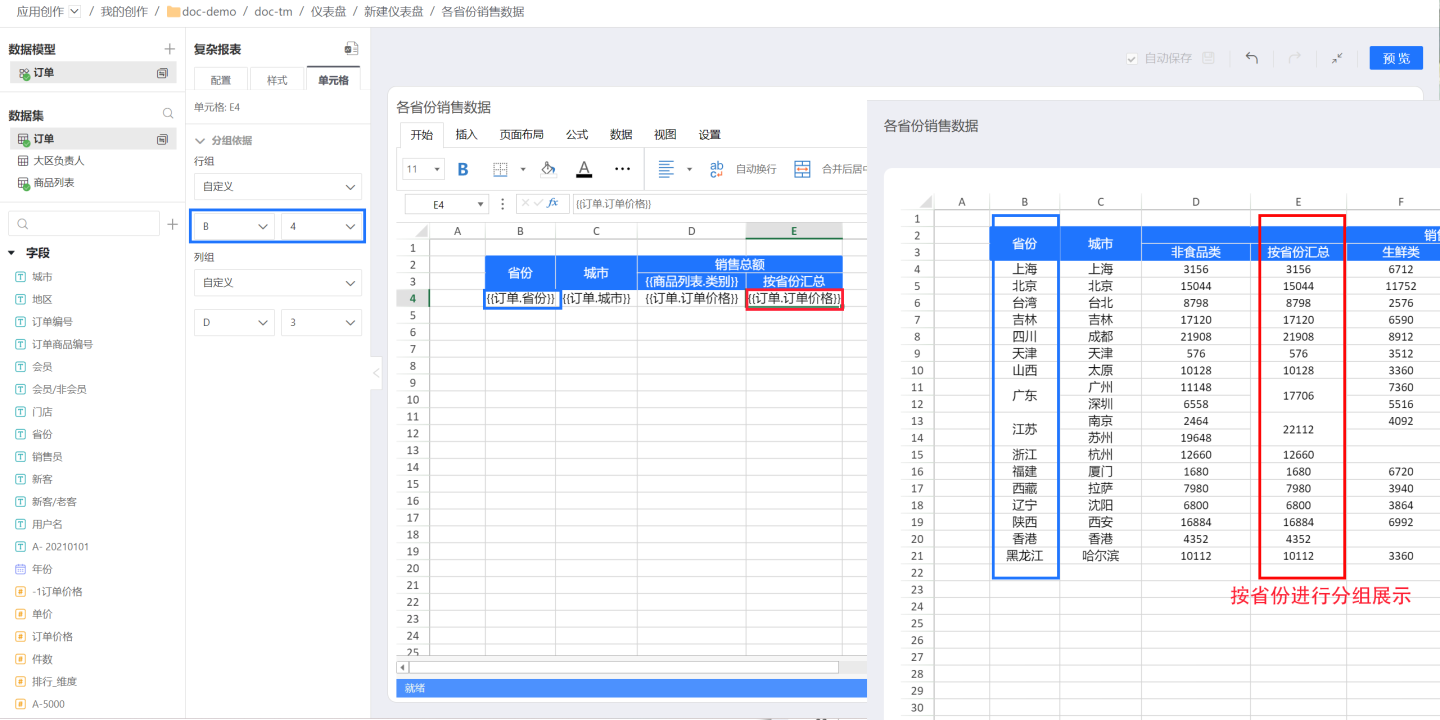
In the example above, grouping is done by row group. Complex reports also support grouping by column group. In certain complex scenarios, both row group and column group grouping may be required. For example, in a sales report for a large supermarket's city stores, sales amounts are displayed by product category. To calculate the order price, i.e., sales amount (yellow box), grouping is done by row group C4 (blue box) to display data by city, and by column group D3 (red box) to display data by product category. The final data display result is shown in the yellow box on the right.
- When fields are dragged into the same axis, cell grouping conditions support initialization. The default condition is:
Within the same axis (row field/column field), find the nearest field above the current field that is calculated as a grouping field and use it as the default dependency object. - Special support for time-type fields: When a time field is calculated as
Group, Millisecond, Second, Minute, Hour, Day, Day (Cross Week), Day (Cross Month), Week, Month, Month (Cross Year), Quarter, Quarter (Cross Year), Year, it also meets the default condition. - When adjusting the order of fields within the axis, the grouping condition will not automatically update based on the field order.
Tip
- The grouping basis does not necessarily need to be adjacent cells; any cell within the current complex table can be used as the grouping basis.
- Complex reports support selecting cells to the left and above as the grouping basis. For example, the cell E4 can only set A(1-4), B(1-4), C(1-4), D(1-4), and E(1-3) as the grouping basis. It cannot select columns after F or rows below 5 as the grouping basis, and it cannot select itself as the grouping basis.
Text Grouping Basis
In some cases, the text content in complex tables also needs to be grouped and associated with other fields, expanding as other fields expand.
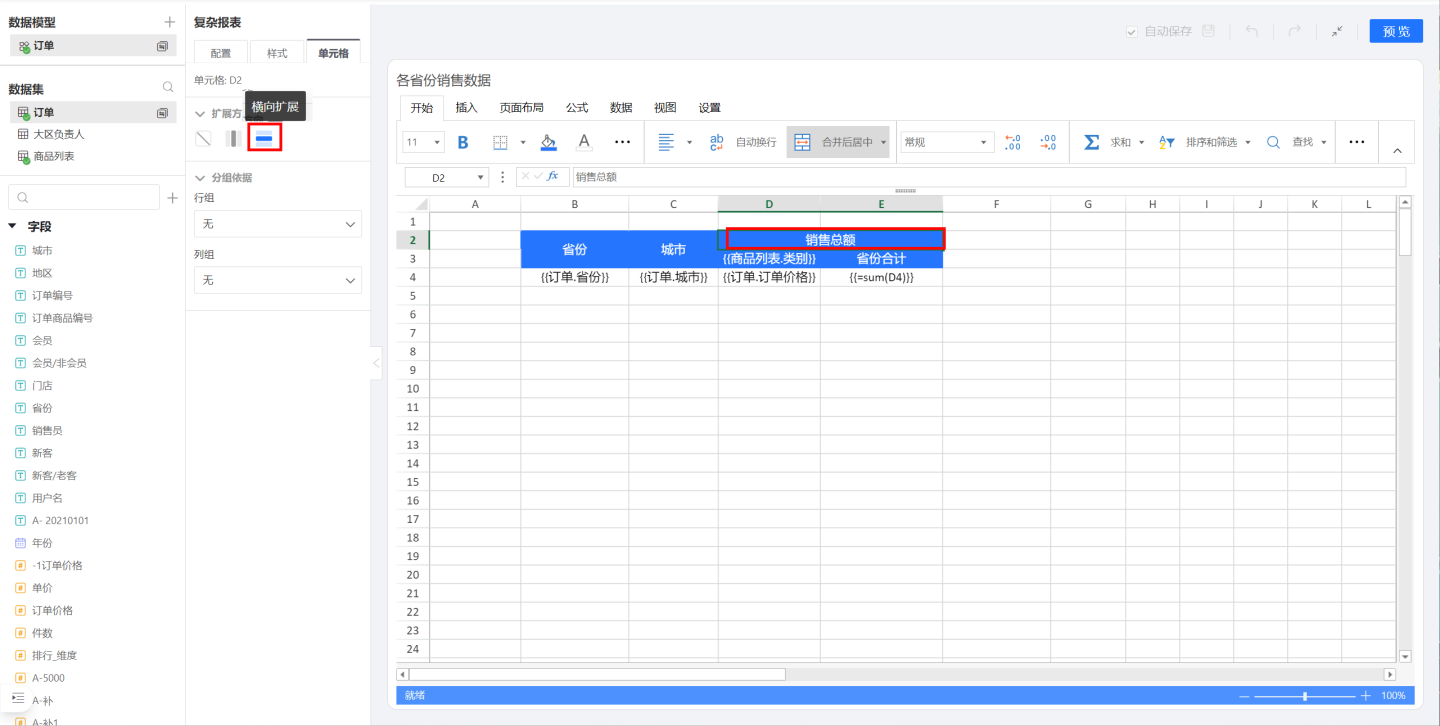
As shown in the figure, in the sales data of various provinces, 'Total Sales' and 'Province Total' are textual information, but D3 in the header {{Product List.Category}} is a field that will expand based on the field content. In this way, 'Total Sales' and 'Province Total' will also change along with the expansion of {{Product List.Category}}.
First, let's look at 'Total Sales'. It expands horizontally along with {{Product List.Category}}, so it should be set to expand horizontally in the expansion direction.
Next, let's look at 'Province Total'. 'Province Total' will expand along with {{Product List.Category}}. For example, there will be a province total for Fresh Produce, and another for Food, etc. Therefore, 'Province Total' should be grouped by {{Product List.Category}}.
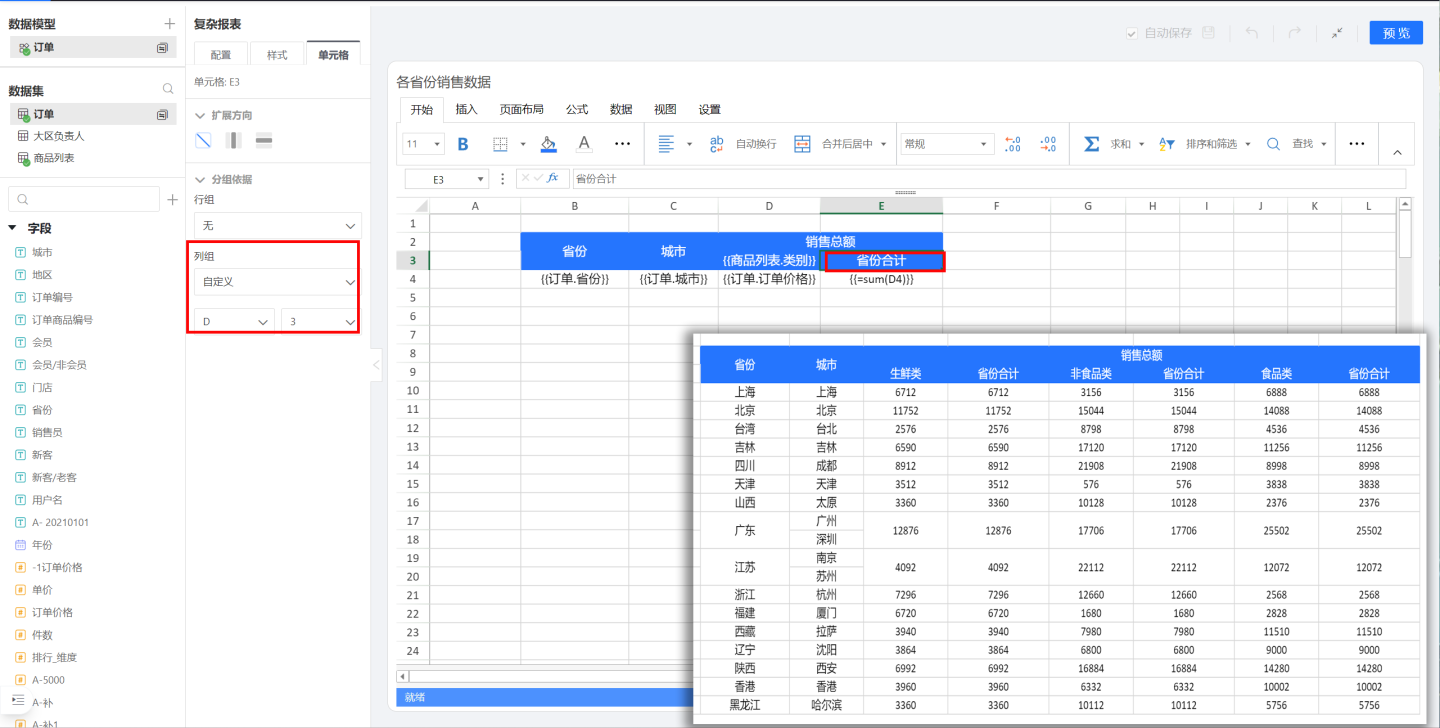
The dynamically expanding field {{Product List.Category}} needs to be displayed within the range of the 'Total Sales' cell. Therefore, the grouping basis of {{Product List.Category}} should be set to D2 to establish a connection with 'Total Sales'.
Data Calculation
The fields in complex reports inherit the original calculation capabilities of HENGSHI SENSE, supporting various advanced calculations, as well as calculations using Excel formula functions.
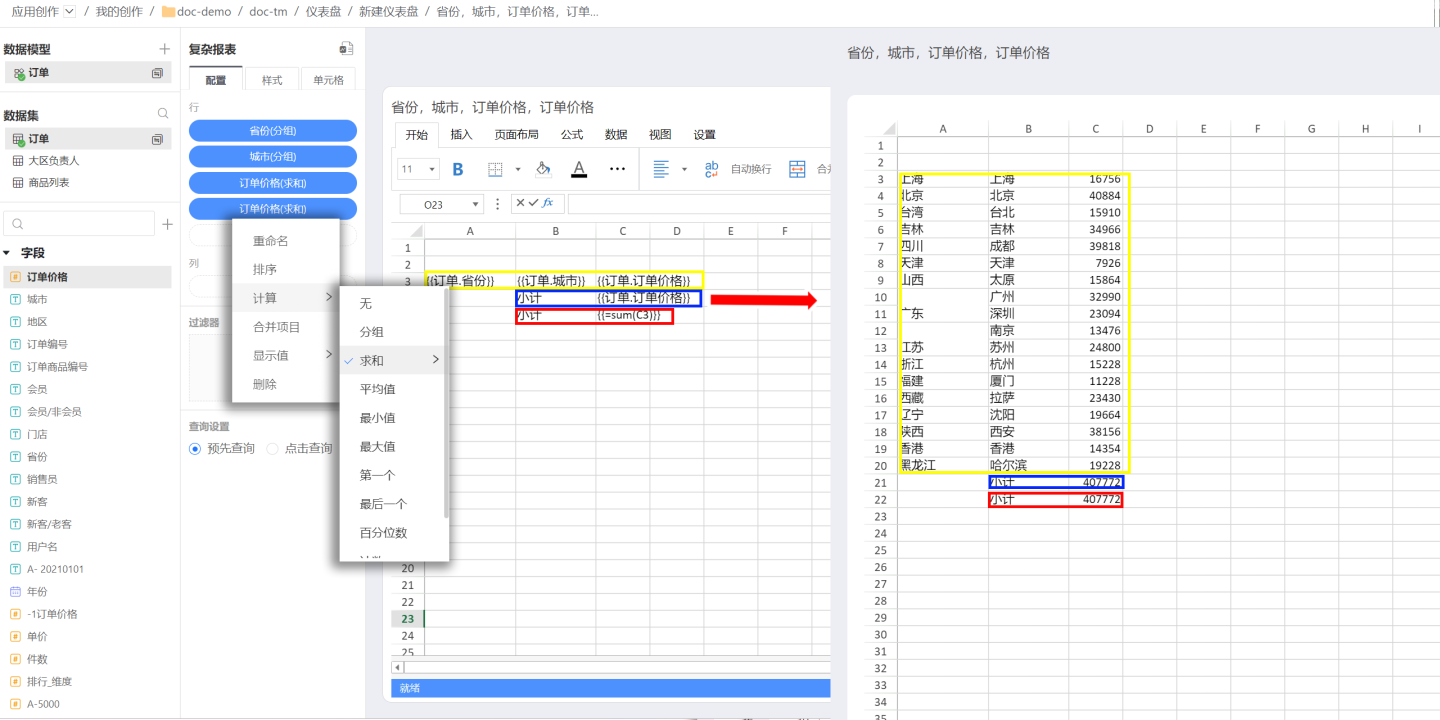
As shown in the figure, the complex report displays sales data for various cities (yellow area in the figure). To calculate the total sales data for each city, you can use HENGSHI's built-in calculation capabilities (blue area) or the Excel SUM function (red area).
Tip
- When using Excel functions, if you are calculating fields configured for cells, the formula needs to include
{{}}. The formula will apply to all data expanded from the cell fields. If you are calculating a specific cell value, you do not need to include{{}}. - The standard Excel functions supported by complex report fields are Sum, Count, Average, Max, Min, Product, StdDev, StdDevp, Var, and Varp. Other functions are not supported at this time.
Multi-Source Complex Reports
Unlike other charts, complex reports support simultaneous display and analysis of multiple data sources. These data sources can come from the same database or from multiple different databases.
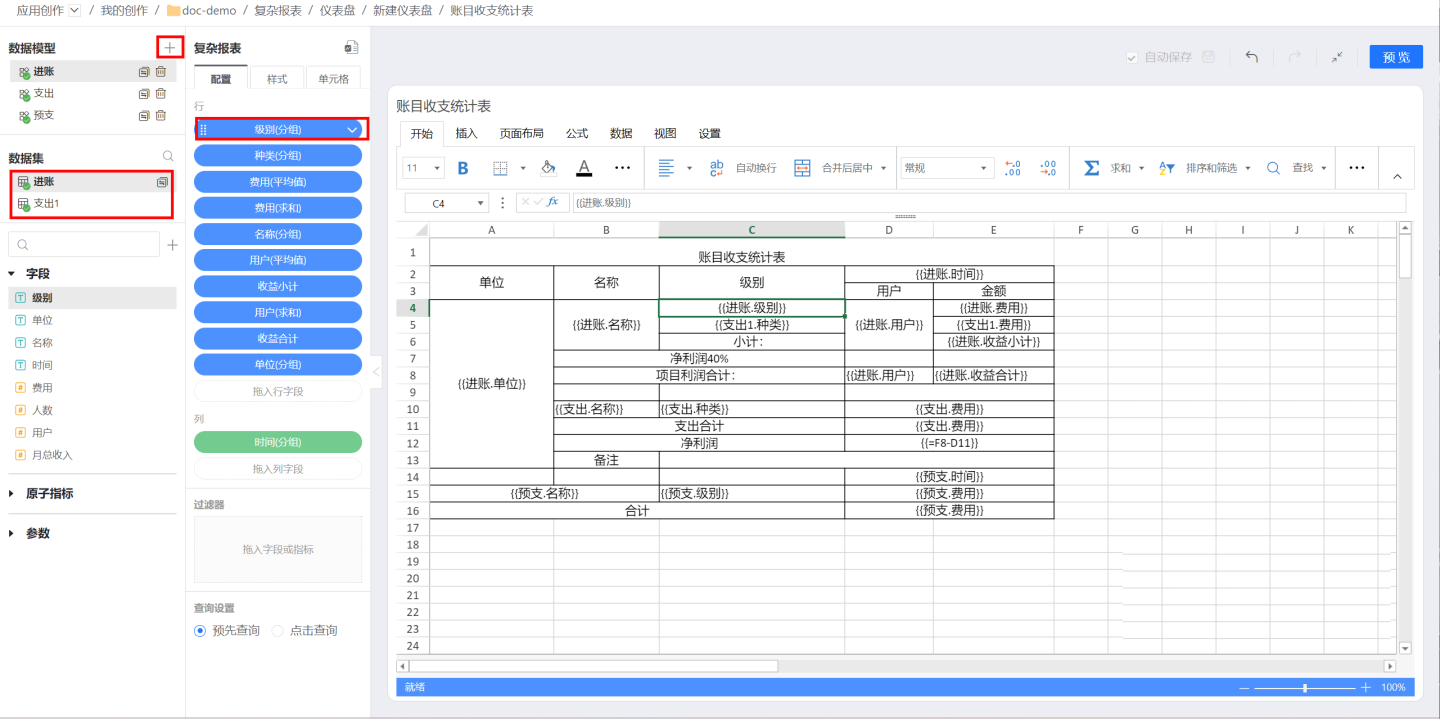
As shown in the figure, click the + icon on the right side of the data model to add new data. The configuration table on the left only displays the field configuration information related to the selected data model. For example, if the current selected model is Income, it shows the fields used in the Income model. If you want to configure or view the fields used in the Expenditure model, you need to click the Expenditure model to switch to it and select the field configuration.
Header Display
The headers of complex reports can be categorized into static headers and dynamic headers based on their variability. Static headers do not contain field information from configured data and remain unchanged once set. Dynamic headers, on the other hand, include data field information and change as fields expand. Below are examples of both types of headers.
Static Header
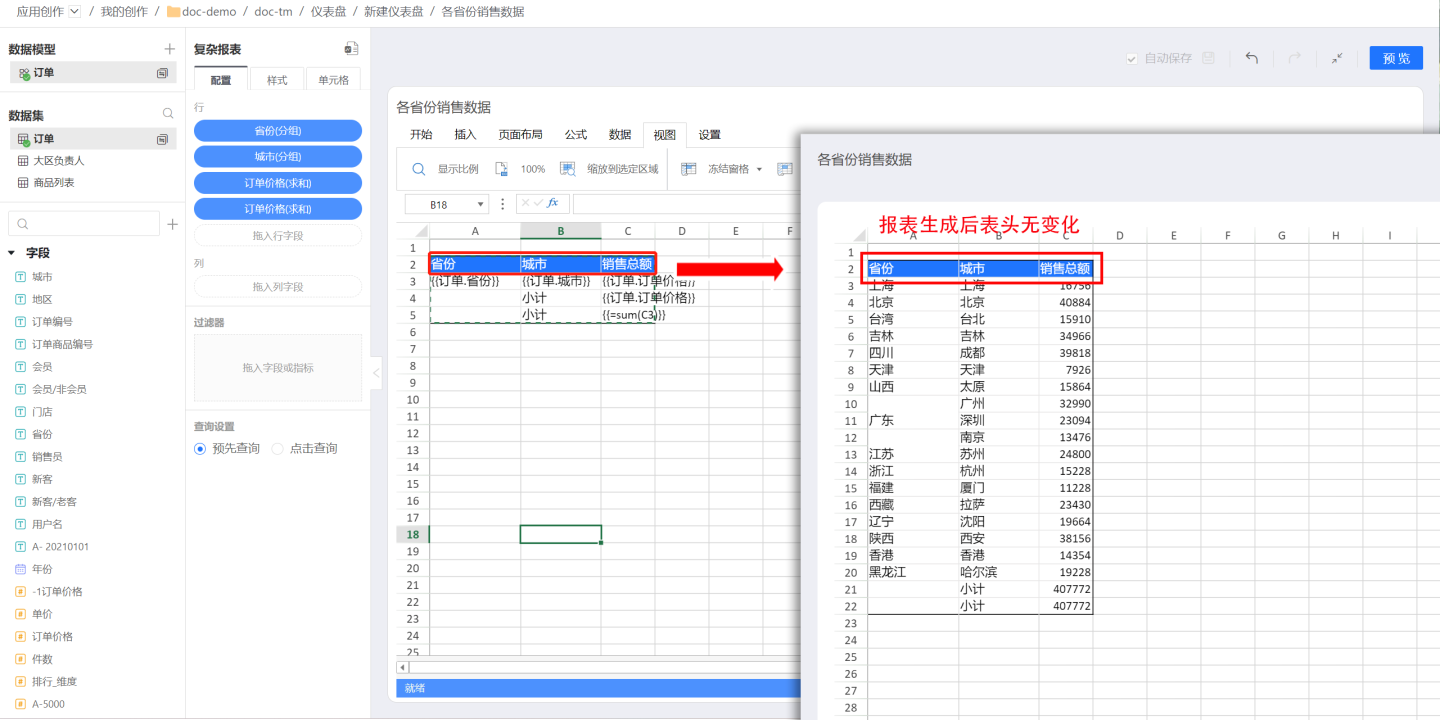
The static header consists of plain text information, does not include field information, and will not dynamically expand. The number of cells in the header is fixed. For example, as shown in the figure, the sales data report header for various cities is composed of three columns: Province/City, City, and Total Sales during editing, and the report will also only have these three columns when generated.
Dynamic Header
Dynamic headers refer to headers that contain field information, which change dynamically as fields expand. For example, in the sales data report of various cities, the sales data of different product categories need to be displayed. Therefore, the product category field is dragged into the header cell. This field dynamically expands based on product categories when generating the report, and the upper-level title "Total Sales" also dynamically expands along with the product categories. Such headers are called dynamic headers. 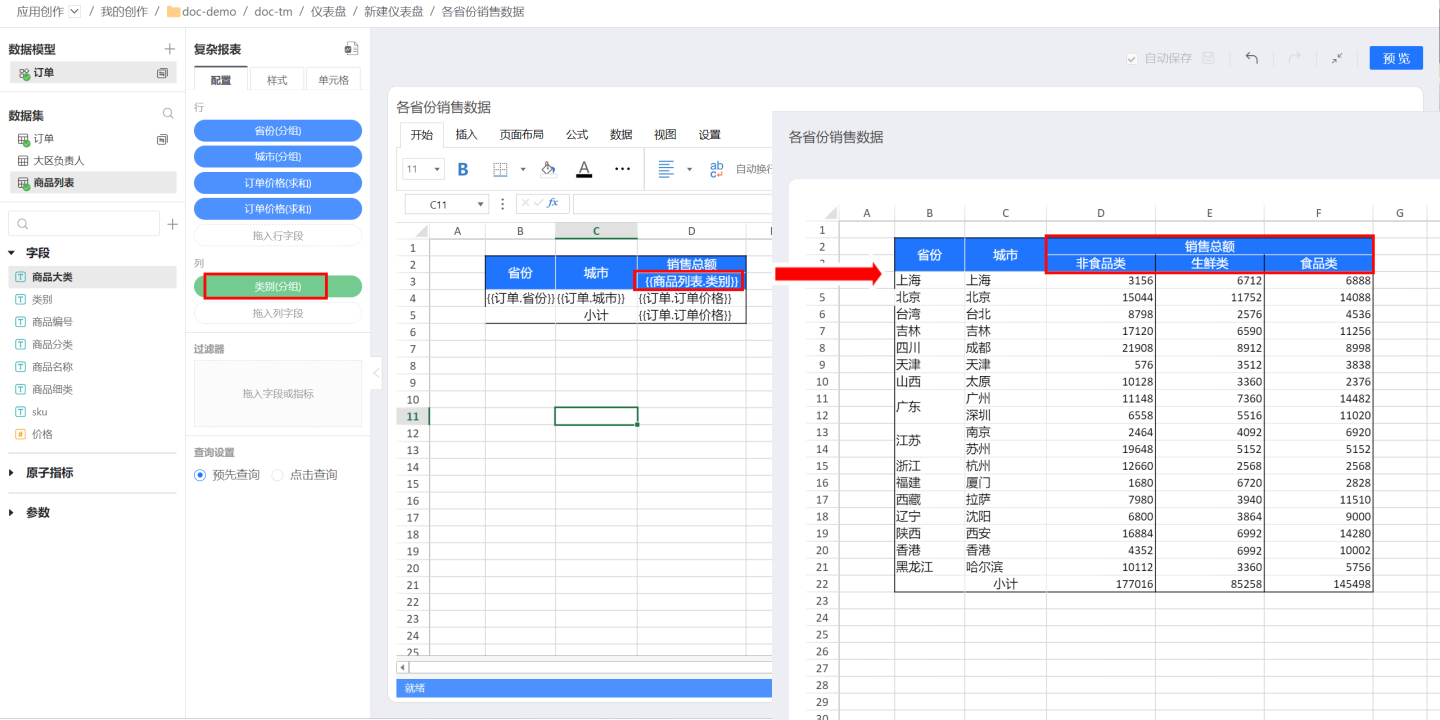
In dynamic headers, attention should be paid to the grouping basis of the fields. If a field is at the top level, it will not be restricted by other cells when it expands. If there is other text information above it, as in the example, the dynamically expanded field {{Product List.Category}} must be within the scope of the "Total Sales" cell. Therefore, the grouping basis of {{Product List.Category}} should be set to D2 to establish a connection with "Total Sales."
Complex Report Interactions
Image Settings
Complex reports support image recognition and display for data. You can follow the steps below to set up images.
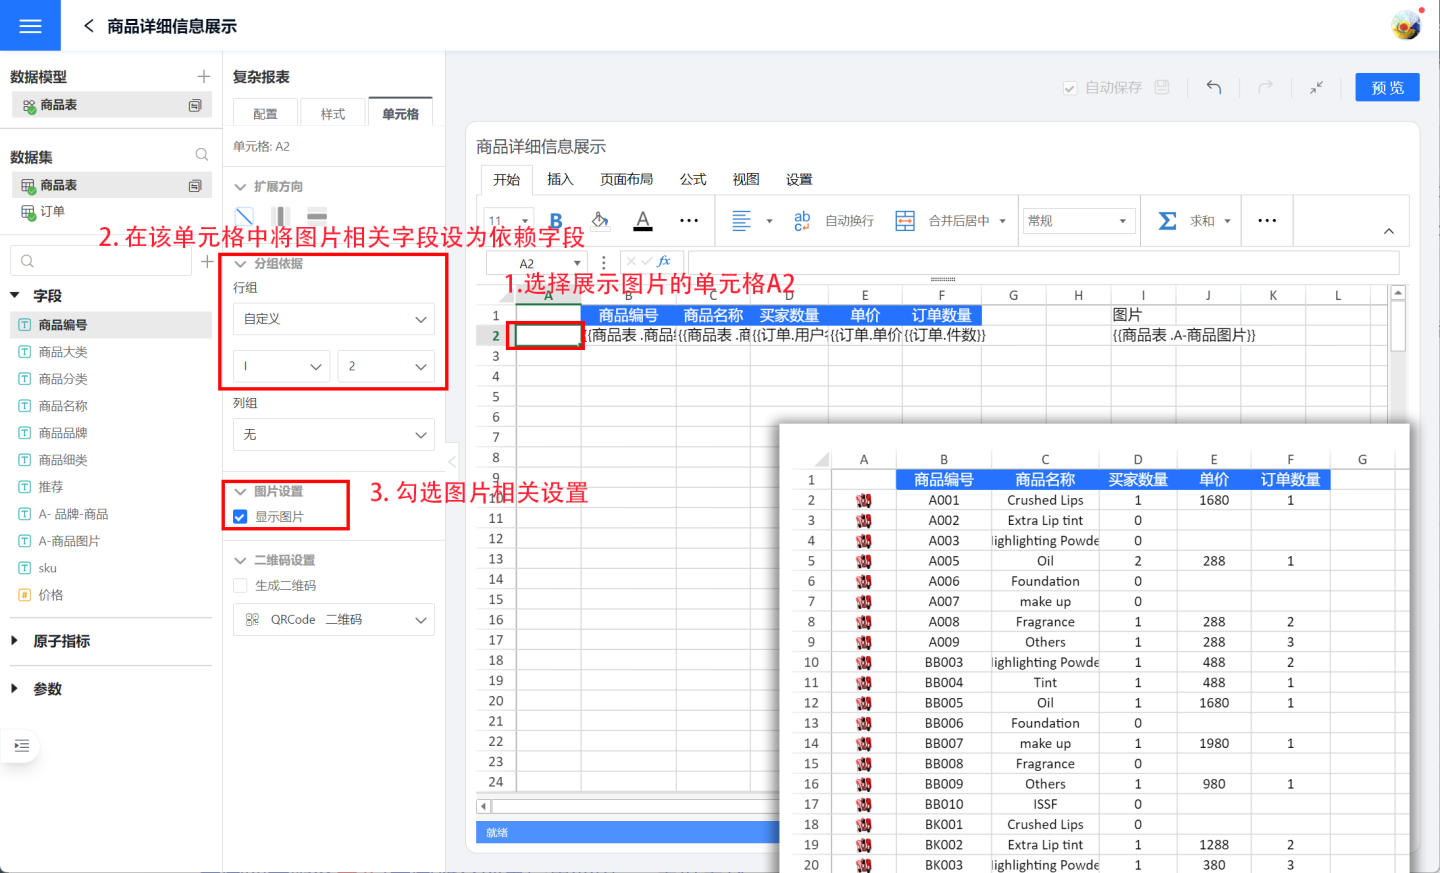
- Set the cell for displaying the image. In the example, cell A2 is selected to display the image.
- Drag the image information field from the dataset and set it as the reference field in the cell designated for image display. In the example, the image-related field is dragged into cell I2 (this column will not be displayed in the chart and will be hidden later), and the grouping reference in cell A2 is set to I2.
- Check the option to display images in the image settings.
- Once the image settings are complete, click Preview to view the setup effect.
QR Code Settings
For complex reports, the report content can be generated into QR codes or barcodes. Currently, the supported types include QRCode, PDF417, GS1_128 barcode, EAN8 barcode, EAN13 barcode, Code93 barcode, and Codabar barcode. Below, we use QRCode as an example to demonstrate how to use the QR code settings feature.
Setting up a QR code involves three steps:
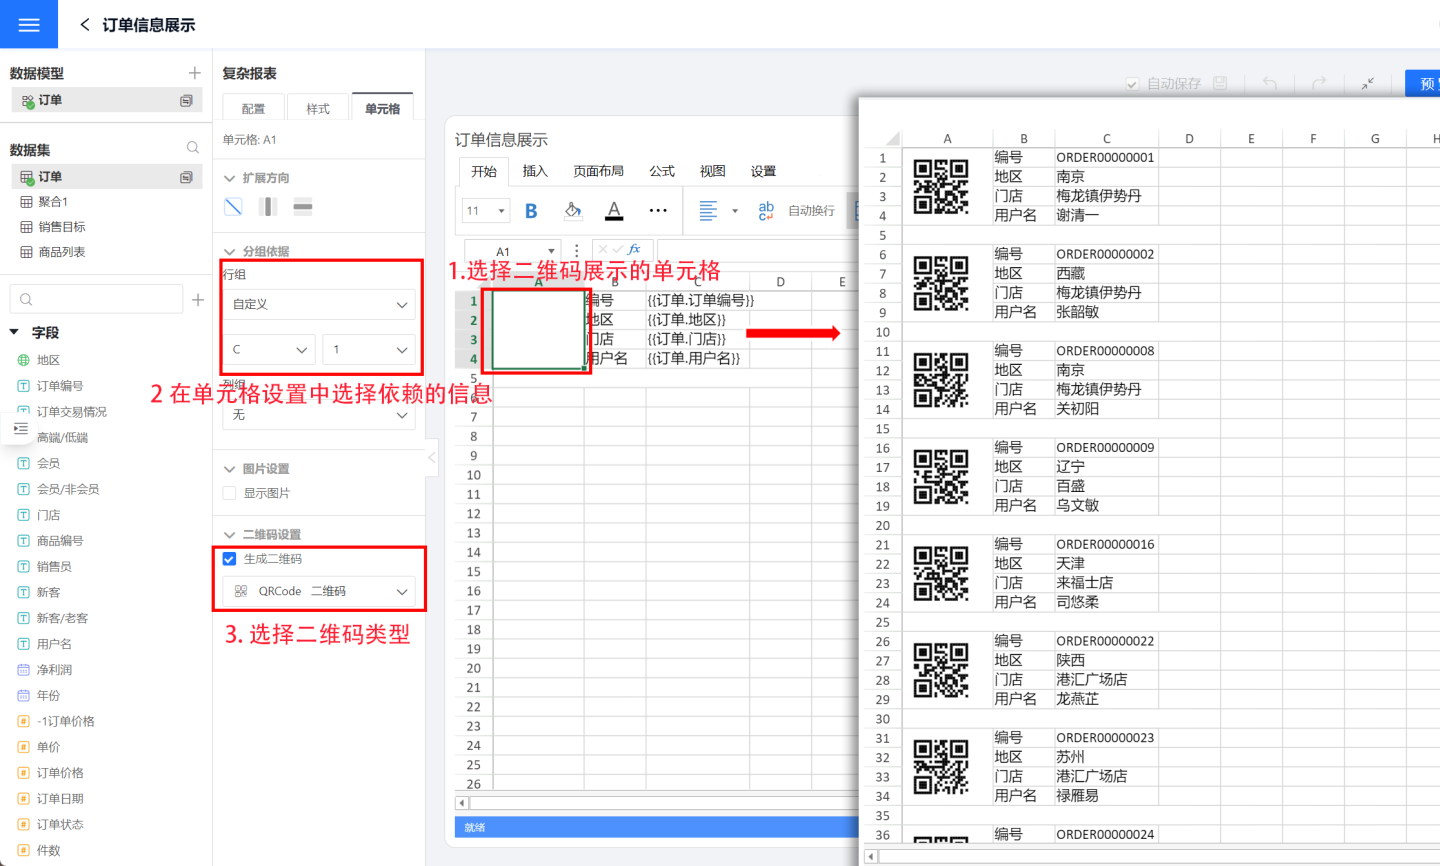
- Select the cell where the QR code will be displayed. In the example, the QR code is displayed in cell A1.
- Drag the field to be displayed as a QR code into the designated cell, and set the displayed content in the QR code cell as the grouping basis. In the example, the order code in cell C1 is displayed as a QR code, so the grouping basis in cell A1 is set to C1.
- Choose the type of QR code to display. In the example, the QRCode type is selected.
- Once the QR code settings are complete, click Preview to view the effect of the settings.
Pagination
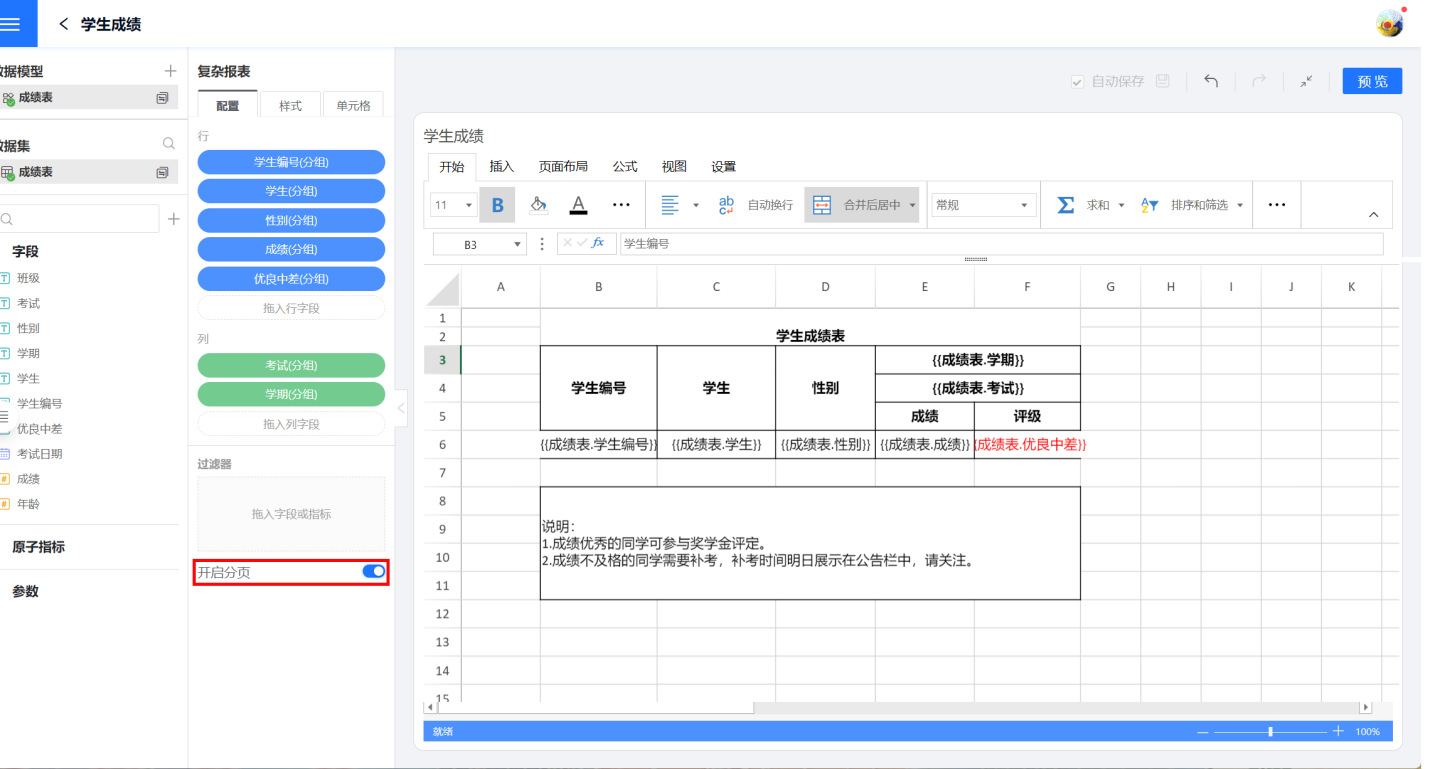
When dealing with complex report data with a large amount of content, you can set pagination for the complex report display. Each page shows a fixed page size of content, and content exceeding the page size is displayed on the next page. Users can view the content of the pages through the pager. To use the pagination feature, you need to enable the pagination switch.
To make the data display more aesthetic, smooth, and complete during pagination, the following settings are supported:
- Merge cells across pages
- Specify cells to repeat display
- Specify cells to display together
- Prevent page breaks
Merged Cells Across Pages Display
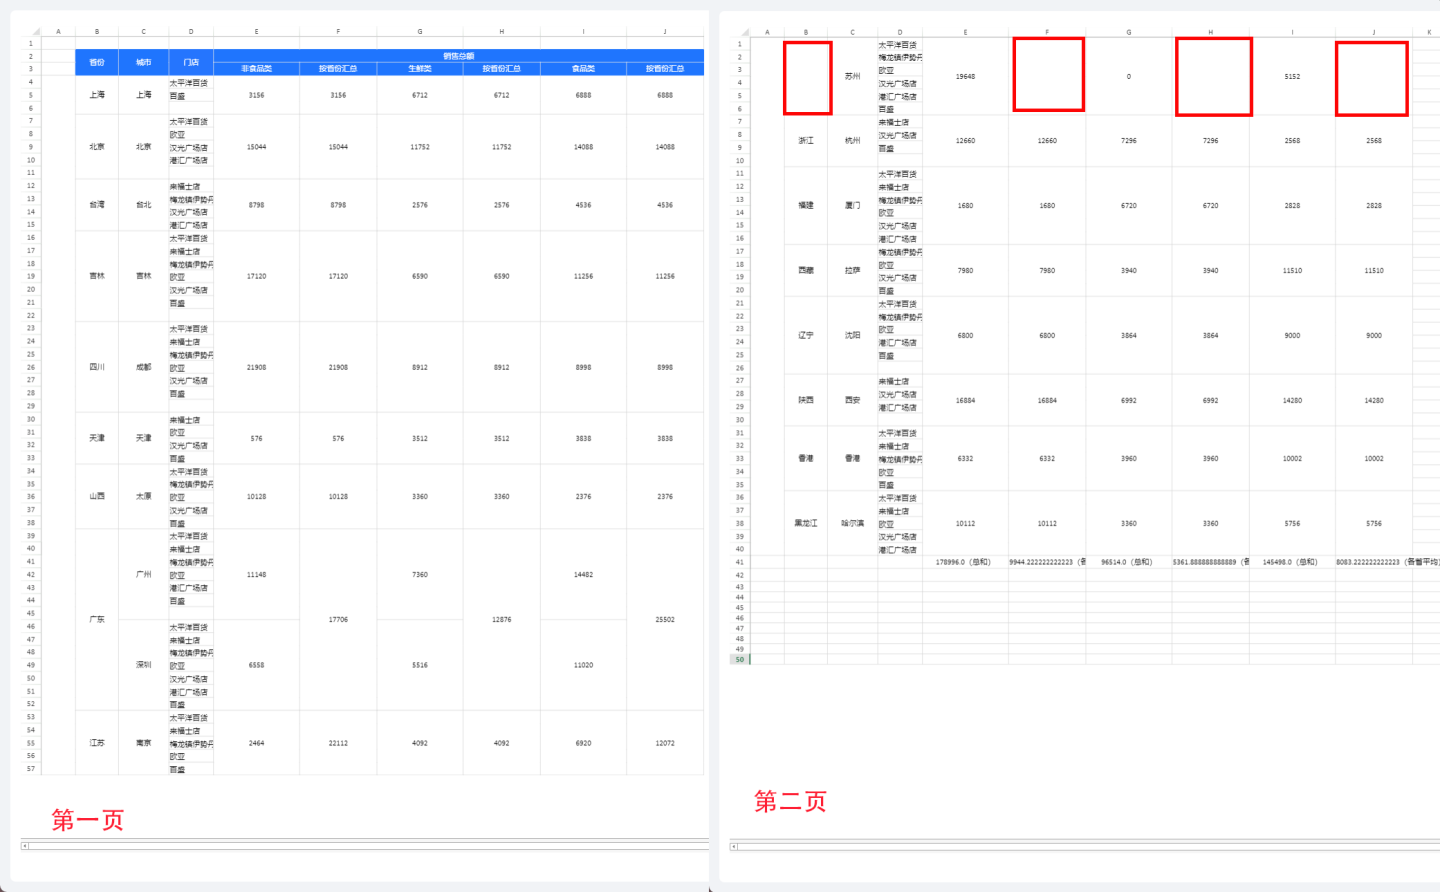
When merged cells are split across two pages, the content is typically displayed only in the cell on the first page, leaving the cell on the second page blank. As shown in the figure, the red box on the second page contains no data. This lack of content may cause confusion when viewing the data, requiring users to flip back to the previous page to retrieve the content of the merged cell.
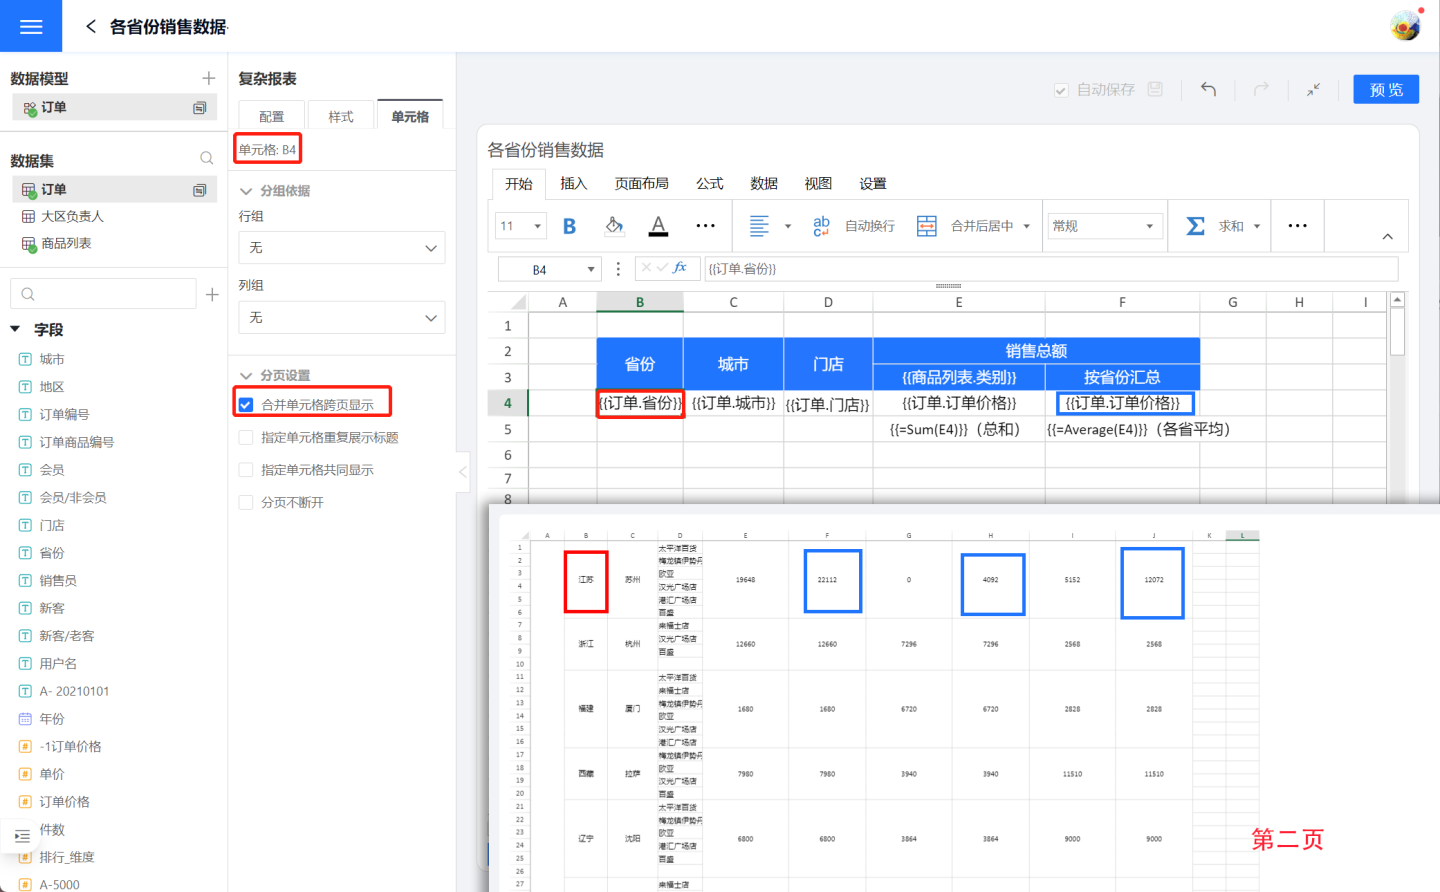
Complex reports support displaying merged cells across pages, meaning that when merged cells span multiple pages, the content is displayed on every page. In the example above, after enabling the "Merged Cells Across Pages Display" setting for "Jiangsu Province" and the corresponding "Province Summary," the data will be displayed on every page. First, select cell B4{{Order.Province}} (red box), and then check the "Merged Cells Across Pages Display" option in the pagination settings. Apply the same setting to the order price summary by province (blue box). The preview effect is shown in the figure below, where the cell "Jiangsu Province" and the corresponding "Province Summary" display data on every page.
Specified Cell Repeated Display
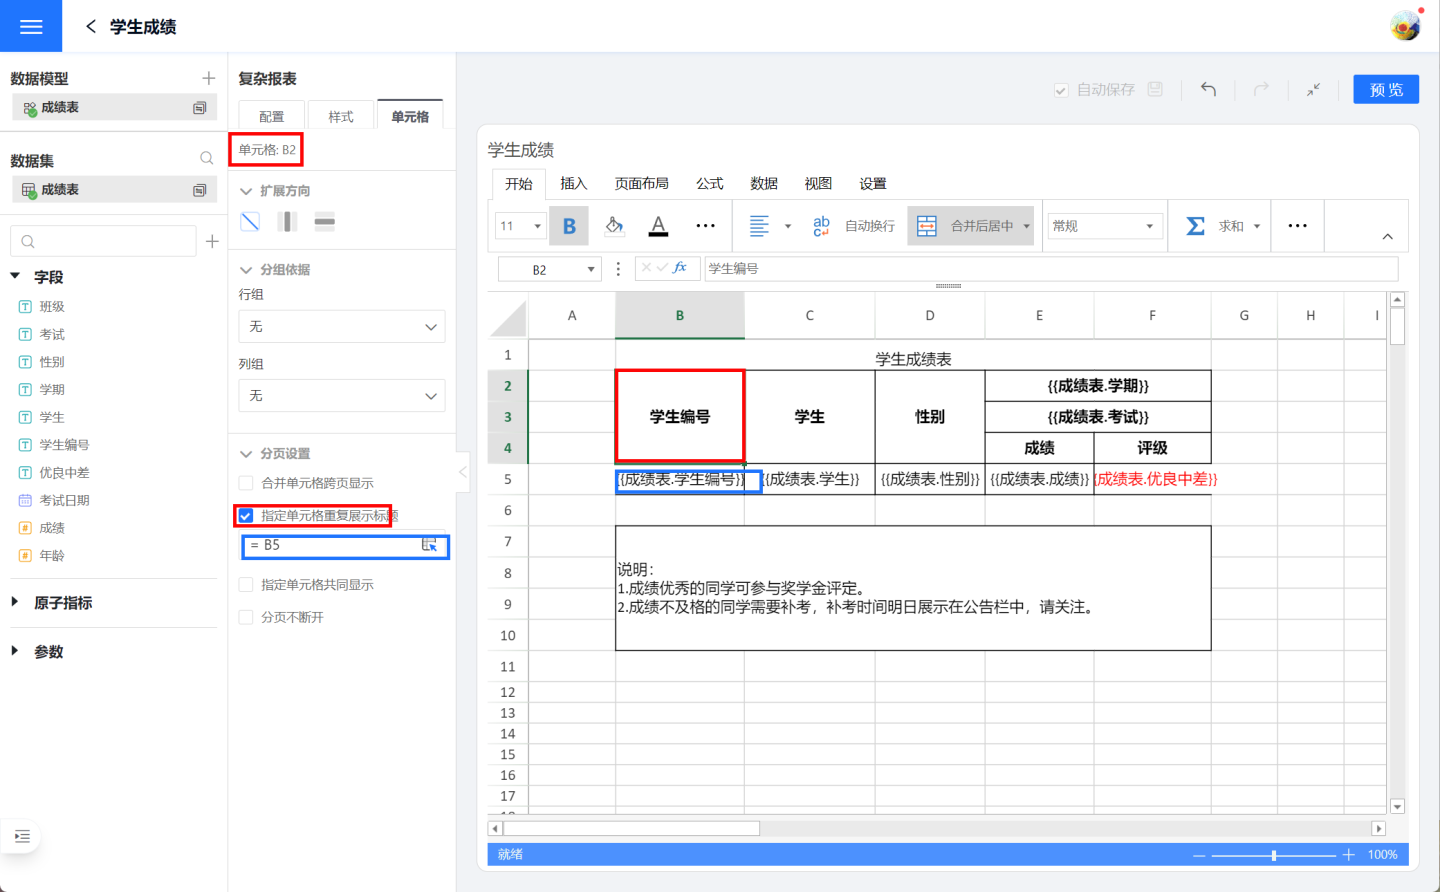
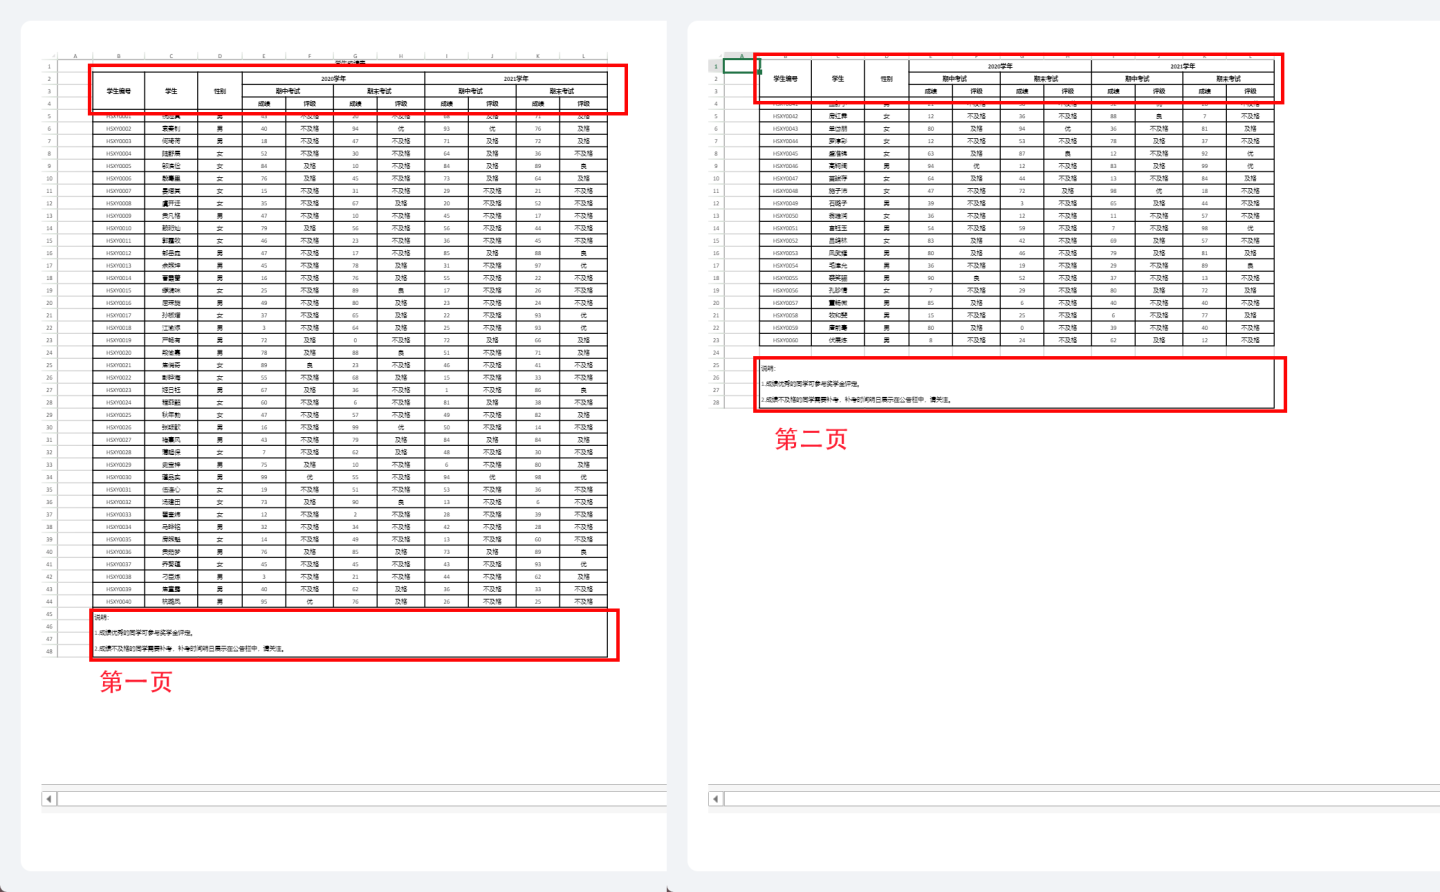
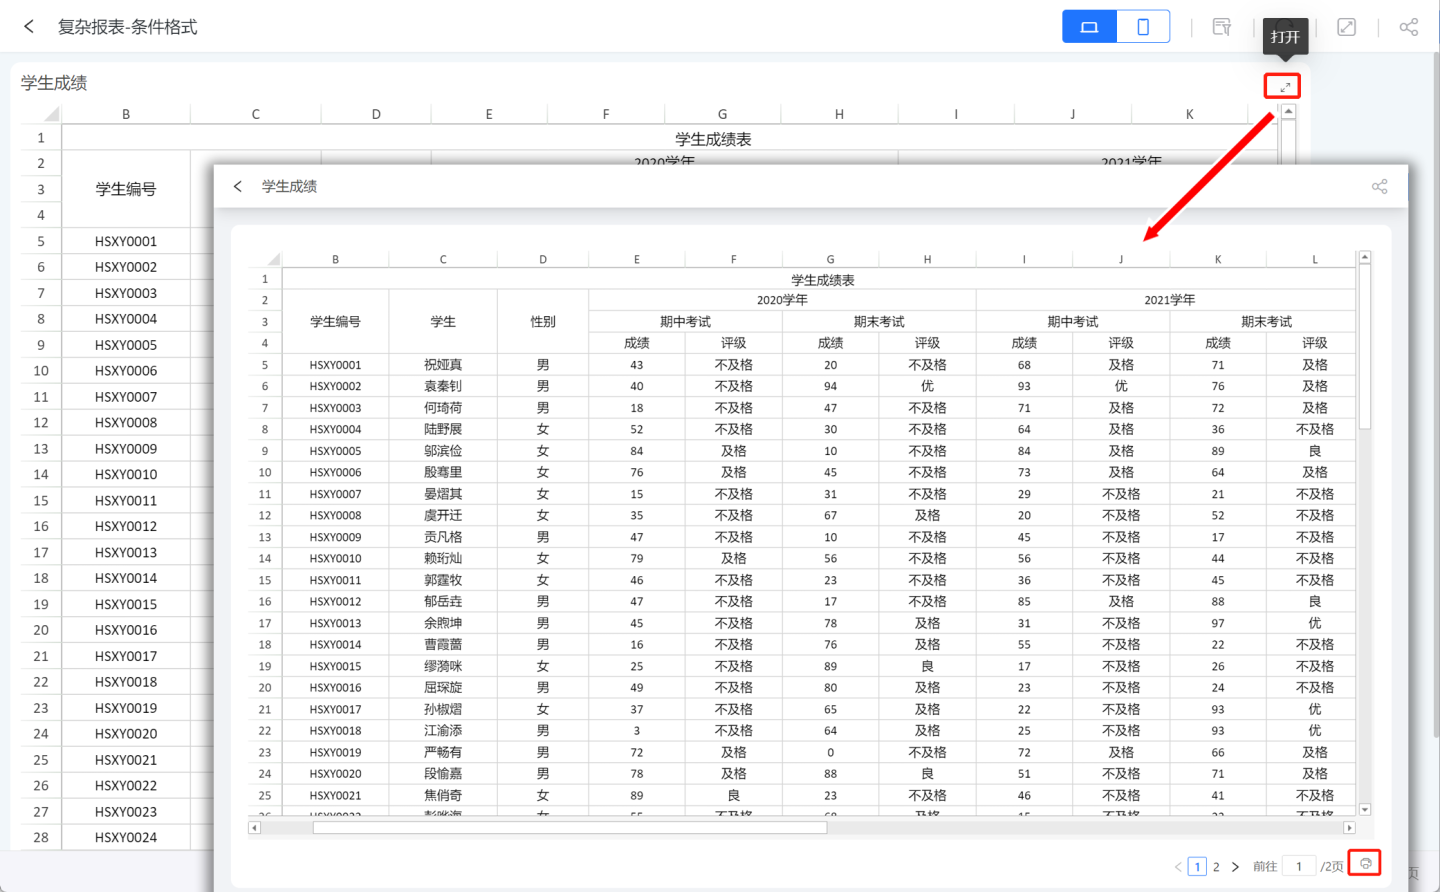
Specified cell repeated display refers to certain cells being repeatedly displayed on the page, commonly used for header or footer explanatory information. As shown in the figure, when the student grade table is paginated, it is desired to display the header and explanatory information on each page. Therefore, pagination settings are applied to the header cell B2 (red box), setting it to follow cell B5 (blue box) for display, ensuring that the header is displayed on each page when student grades are shown. Similarly, pagination settings are applied to the explanatory information cell B7, setting it to follow cell B5 for display, ensuring that the explanatory information is displayed on each page when grades are shown.
The paginated effect after the settings is shown in the figure, where the header and explanatory information are displayed on each page.
Specify Cells to Display Together
When a report is displayed in pages, data exceeding the system's specified page size will be split across pages. This may result in related data being displayed on separate pages, causing isolated rows on a single page and breaking the data continuity. As shown in the figure, the report displays the sales performance of store products in various cities. During the report display, the city "Hangzhou" and its associated stores are split across two pages.
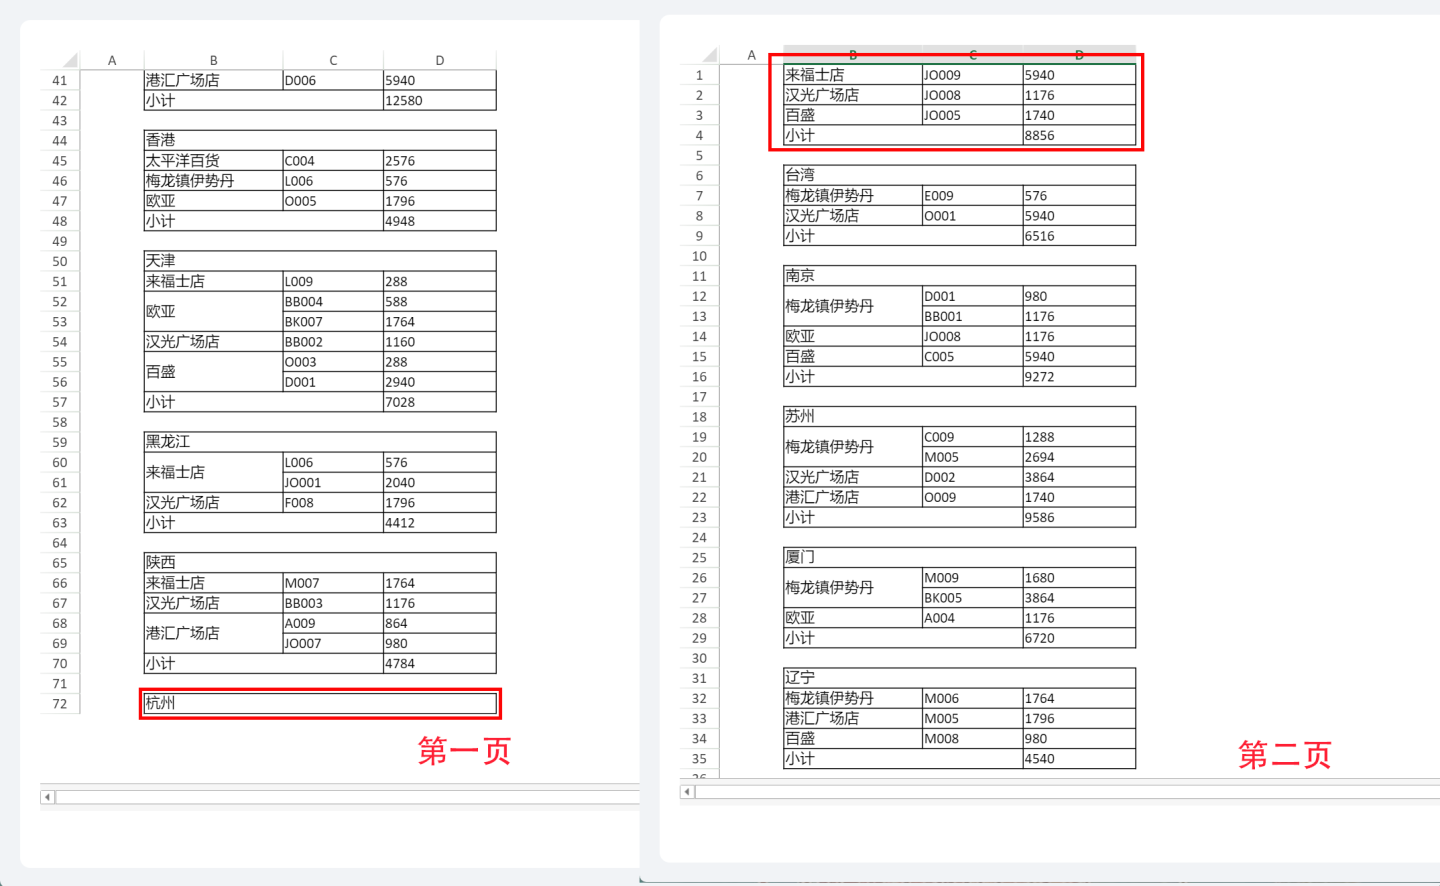
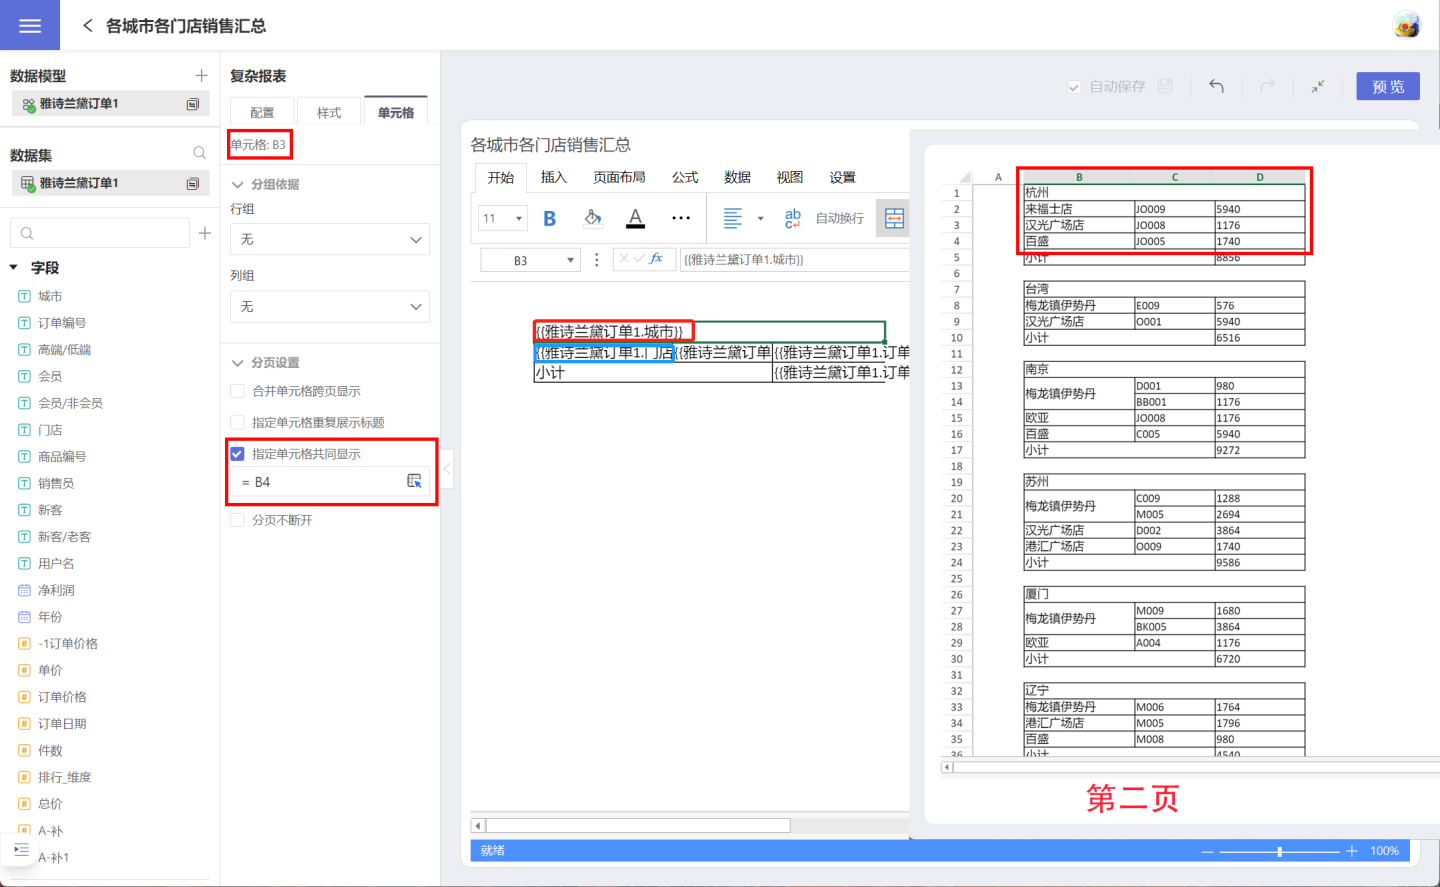
To ensure that the city and its associated stores are displayed together, set the pagination for cell B3, where the city is located, so that it displays together with cell B4, where the stores are located. After the setting, the city "Hangzhou" will no longer be displayed as a single row but will be shown together with its associated stores.
Pagination Keep Together
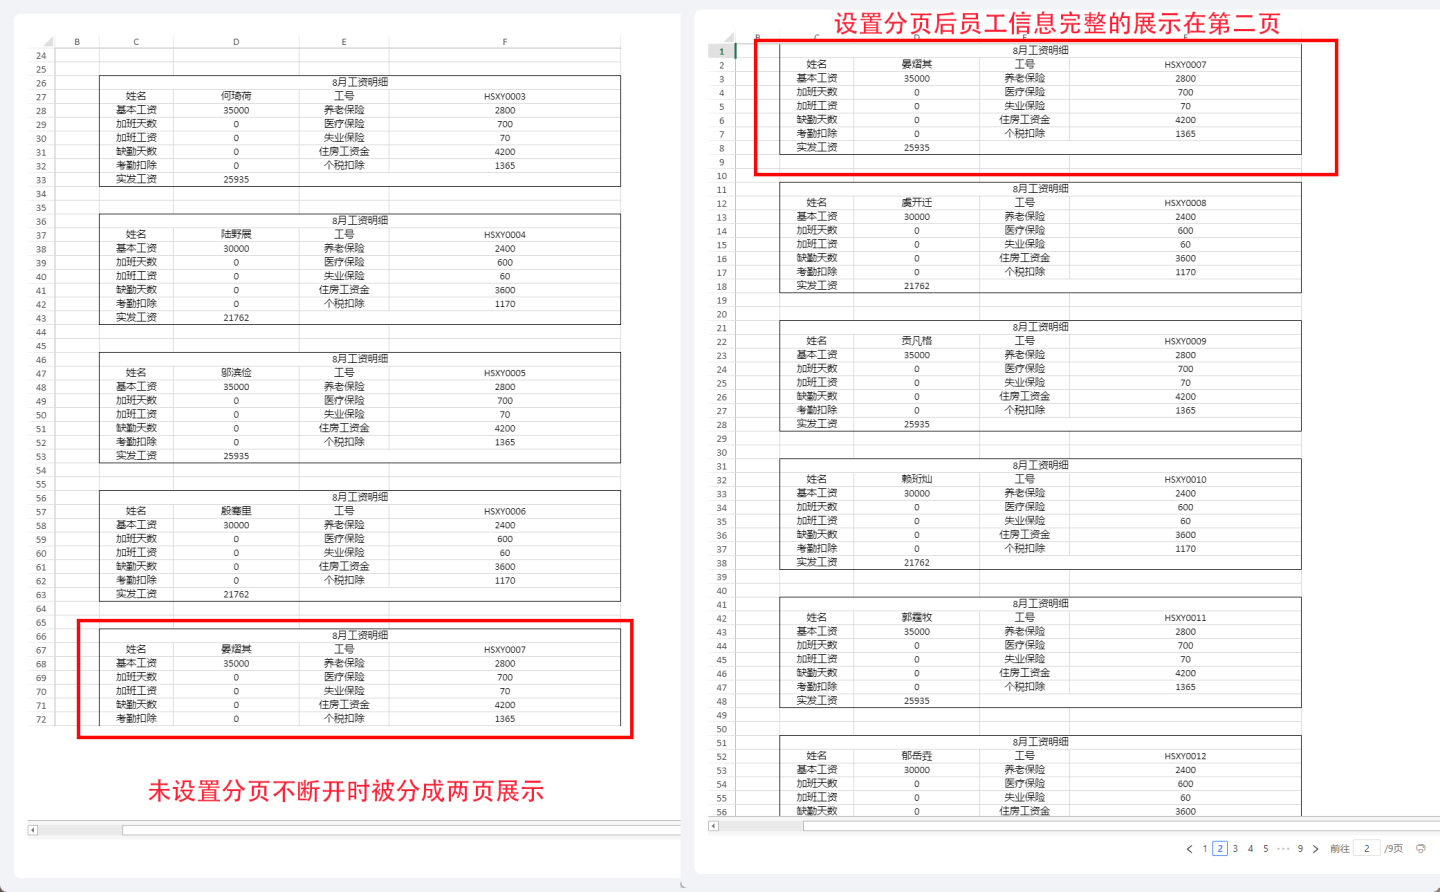
During report pagination, some complete information may be split into two parts. In such cases, you can use the pagination keep-together setting to display the complete information together. As shown in the example of a payroll report for a certain organization, it is desired that each employee's information is displayed completely on one page without being split due to pagination. Set the pagination keep-together in the table header C6 (red box), specifying the range from the table header C6 to the end of the payroll details row F13 (blue box) to keep it together.

When the pagination keep-together is not set, the information for the employee "Yan Yiqi" is split across two pages. After setting it, the information for "Yan Yiqi" is displayed completely on the second page.
Tip
Pagination keep-together requires selecting all the cells within the range to be kept together. The setting applies to the range of display cells. In the example above, the keep-together range is set from C6 to F13. If there is only one row of data, set the entire row.
Print
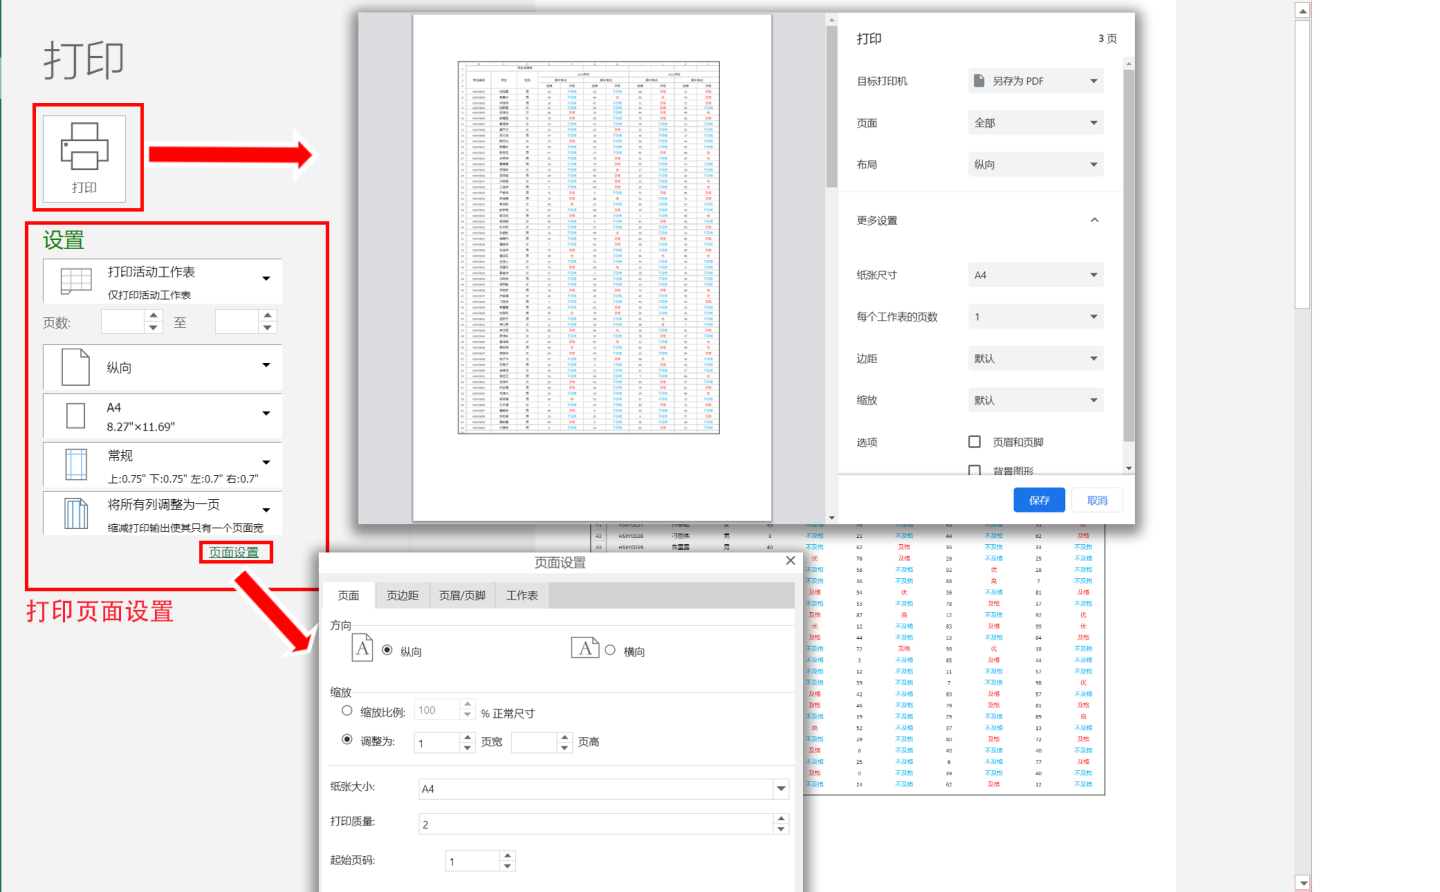
Complex reports support printing. When you open a report in the App Market, there is a print button in the lower right corner. You can click the button to print.
On the print page, you can set the number of pages, page layout, margins, headers/footers, and worksheets. Clicking "Print" will bring up the print dialog, where you can configure the printer settings to print. The functionality of each print option is not described in detail here.
Complex Report Publishing
Complex reports in the published state support operations such as data filtering, sorting, column hiding, editing, inserting, and copying.
Interaction with Other Controls
Complex reports currently do not support interaction with other controls.
Usage Restrictions and Considerations for Complex Tables (Complex Reports):
- Row limit not applicable: The system's setting to limit the number of rows exported in a table does not apply to complex tables. Since complex tables support rendering results from multiple datasets through templates, the row limit for a single table export is not meaningful in this context, and this restriction is not supported for complex tables.
- Data source row limit: The process of rendering templates with data in complex tables involves computation, which is memory-intensive. Therefore, we impose a row limit on the data used for rendering templates, with a default of 500,000 rows. This can be modified using the configuration item
COMPLEX_TABLE_DB_QUERY_LIMIT. Considering memory usage, it is recommended not to set this value too high. - Display format settings: The display format is set within cells, which differs from other charts where it is set on axes.
- Exporting Chinese characters garbled: If Chinese characters appear garbled when exporting to PDF or Excel, ensure the server has the appropriate Chinese fonts installed and set the
GRAPECITY_GCEXCEL_FONTS_PATHconfiguration item to point to the parent directory of the font location. - Cross-source calculations in templates not supported: Cross-data-source calculations using template formulas are not supported. For such requirements, you need to merge the data sources at the dataset level before using them in complex tables.
- Printing overall borders: When printing complex tables, an overall border will appear. If unnecessary, it is recommended to download the data and print it afterward.
- Null value display issues: Null values in templates may appear as strange numbers and sometimes cause browser crashes. It is recommended to replace null values before rendering, such as replacing null values in the dataset.
- Conditional formatting invalid under pagination: When pagination is enabled, conditional formatting becomes invalid. In such cases, it is recommended not to enable pagination.
- QR code recognition invalid under pagination: When pagination is enabled, QR code recognition becomes invalid. In such cases, it is recommended not to enable pagination.
- Image recognition invalid under pagination: When pagination is enabled, image recognition becomes invalid. In such cases, it is recommended not to enable pagination.
- Double equals formula templates invalid under pagination: When pagination is enabled, double equals formula templates (e.g.,
{{==round(B8-C8,2)}}) become invalid. In such cases, it is recommended not to enable pagination. - Non-grouped aggregation for text and date not supported: Text and date types in the axes of complex tables can only perform grouped calculations and cannot perform aggregations like max. Such configurations may cause display anomalies. It is recommended to perform aggregations in the dataset and then render the complex table in detail mode.
- Only one sheet allowed: Currently, templates with only one sheet are supported; multiple sheets are not supported.
- Detail and aggregated data are calculated separately: In the axes of complex tables, if one axis is detailed and the other is aggregated, one should not be set as the grouping basis for the other. If set, it will not take effect.
- Exporting to Excel causes QR codes and images to become invalid: QR code generation and image URL recognition are features of complex tables, not Excel. Therefore, exporting to Excel will result in QR codes and images becoming invalid.