Data Agent
Overview
In HENGSHI SENSE, with the power of large language models, the Data Agent helps users fully utilize their data. Based on a conversational interaction experience, the Data Agent assists users in tasks ranging from instant business data analysis to metric creation and dashboard generation. We will continue to integrate Agent capabilities into the product, aiming to improve the efficiency of data analysts and data managers, and to simplify workflows and complex tasks.
Installation and Configuration
Prerequisites
Please ensure the following steps are completed to make the Data Agent available:
- Installation and Startup: Complete the installation of the HENGSHI service according to the Installation and Startup Guide.
- AI Deployment: Complete the installation and deployment of related services according to the AI Deployment Documentation.
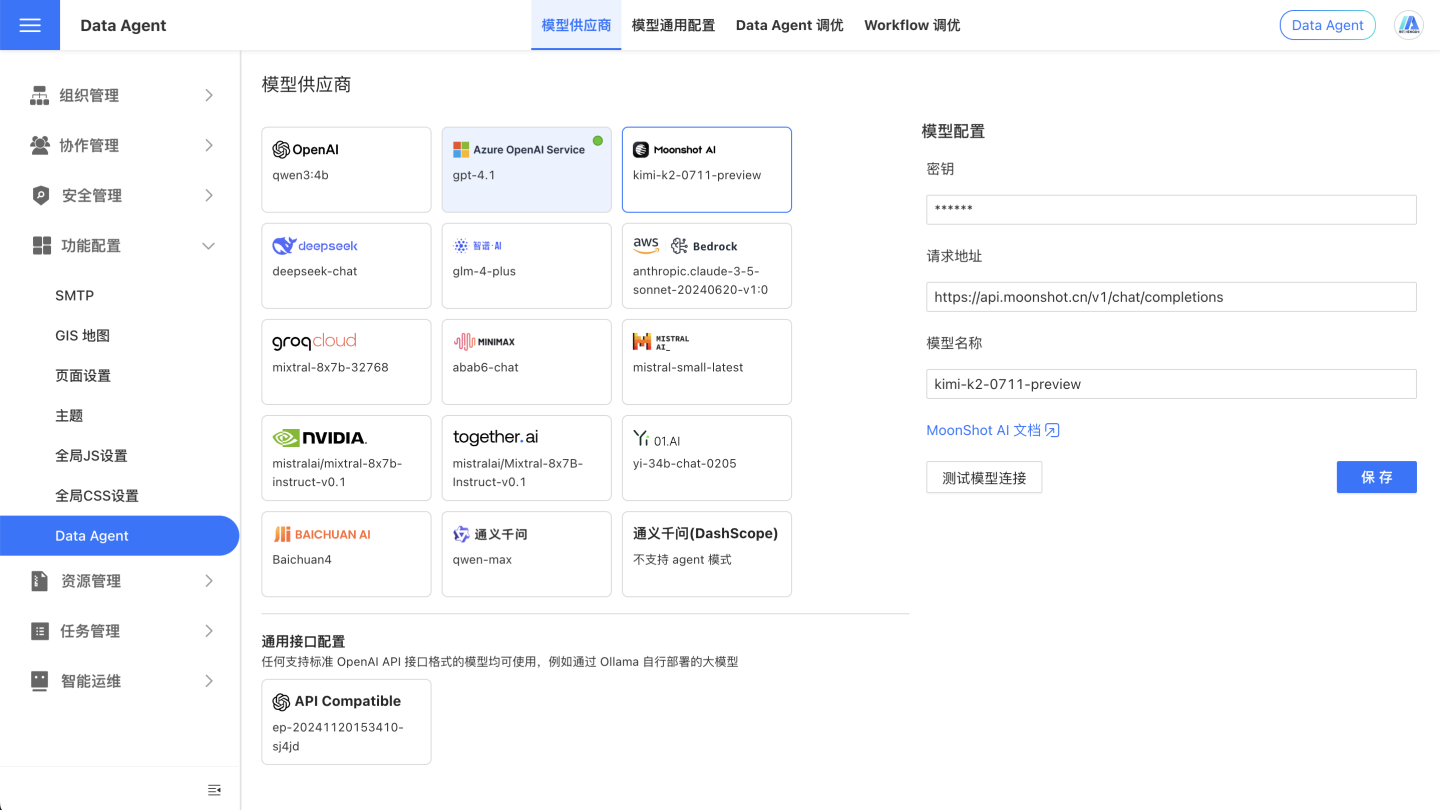
Configure Large Model
On the System Settings - Feature Configuration - Data Agent page, configure the relevant information.
User Guide
Before using Data Agent, some data processing is required to ensure that Data Agent understands the unique business context, can prioritize accurate information, and provides consistent, reliable, and goal-oriented responses.
Preparing data for Data Agent lays the foundation for a high-quality, practical, and scenario-aware Data Agent experience. If the data is disorganized or ambiguous, Data Agent may struggle to understand it accurately, resulting in superficial, off-target, or even misleading outcomes.
By investing effort in data preparation, Data Agent can truly grasp the business scenario, accurately capture key information, and deliver responses that are not only stable and reliable but also highly aligned with your objectives, maximizing the effectiveness of Data Agent.
Note
AI behavior is inherently uncertain; even with identical input, AI may not always produce exactly the same response.
Writing Prompts for AI
Industry Terminology and Proprietary Knowledge
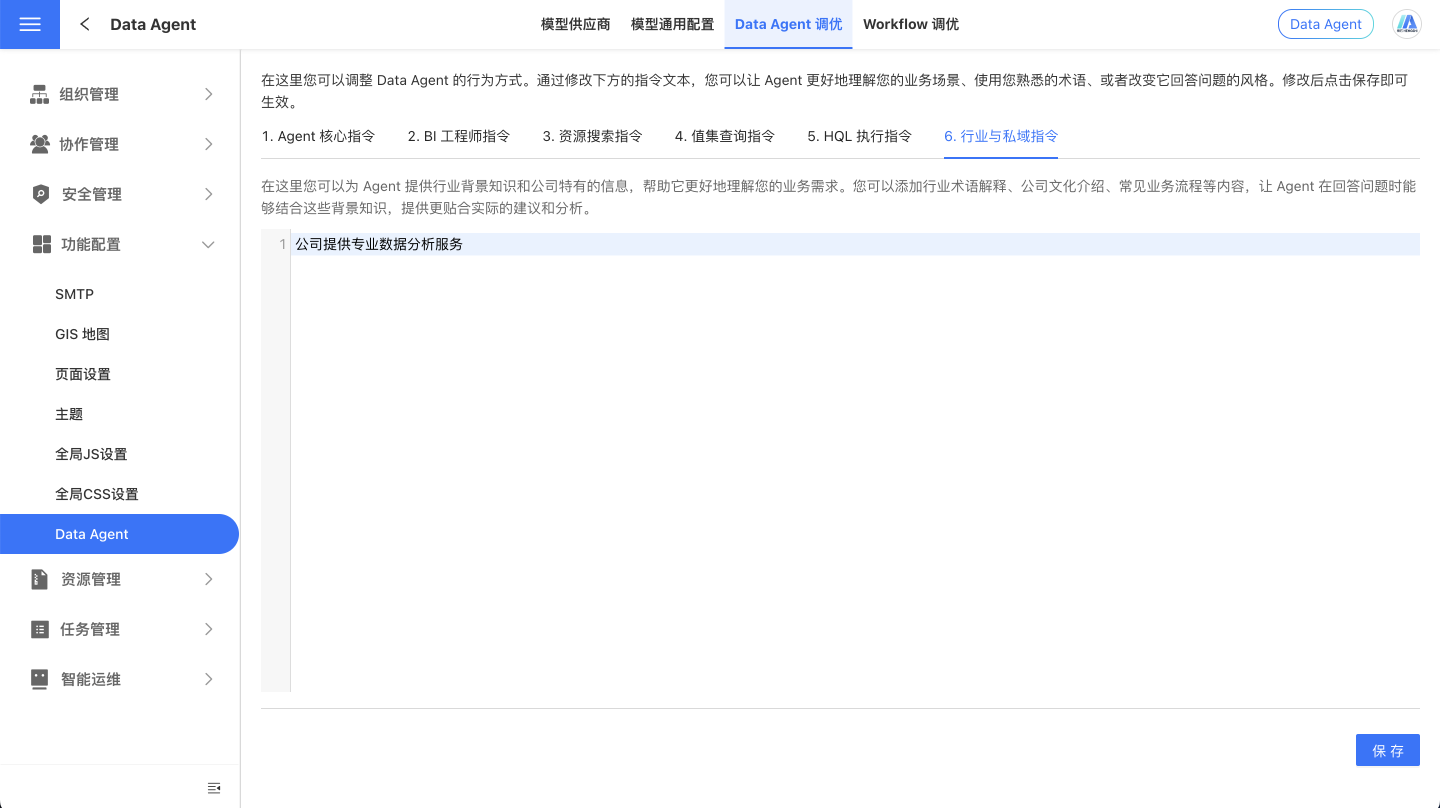
To enable the large model to perform at its best, we provide a prompt configuration feature in the Data Agent Console under system settings. You can use natural language in the UserSystem Prompts to supply the large model with information such as, but not limited to, your company's industry background, business logic, analytical guidance, and specific instructions. Data Agent will utilize these directives to understand your organization's internal language habits, professional terminology, and analytical priorities, accurately interpreting the specialized terms and analytical expectations of your field, thereby improving the quality and relevance of its responses.
Prompts can help Data Agent respond according to your industry, strategic goals, terminology, or operational logic, ensuring users receive more accurate and relevant data analysis. For example:
- "Major Promotion" refers to the period from October 11th to November 11th each year.
- When users mention product-related issues, please retrieve both the product name and product ID.
Dataset Analysis Rules
In the Knowledge Management section of the dataset, you can use natural language to describe in detail the purpose of the dataset, implicit rules (such as filter conditions), synonyms, and the mapping between proprietary business terms and fields/metrics, to guide the Data Agent on how to perform certain types of analysis. For example:
- "Small orders" refer to orders where the total quantity under the same order number is less than or equal to 2.
- "Fiscal year" refers to the period starting from December 1 of the previous year to November 30 of the current year. For example, fiscal year 2025 refers to 2024/12/1 to 2025/11/30, and fiscal year 2024 refers to 2023/12/1 to 2024/11/30.
- When asked about AAA, also list the metric data for BBB, CCC, DDD, etc.

Note
It is very important to understand best practices for prompt engineering. AI may be sensitive to the prompts it receives, and the construction of prompts will affect the AI's understanding and output. The characteristics of effective prompts are as follows:
- Clear and specific
- Use analogies and descriptive language
- Avoid ambiguity
- Use markdown to write in a structured, topic-based manner
- Break down complex instructions into simple steps whenever possible
Preparing Data for AI
Data Vectorization
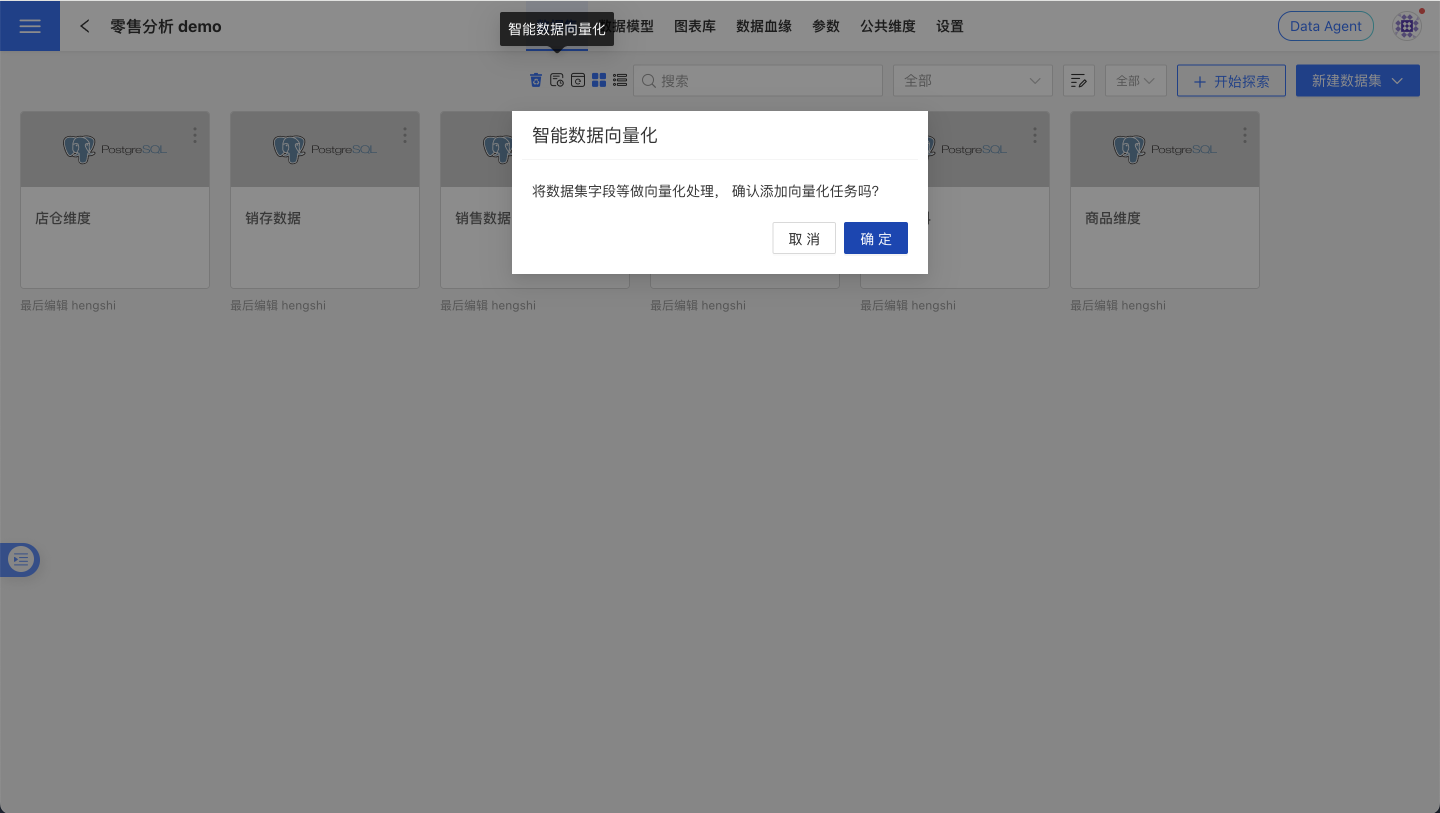
To more efficiently and accurately locate the most relevant information within massive data assets, it is recommended to perform "vectorization" on the data. Vectorization converts textual information such as field/atomic metric names, descriptions, and field values into computable semantic vectors, which are then written into a vector database. This enables the Data Agent to perform retrieval and recall based on semantics, rather than relying solely on keyword matching.
Benefits of Vectorization:
- Higher relevance: Understands synonyms, industry terms, and context, reducing missed and false detections.
- Faster response: Narrows the search scope and reduces the context-filling cost for large models.
- Greater scalability: Supports semantic association and knowledge linking across datasets, and adapts to multilingual scenarios.
- Continuous optimization: Works with "Intelligent Learning" tasks to continuously improve Q&A quality based on human review results.
Operation Steps:
- Go to the target dataset page and click "Vectorize" in the action bar.
- In System Settings - Task Management - Execution Plan, check the progress and enable scheduled tasks as needed to improve recall stability and coverage.
Note
The maximum number of distinct field values for vectorization is 100,000.
Data Management
Good data management is the foundation for Data Agent to correctly understand business semantics and metric definitions. By standardizing naming conventions, completing field/metric descriptions, properly setting data types, and hiding or cleaning up irrelevant objects, you can significantly improve Q&A relevance and response speed, reduce large model context costs, and minimize misunderstandings. It is recommended to perform self-checks according to the following checklist before publishing a data package and during routine maintenance; using this in conjunction with "Data Vectorization" and "Intelligent Learning" will yield even better results.
- Dataset Naming: Ensure that dataset names are concise and clear, accurately reflecting their purpose.
- Field Management: Ensure that field names are concise and descriptive, and avoid using special characters. Provide detailed explanations of each field's purpose in the Field Description, such as "Default for use as timeline." Additionally, the field type should match its intended use; for example, fields that require summation should use numeric types, and date fields should use date types, etc.
- Metric Management: Ensure that atomic metric names are concise and descriptive, and avoid using special characters. Provide detailed explanations of each metric's purpose in the Atomic Metric Description.
- Field Hiding: For fields not involved in Q&A, it is recommended to hide them to reduce the number of tokens sent to the large model, improve response speed, and lower costs.
- Distinguishing Fields and Metrics: Ensure that field names and metric names are not similar to avoid confusion. Fields not needed for answering questions should be hidden, and unnecessary metrics should be deleted.
- Intelligent Learning: It is recommended to trigger the "Intelligent Learning" task to convert general examples to dataset-specific examples. After execution, manually review the learning results and make additions, deletions, or modifications as needed to enhance the assistant's capabilities.
Enhancing Understanding of Complex Calculations
By predefining reusable business metrics on the data side and exposing them as Metrics, you can achieve higher accuracy, stability, and interpretability in data query scenarios.
Best Practices:
- Provide unified domain definitions for industry-specific metrics (such as financial risk control, ad placement, e-commerce conversion), and maintain synonym mappings in the Knowledge Management section of the Dataset.
- Establish a "Business Term → Metric" mapping for easily confused concepts (such as "Conversion Rate," "ROI," "Repeat Purchase Rate") to prevent models from freely combining fields.
- Prioritize using "Metrics" to carry business definitions rather than temporary calculation expressions in single conversations; for critical metrics, it is recommended to establish versioning and change logs to prevent metric drift.
Example (ROI):
- Advertising/E-commerce: ROI = GMV ÷ Advertising Spend. Please specify in the metric description whether coupons are included, whether refunds and shipping fees are deducted, whether platform service fees are included, the statistical standard (such as "payment time/order time"), and the time window (such as calendar day/week/month).
- Manufacturing/Projects: ROI = (Revenue − Cost) ÷ Cost, with the window being the full project lifecycle or financial period.
Usage Scenarios
The agent mode of Data Agent has the following features:
- No Restriction on Conversation Source
Data Agent will autonomously determine user intent based on the user's input, decompose user requirements, and perform hybrid retrieval from the Dataset Marketplace, App Marketplace, and App Creation within the user's authorized data scope. It will then analyze and query data from the target data sources to provide answers.
- Complex Problem Decomposition
Data Agent not only supports conventional data query tasks but also allows users to input multiple questions at once, especially when there are logical dependencies between them. Data Agent will perform one or multiple data queries depending on the complexity of the requirements.
- Context Awareness
Data Agent can read the information of the logged-in account and seamlessly understand demonstrative pronouns in user input (such as "my department" and other user attributes). Additionally, it can read the page information the user is currently viewing. When the user is on a specific Data Package, Dataset, or Dashboard page, the Agent will interact directly based on the information of the current page when handling data queries and other requests.
With these capabilities, Data Agent can serve as a visual creation assistant, metric creation assistant, or analyst assistant, among other roles.
Intelligent Data Query
After upgrading the Data Agent, intelligent data queries are no longer limited to a finite data scope, and manual selection of the scope is no longer required to initiate queries. This means the agent's tasks will involve content discovery, ad-hoc analysis, or insights.
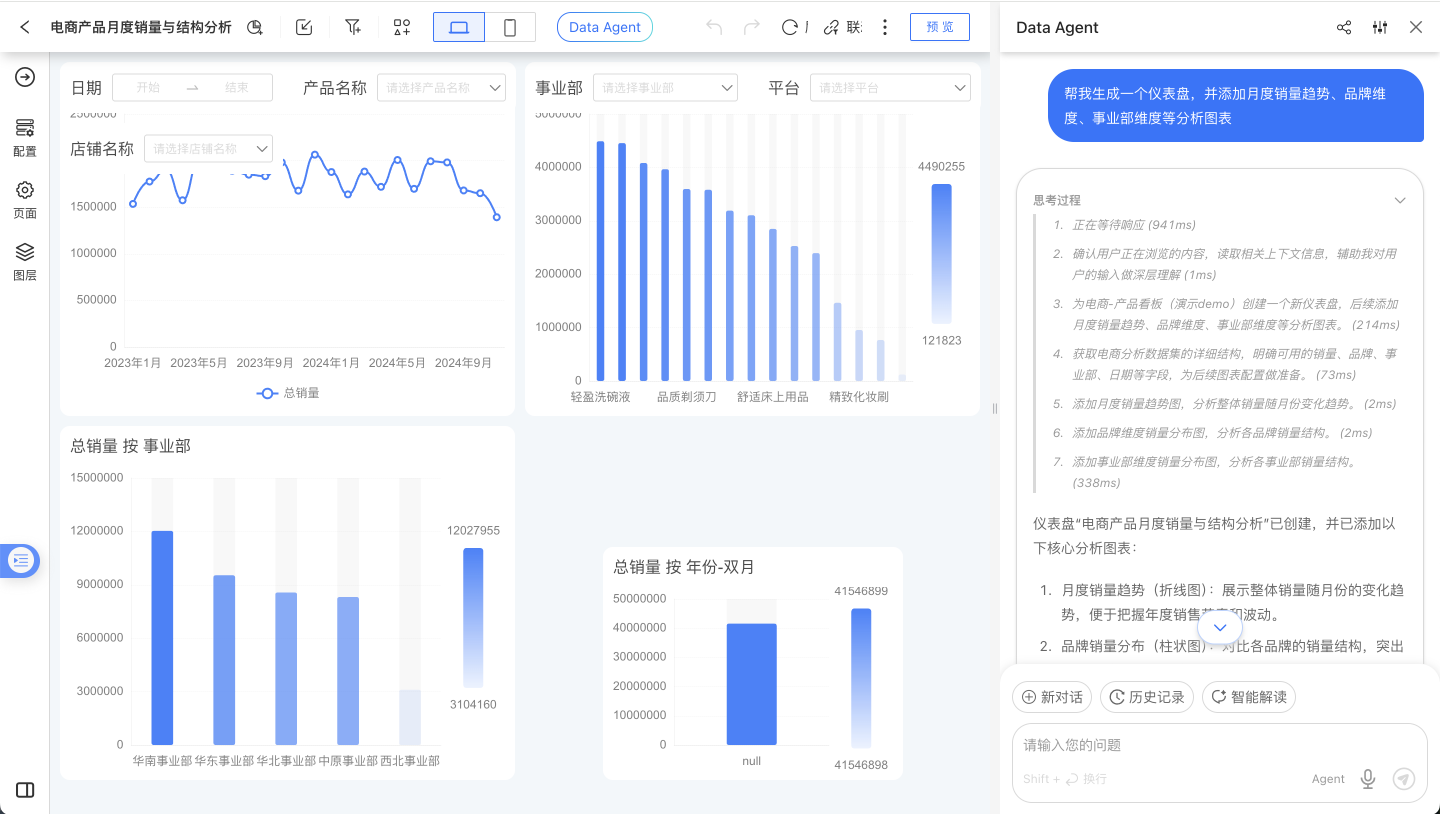
Visual Creation
Data Agent allows users to start creating a dashboard from scratch on the dashboard list page, or directly edit an existing dashboard. Whether it's chart creation, adding filters, analyzing data and adding rich text reports, or adjusting dashboard layout, modifying colors, or performing batch operations on controls.
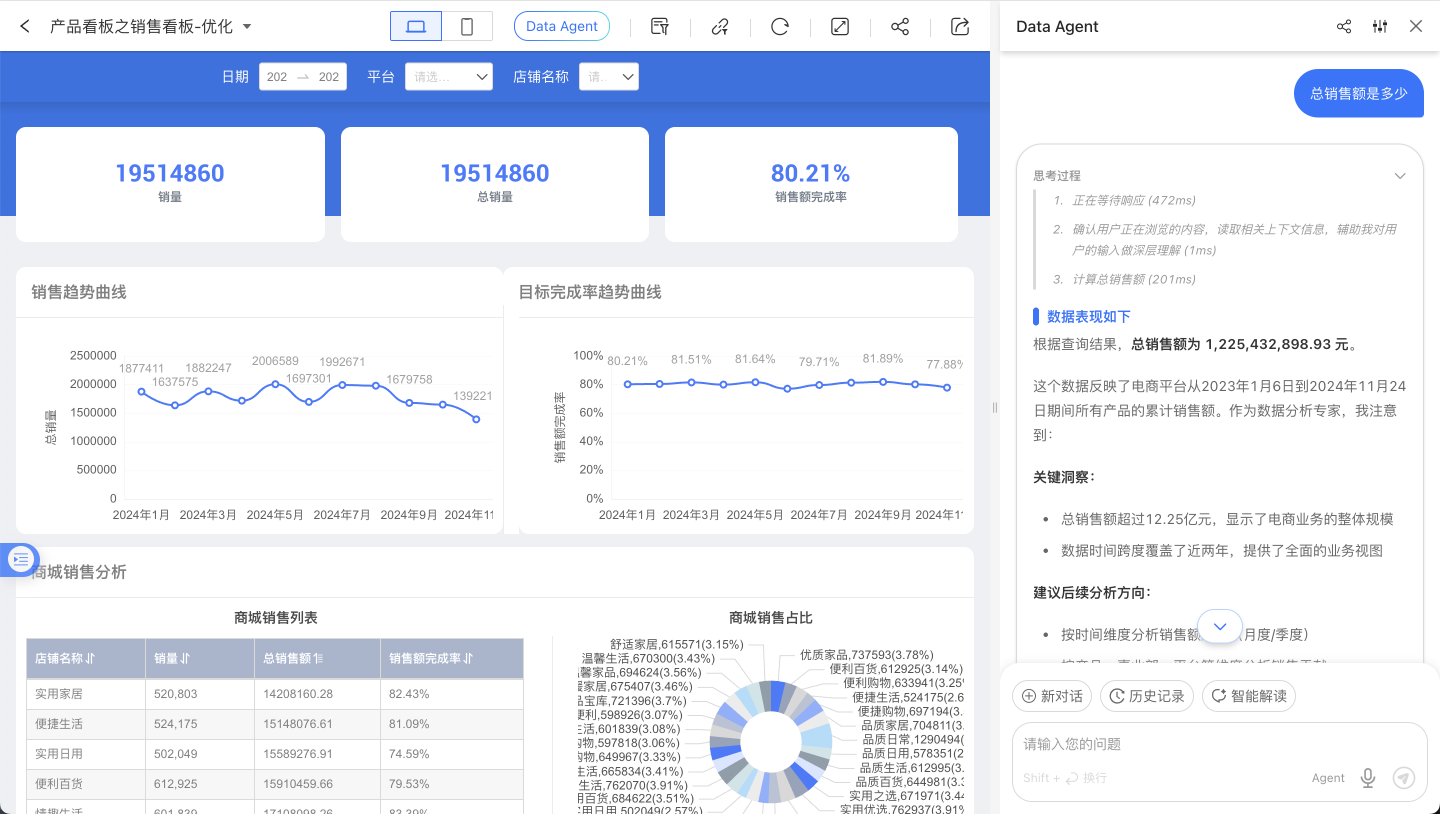
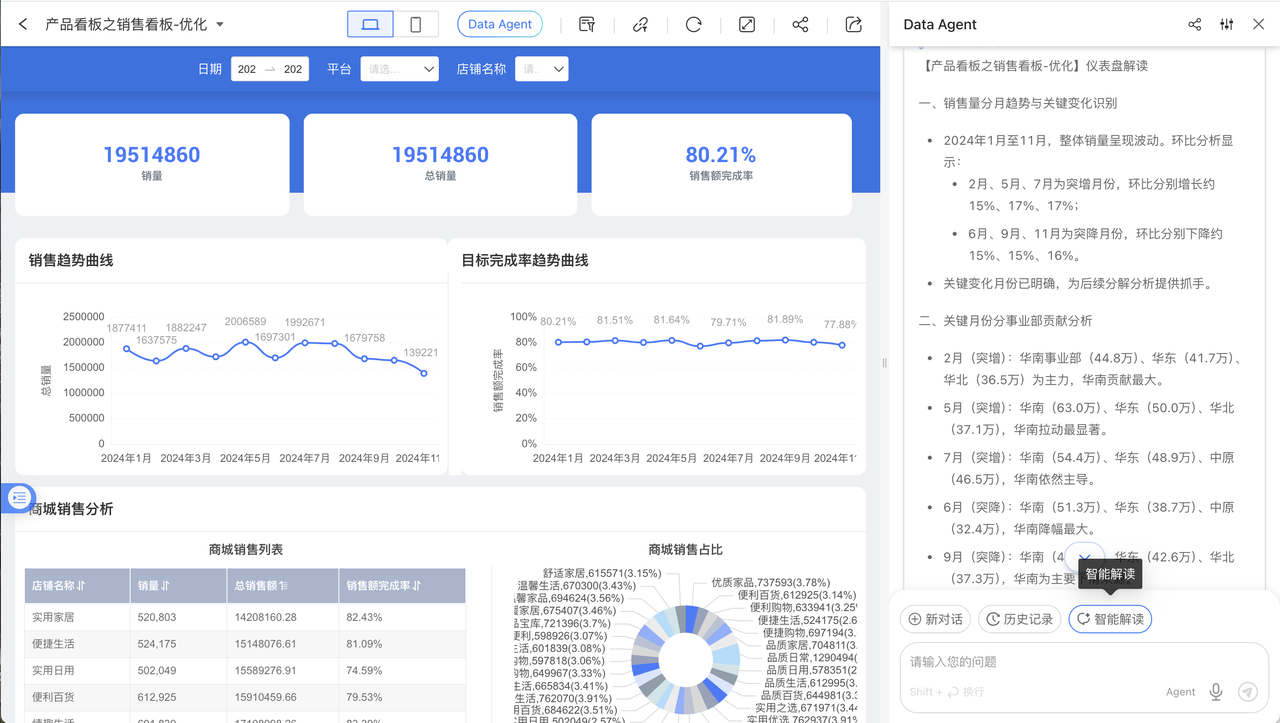
Intelligent Interpretation
To facilitate business users in conducting business data analysis, regular reviews, and data interpretation with Data Agent, we have added the "Intelligent Interpretation" configuration and shortcut button. On the Dashboard page, a "Intelligent Interpretation" button will appear in Data Agent. By clicking it, Data Agent will follow the pre-configured interpretation logic to perform real-time data queries, anomaly detection, decomposition, and drill-down, and finally provide an interpretation report.
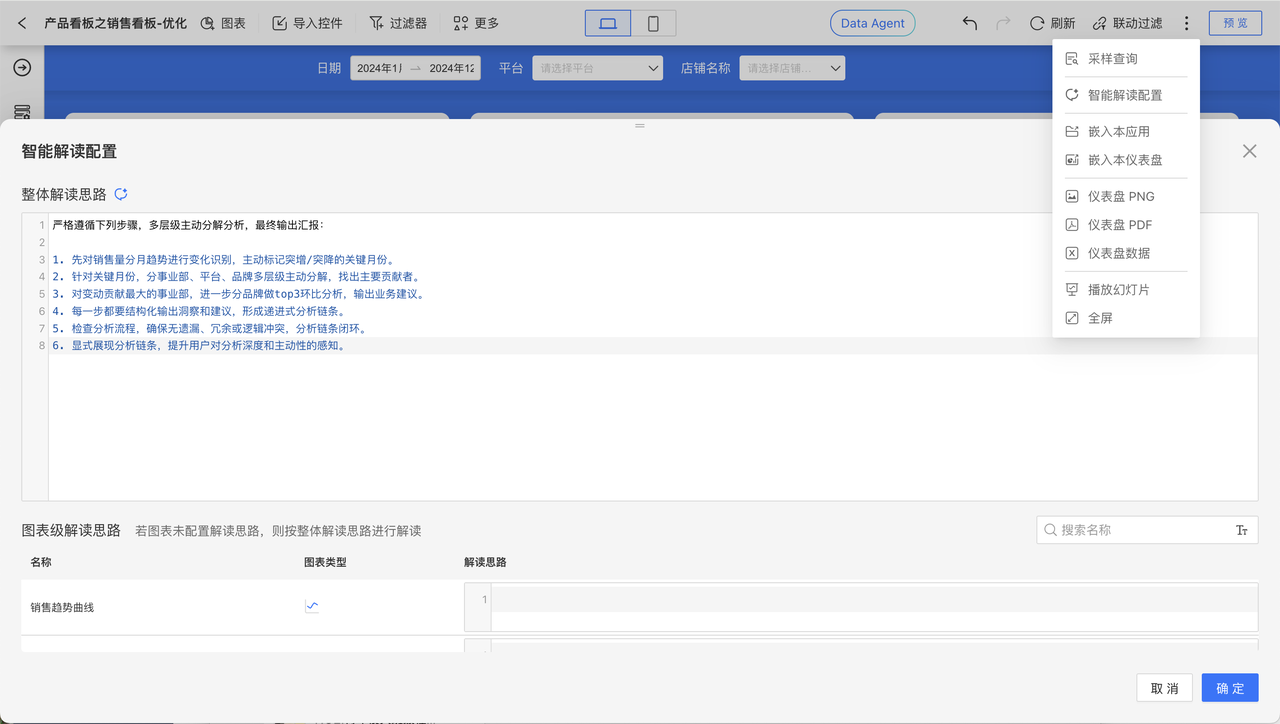
When editing a dashboard, you can click to open the "Intelligent Interpretation Configuration" from the dropdown menu in the upper right corner. Here, users can configure fixed interpretation logic according to their business needs, or click a button to let AI analyze the dashboard structure and data to generate an interpretation logic template. Each chart on the dashboard also supports individual interpretation logic configuration. There is an "Intelligent Interpretation" button in the upper right corner of the chart widget; clicking it will invoke Data Agent and send an interpretation command.
The Intelligent Interpretation feature leverages artificial intelligence technology to perform automated analysis on user-specified data scopes. Its core capabilities and boundaries are as follows:
- Data Query and Extraction: Quickly locate and extract relevant information from data sources based on user instructions or built-in analysis logic.
- Data Summarization and Induction: Integrate, aggregate, and condense query results across multiple dimensions to reveal key facts, patterns, and current status within the data.
- Generate Descriptive Reports: Output analysis results in the form of structured reports or concise text summaries to help users understand "what happened in the past" and "what the current situation is."
Note that Intelligent Interpretation does not perform predictive inference. This feature strictly analyzes existing and historical data, and its output is a description and summary of established facts. It cannot predict future data trends, business outcomes, or any probabilistic events that have not yet occurred.
Note
Complex reports and complex tables are not supported by Intelligent Interpretation.
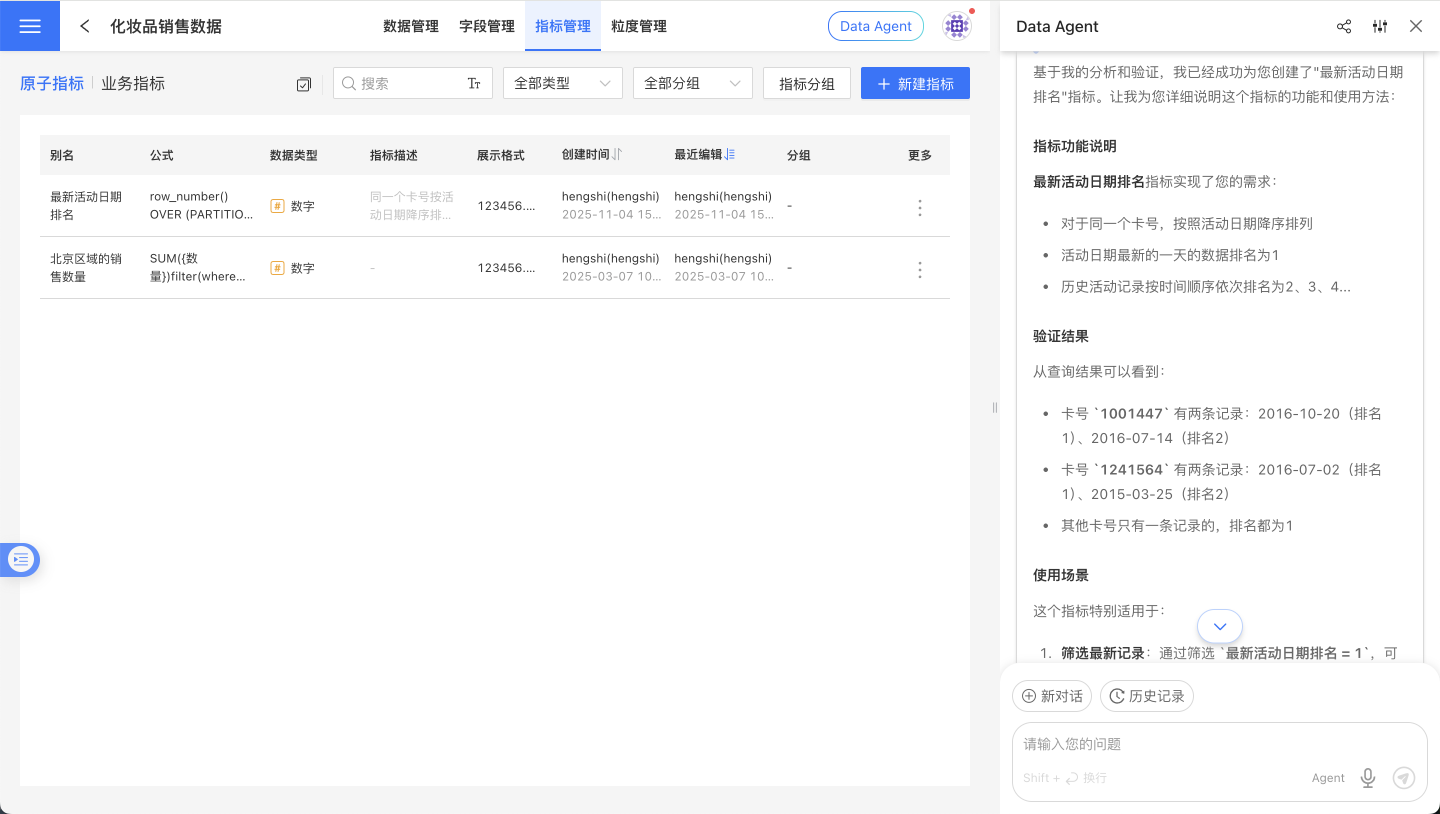
Expression Writing
Based on its understanding of HQL, Data Agent can assist users in writing complex expressions and creating metrics.
Debugging and Tuning
Agent and Workflow each support different prompt instructions for performance tuning. Refer to the specific documentation: Agent Tuning, Workflow Tuning.
Integrating ChatBI
HENGSHI SENSE offers multiple integration methods, allowing you to choose the most suitable option based on your needs.
Quick Selection Guide
| Scenario | Recommended Solution | Development Effort |
|---|---|---|
| Quick integration, no custom UI required | iframe Integration | ⭐ Minimum |
| Custom UI, enhanced interaction | SDK Integration | ⭐⭐⭐ |
| Integration with third-party applications | API Integration | ⭐⭐⭐⭐ |
| Integration within enterprise communication tools | Data Q&A Bot | ⭐⭐ |
IFRAME Integration
Best for: Scenarios with few front-end engineers and rapid deployment needs
Use iframe to integrate ChatBI into your existing system, achieving seamless connectivity with the HENGSHI SENSE platform. Directly reuse the ChatBI conversation components, styles, and features from HENGSHI SENSE without additional development.
SDK Integration
Best suited for: scenarios requiring custom interaction logic or request interception
Integrate ChatBI via the JS SDK, providing a complete conversational interface component, while supporting advanced features such as custom API requests and request interception.
Key Features:
- Pure JavaScript, framework-independent (compatible with Vue, React, etc.)
- Provides a complete conversational UI component, ready to use out of the box
- Draggable and resizable floating window
- Supports custom initialization configurations (data source, language, theme, etc.)
- Supports custom request interceptors
Quick Start:
- Obtain the SDK link from the system:
<host>/assets/hengshi-copilot@<version>.js - Import the SDK in HTML and initialize it
- Use the API to control the display/hide of the chat dialog
For detailed integration instructions, refer to the JS SDK Documentation
API Integration
Best suited for: Scenarios involving integration with third-party applications or workflows
Integrate ChatBI capabilities into applications such as Feishu, DingTalk, WeCom, and Dify Workflow through the backend API, enabling customized business logic.
For the Dify Workflow tool, refer to the attachment HENGSHI AI Workflow Tool v1.0.1.zip
Data Q&A Bot
Best suited for: Scenarios where data Q&A is integrated into enterprise instant messaging tools
Create intelligent data Q&A bots through the Data Q&A Bot feature, linking relevant data in HENGSHI ChatBI to enable conversational data queries within enterprise communication tools.
Supported communication tools: WeCom, Feishu, DingTalk
Frequently Asked Questions
How to Troubleshoot Query Failures and Errors?
Failures and errors involve diagnosis across multiple stages. When encountering an issue, please collect the following information and contact the after-sales engineer:
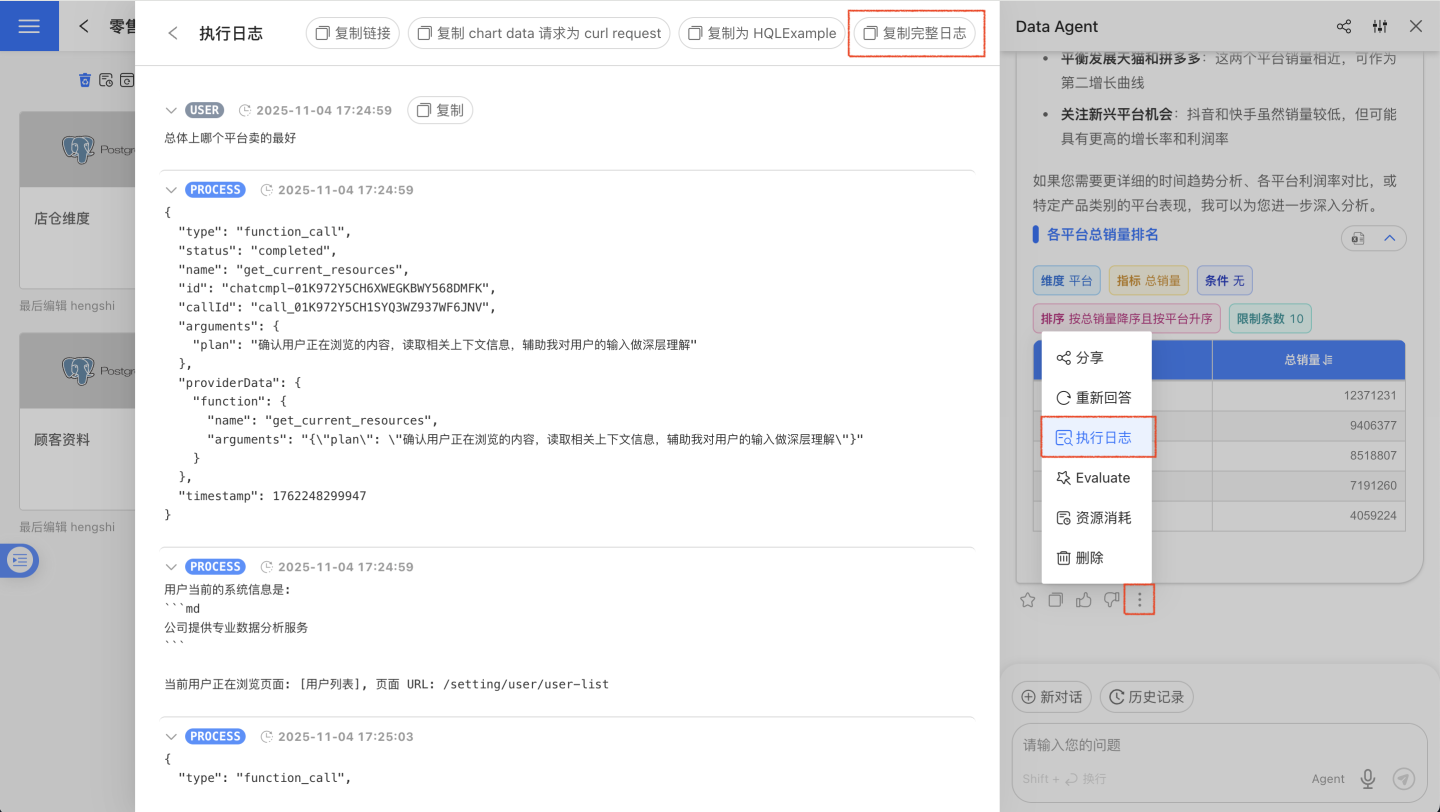
- Click the three-dot menu below the conversation card, select "Execution Log," and then click "Copy Full Log."
- Press F12 on your keyboard or right-click and select "Inspect" to open the browser console. Click "Network" - "Fetch/XHR."
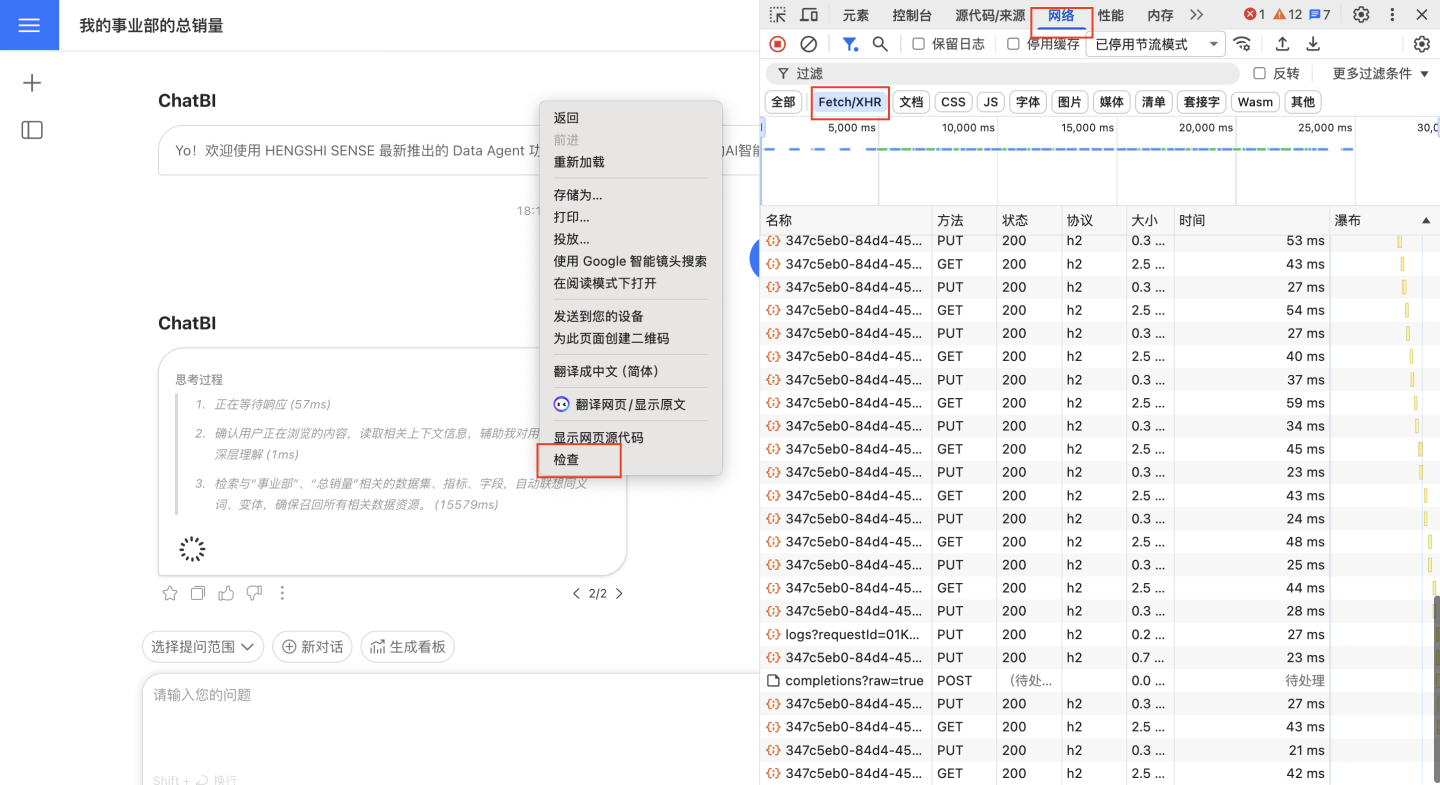
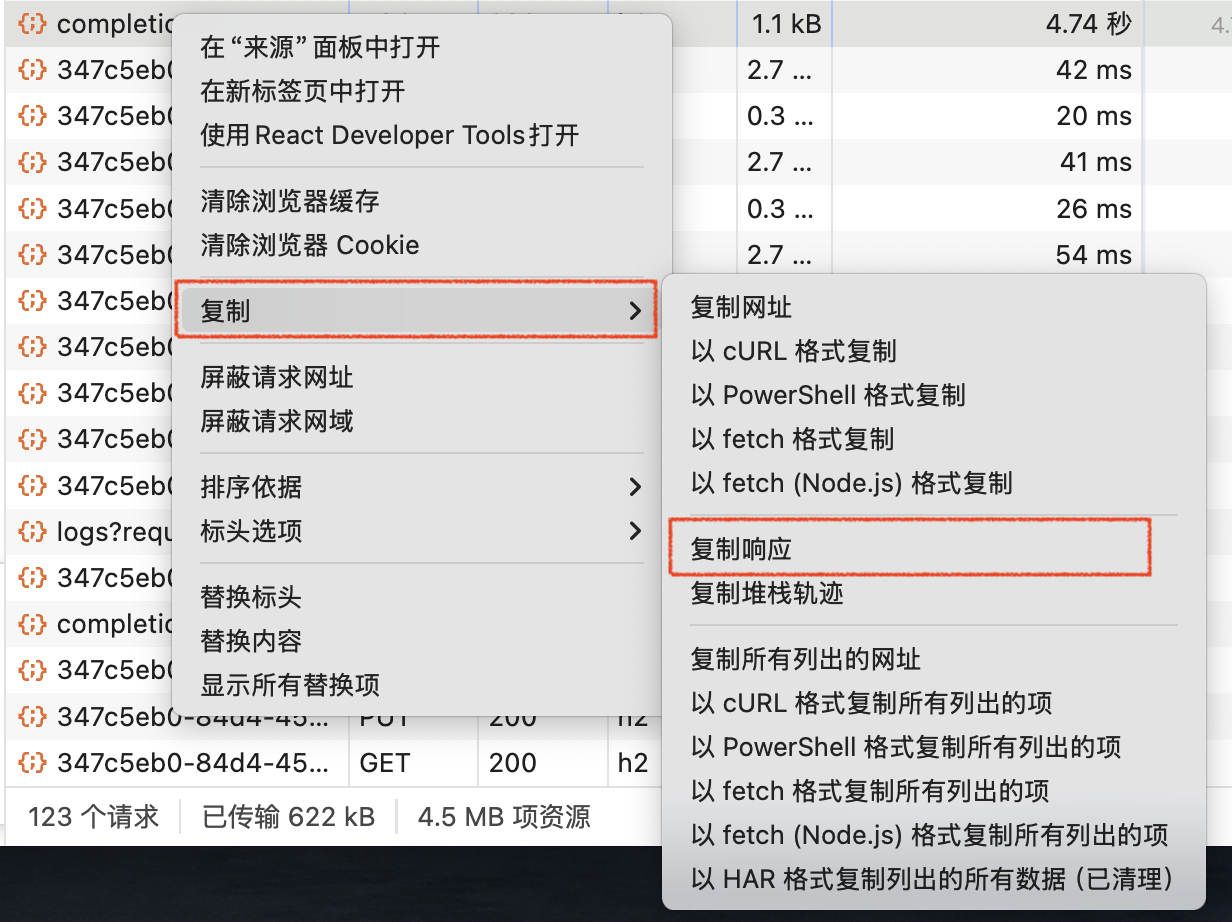
Reproduce the error by querying again, then right-click the failed network request and select "Copy" - "Copy Response."
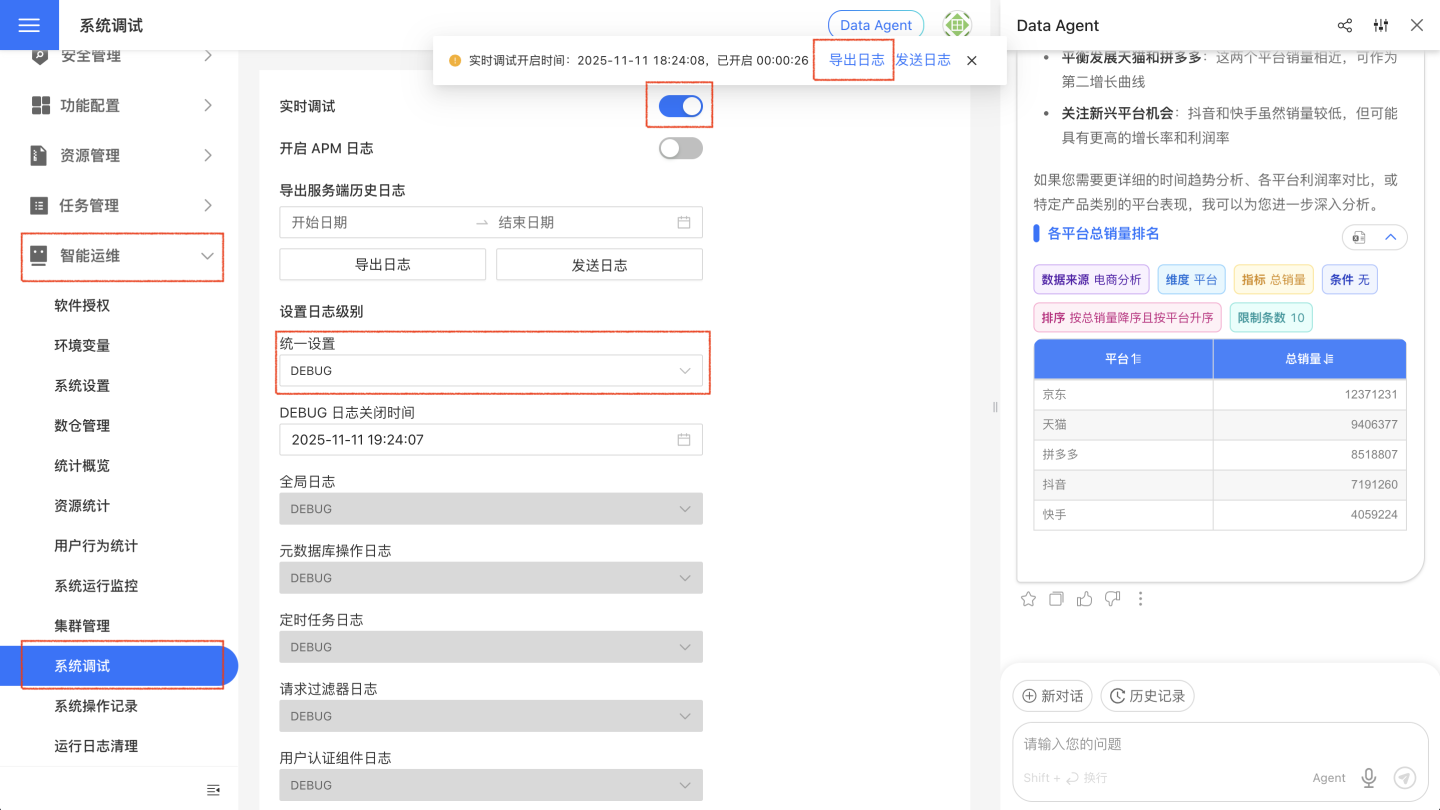
- Go to "System Settings" - "Intelligent Operations" - "System Debug," set "Unified Settings" to "DEBUG," enable "Real-time Debugging," reproduce the error by querying again, and then click "Export Log."
How to Fill in the Vector Database Address?
Simply complete the installation and deployment of the relevant services according to the AI Assistant Deployment Documentation; manual entry is not required.
Are other vector models supported?
Currently, they are not supported. If you have any requirements, please contact our after-sales engineer.
What are the differences between the Data Agent sidebar and ChatBI?
| Capability | Data Agent Sidebar | ChatBI |
|---|---|---|
| Intelligent Q&A with specified data source | ✅ | ✅ |
| Intelligent Q&A with unlimited data sources | ✅ | ❌ |
| One-click dashboard generation from conversation charts | ❌ | ✅ |
| Visual-assisted creation | ✅ | ❌ |
| Metric-assisted creation | ✅ | ❌ |
| Intelligent interpretation | ✅ | ❌ |
What are the differences between Agent Mode, Workflow Mode, and API Mode?
| Capability | Agent Mode | Agent API Mode | Workflow & Workflow API Mode |
|---|---|---|---|
| Intelligent Q&A with specified data sources | ✅ | ✅ | ✅ |
| Intelligent Q&A with unlimited data sources | ✅ | ✅ | ❌ |
| Visual-assisted creation | ✅ | ❌ | ❌ |
| Metric-assisted creation | ✅ | ❌ | ❌ |
| Intelligent interpretation | ✅ | ❌ | ❌ |