

DuPont Analysis
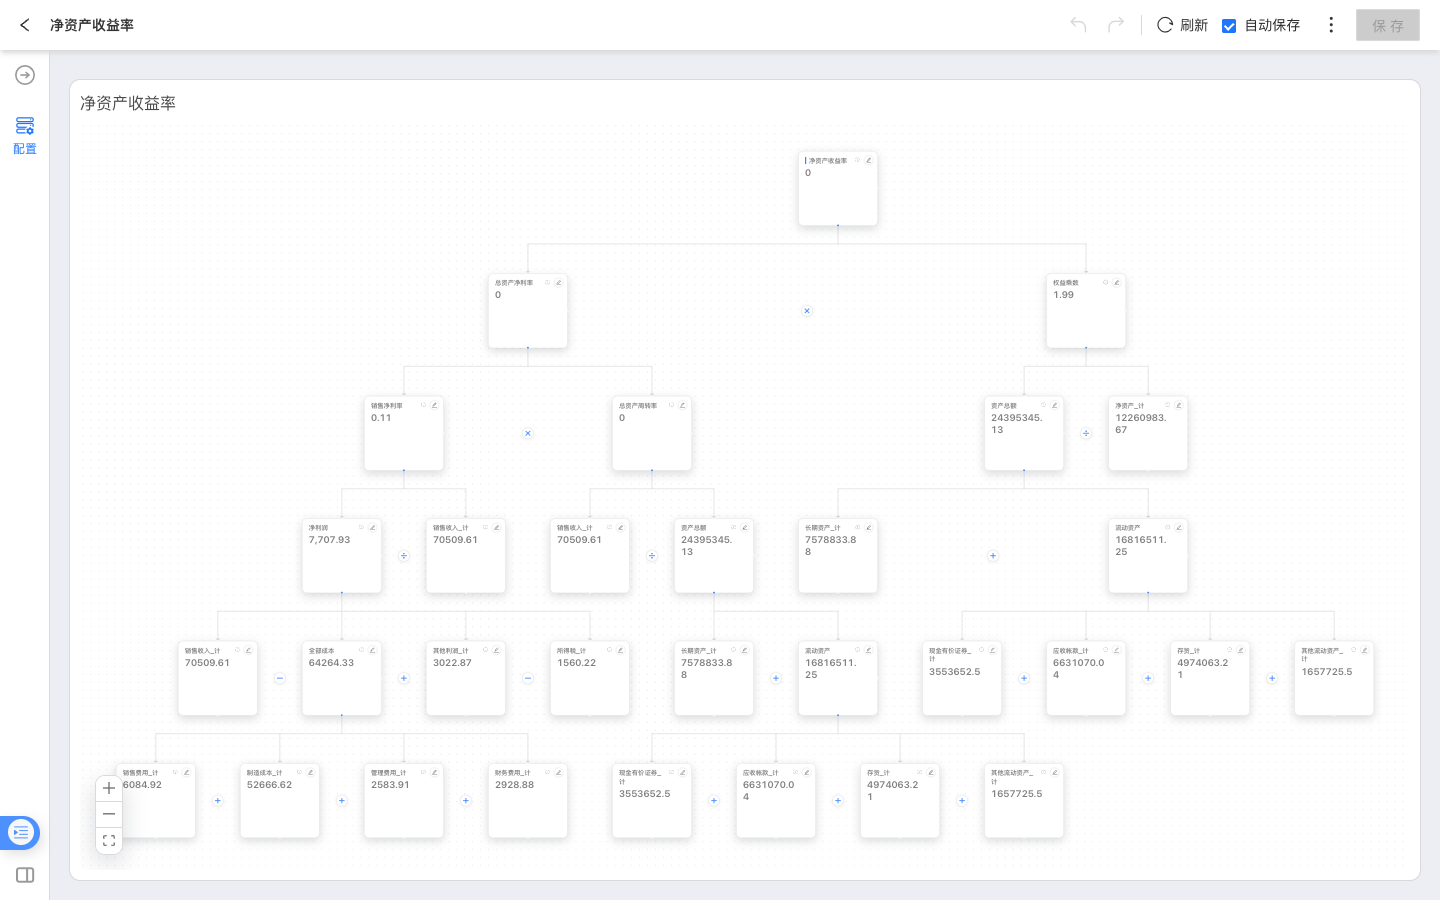
The DuPont Analysis chart breaks down a core business metric into related metrics, helping analysts understand which metrics affect the final result. It is suitable for financial performance, operational efficiency, cost and profit, and other scenarios where users need to trace a metric layer by layer. For example, “Return on Equity” can be expanded into related metrics such as “Return on Total Assets,” “Net Profit Margin,” and “Equity Multiplier.”
DuPont Analysis is a chart type in dashboards of analytical apps. When creating a chart, select a measure-subject business metric as the root metric. The system generates a breakdown skeleton based on metric lineage and metric expressions, and displays the current value of each node in the chart.
Prerequisites
- DuPont Analysis only supports measure-subject business metrics.
- The root metric must be a measure-subject business metric. After the root metric is selected, the system generates the breakdown skeleton from its metric lineage.
- To make dashboard filters or in-chart filters affect a metric, configure the corresponding analyzable dimension or time axis for that metric.
Create a DuPont Analysis Chart
- In an analytical app, open a dashboard and click to create a new chart control.
- Select the data source and dataset, then switch the chart type to DuPont Analysis.
- In the configuration panel, select or drag a measure-subject business metric as the root metric.
- The system loads the metric lineage of the root metric and syncs related metrics into nodes in the DuPont Analysis chart.
- Save the chart, then view the DuPont Analysis result in the dashboard.
View the Breakdown
A DuPont Analysis chart consists of nodes and edges.
- Node: represents a business metric in the breakdown. The node displays the metric name and current value.
- Edge: represents a calculation or dependency relationship between metrics. Edges can show relationship types such as formula, filter, and dimension.
- Breakdown skeleton: represents the main lineage expanded from the root metric, helping users trace where the metric result comes from.
Click the information icon on a node to view the expression or description of the corresponding metric.
Configure Nodes
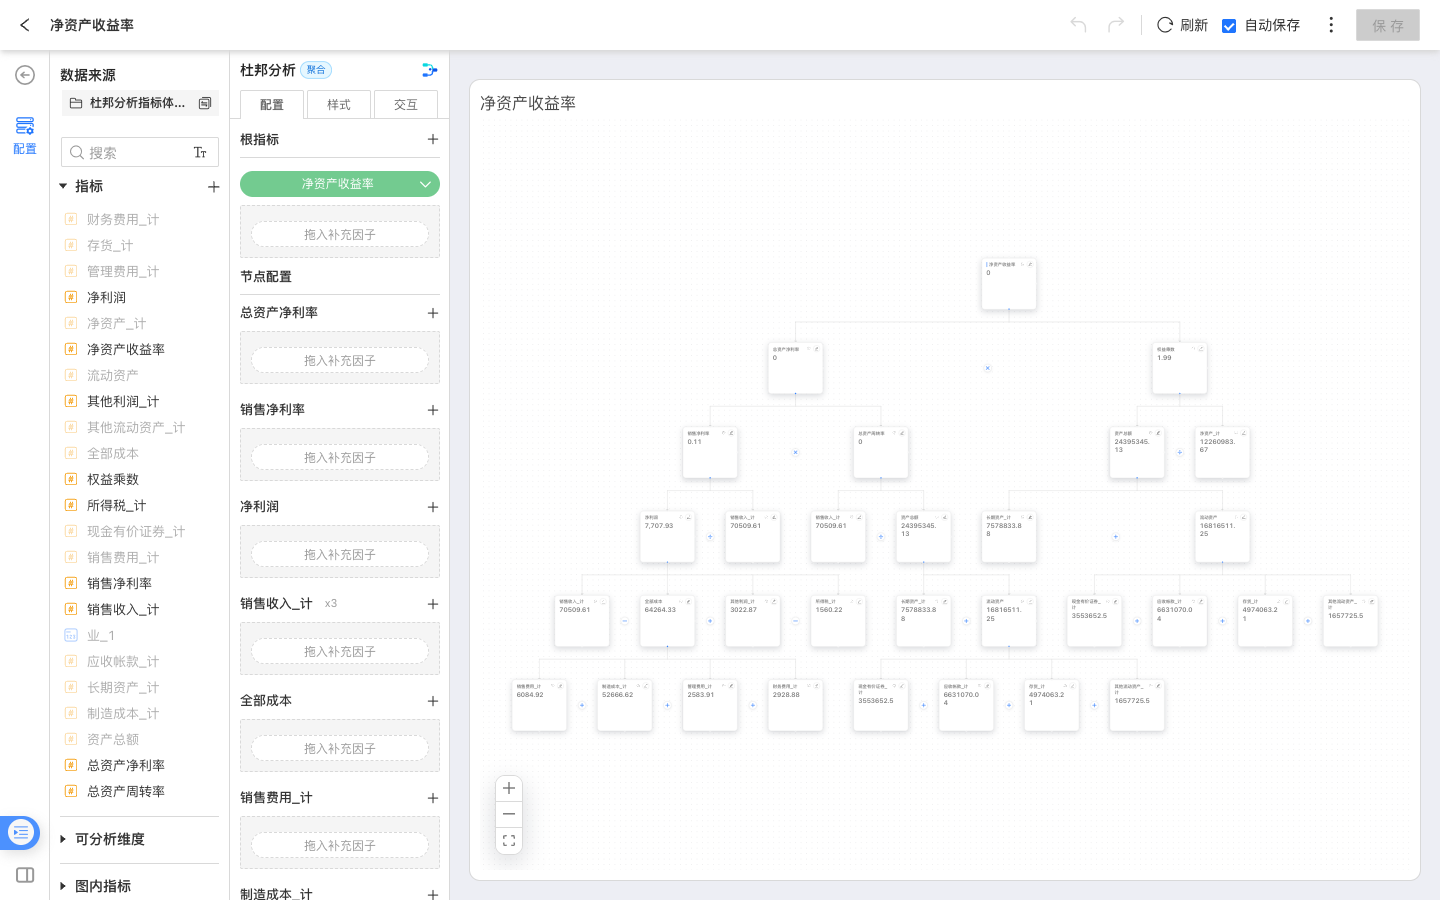
In the Node settings area of the configuration panel, you can add more analysis context for each node.
Comparison Value
Nodes support comparison values for comparing the current result with another period. The comparison-period menu includes Same Period in Previous Quarter. This option calculates the comparison value from the corresponding time range in the previous quarter and is useful for quarter-over-quarter analysis. When trend hints are enabled, the chart can use colors or arrows to show the direction of change.
Comparison values are configured per node. To compare multiple nodes, select a comparison period for each node separately.
Supplementary Factor
Supplementary factors display related metrics beside a node when those metrics are useful context but are not part of the main breakdown lineage. Supplementary factors are display-only and do not participate in DuPont recalculation.
If a metric is already part of the main DuPont lineage, it does not need to be added again as a supplementary factor.
Scenario Assumptions
DuPont Analysis supports entering assumed values for nodes and running a simulation. The system recalculates affected nodes based on the current metric lineage, helping analysts estimate the downstream impact of metric changes.
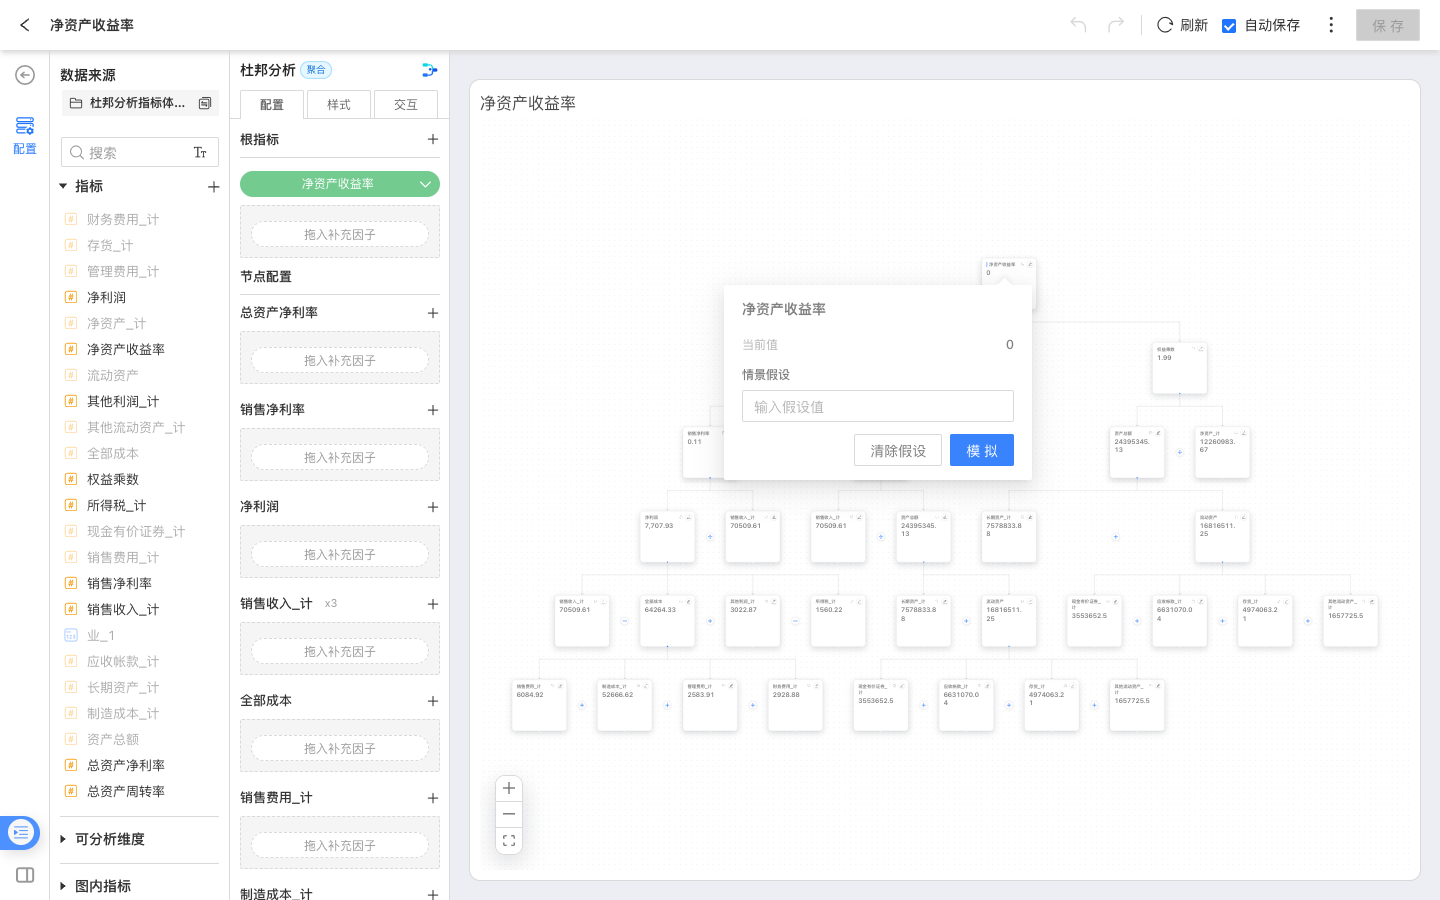
When dashboard filters, in-chart filters, or the time context changes, existing simulation results may no longer match the current data range. Run the simulation again in that case.
Style Settings
In the Style panel, you can adjust the display of the DuPont Analysis chart, including:
- Layout: horizontal or vertical.
- Density: compact, standard, or comfortable.
- Edges: whether to show operator labels.
- Comparison and emphasis: trend hints and card emphasis.
Notes
- DuPont Analysis depends on the metric lineage of the root metric. If the root metric has no breakdown relationship, the chart only displays the root metric node.
- Dashboard filters only affect metrics that have the corresponding analyzable dimension or time axis. If different metrics have different analyzable dimensions, the filter scope may also differ.
- Supplementary factors provide business context only. They do not participate in the main-lineage calculation and do not change the root metric result.